doi: 10.3389/fphys.2018.00021
Edited by:
Giuseppe D’Antona, University of Pavia, Italy
Reviewed by:
Capelli Carlo, Norwegian School of Sport Sciences, Norway Jean Slawinski, Université Paris Nanterre, France
*Correspondence:
Simone Porcelli [email protected]
Specialty section:
This article was submitted to Exercise Physiology, a section of the journal Frontiers in Physiology
Received:21 September 2017
Accepted:09 January 2018
Published:24 January 2018
Citation:
Pugliese L, Porcelli S, Vezzoli A, La Torre A, Serpiello FR, Pavei G and Marzorati M (2018) Different Training Modalities Improve Energy Cost and Performance in Master Runners. Front. Physiol. 9:21. doi: 10.3389/fphys.2018.00021
Different Training Modalities Improve
Energy Cost and Performance in
Master Runners
Lorenzo Pugliese1, Simone Porcelli1*, Alessandra Vezzoli1, Antonio La Torre2,
Fabio R. Serpiello3, Gaspare Pavei4and Mauro Marzorati1
1Institute of Molecular Bioimaging and Physiology, National Research Council, Segrate, Italy,2Department of Biomedical
Sciences for Health, Università degli Studi di Milano, Milan, Italy,3Institute of Sport, Exercise and Active Living, College of
Sport and Exercise Science, Victoria University, Melbourne, VIC, Australia,4Department of Pathophysiology and
Transplantation, Università degli Studi di Milano, Milan, Italy
Purpose: The aim of this study was to compare the effects of continuous
moderate-intensity and discontinuous high-intensity training on running performance in master runners.
Methods: Thirty-four male master runners (47.2 ± 7.4 years) were assigned to
three different groups: continuous moderate-intensity training (CMIT), discontinuous high-intensity training (DHIT), and control group (CON). CMIT and DHIT performed
8-week of supervised training (3 session·wk−1; ∼35 km·wk−1) while CON maintained
their normal training habits (3–4 session·wk−1; ∼50 km·wk−1). Peak oxygen
consumption (˙VO2peak) and peak running speed (vpeak) during incremental treadmill
exercise, gas exchange threshold (GET), speed at GET, energy cost of running (Cr), and 5-km performance were evaluated before and after training.
Results: Following the training period, both CMIT and DHIT significantly reduced Cr
(−4.4 and −4.9%, respectively, P < 0.05), increased speed at GET (3.4 and 5.7%,
P<0.05) and improved 5-km time-trial performance (3.1 and 2.2%,P<0.05) whereas
no differences were found for ˙VO2peak and GET (as %˙VO2peak). After training, vpeak
improved only for DHIT (6%,P <0.05). No differences were found in any variable for
CON.
Conclusions: This study indicates that both CMIT and DHIT may positively affect
running performance in middle-aged master runners. This improvement was achieved despite a significant reduction of the amount of weekly training volume.
Keywords: discontinuous high-intensity training, continuous moderate-intensity training, energy cost, performance, endurance athletes
Abbreviations:V˙O2, oxygen consumption;V˙E, pulmonary ventilation;V˙CO2, Carbon dioxide production;V˙O2peak, peak
oxygen consumption;V˙O2max,maximal oxygen consumption;f ˙VO2max, fraction of maximal oxygen consumption; vpeak,
maximal speed; [La−]b, blood lactate concentration; BTPS, body temperature, pressure, and saturated; CLE, Constant load
INTRODUCTION
Master athletes are typically defined as men and women older than 35 years who continue physical training throughout life and compete in organized events. The number of masters athletes involved in sport activities is continuously increasing, particularly in long-distance running events (Tanaka and Seals, 2008). For instance, statistics from United States indicate that marathon finishers aged over 40 years were 37,180 (26% of total finishers) in 1980, and 249,410 (49% of total finishers) in 2015 (Running USA Annual Marathon Report, 2015)1
Master athletes are still capable of accomplishing outstanding performances (Trappe et al., 2013). However, exercise performance inevitably declines with aging despite regular training and participation in sporting competitions (Donato et al., 2003; Reaburn and Dascombe, 2008; Tanaka and Seals, 2008; Brisswalter and Nosaka, 2013). VO˙ 2max seems to be the
major determinant of this decrease whereas running economy and lactate threshold, when expressed relative to the percentage of VO˙ 2max, appear well preserved with aging (Reaburn and Dascombe, 2008; Tanaka and Seals, 2008; Brisswalter and Nosaka, 2013).
In endurance master athletes, age-associated reduction in ˙
VO2max is due to a decline in both maximal cardiac output
and maximal arterio-venous oxygen difference and it is likely mediated by a reduction in the exercise training “stimulus” (i.e., exercise-training intensity, session duration, and weekly frequency). Indeed, master athletes have often less time for training than young athletes do and the increased job- and family-related responsibilities may impinge on the availability of time and energy for the intensive training required to remain competitive (Tanaka and Seals, 2008). In addition, training stimulus can be inadequate because few master athletes still have coaches or follow structured training programs. The increased prevalence of exercise training-associated injuries in this population probably also contributes to their reduced training intensity and volume (Reaburn and Dascombe, 2008).
In general, the main modalities of training used to improve endurance exercise performance are: (i) continuous training at low- to moderate-intensity (CMIT) characterized by high volumes of training (> 30 min per session) with intensities below the “anaerobic threshold” or between 60 and 80% of
˙
VO2max (Kubukeli et al., 2002; Laursen and Jenkins, 2002; Seiler and Kjerland, 2006) and (ii) discontinuous high-intensity training (DHIT) characterized by repeated short bouts of exercise performed at an intensity corresponding to VO˙ 2max or above,
separated by brief periods of low-intensity work or inactivity which allow a partial but often not a full recovery of resting heart rate andVO˙ 2 values (Kubukeli et al., 2002; Laursen and Jenkins, 2002; Gibala et al., 2006). Until a few years ago, it was widely believed that DHIT was a prerogative of elite athletes or recreational runners accustomed to sustain strenuous efforts and exercises of low/moderate intensity and high-volume were primarily prescribed to sedentary or moderately trained subjects,
1Available online at http://www.runningusa.org/marathon-report-2016?
returnTo=annual-reports.
as this was considered safer and effective to improve aerobic metabolism (Holloszy and Coyle, 1984; Laursen, 2010). However, several studies have shown that in adult sedentary or moderately trained subjects, DHIT might be an efficient strategy to improve running performance (Franch et al., 1998; Billat et al., 1999; Helgerud et al., 2007; Laursen, 2010). Indeed, an improved maximal oxygen uptake (VO˙ 2max) (Milanovi´c et al., 2015) and
a reduced energy expenditure at submaximal running speeds (Franch et al., 1998; Billat et al., 1999; Helgerud et al., 2007; Iaia et al., 2009) have been reported and it is widely accepted that these both factors, in addition to the ability to sustain a high percentage ofVO˙ 2maxfor an extended period of time (f ˙VO2),
are the main physiological determinants of running performance (di Prampero, 1986; Capelli, 1999).
To the best of our knowledge, there is a lack of data on the effects of DHIT programs in middle-aged master runners with several years of training experience. Thus, the aim of this study was to compare the effects of CMIT and DHIT programs, characterized by the same volume, on running performance and the main physiological variables related to endurance performance in master runners. A group of runners, who maintained their training habits, was utilized as control. Our hypothesis was that DHIT, by affecting VO˙ 2max and energy
cost of running, would be as effective as CMIT in ameliorating running performance.
MATERIALS AND METHODS
Participants
Thirty-four male master runners (age: 47.2±7.4 years, height: 1.75 ± 0.06 m, body mass: 70.0 ± 8.8 kg, body mass index: 23.0± 1.9 kg·m−2) participated in the study. Athletes had a
training experience of 15± 4 years and in the last 6 months
they reported an average training volume of ∼50 km·wk−1
with a training frequency of 3–4 sessions per week. Participants were not involved in a structured training program and they had independently managed their own training for at least 5 years. All of them competed at regional level on distances from 10 km to marathon. Before the start of the study, participants underwent a complete medical screening (medical history, physical examination, and ECG) to ensure that there were no contraindications to study participation. Each athlete was fully informed about the aims, methods and risks associated with participation and gave his written informed consent before the start of the study. All procedures were in accordance with the Declaration of Helsinki and the study was approved by the local Ethics Committee (IBFM-CNR-2013).
Study Design
Following the preliminary evaluation, participants were randomly assigned to three different groups: continuous moderate-intensity training (CMIT, n = 11); discontinuous high-intensity training (DHIT,n=11) and control group (CON, n = 12). All participants were tested before (PRE) and after 8-week of training (POST). Thirty participants successfully completed the study (CMIT,n=10; DHIT,n=10; and CON,
knee pain (CMIT group), and three for muscle injury occurred during training (one in DHIT and two in CON). Data obtained from these subjects were excluded from analysis.
Tests and Procedures
Participants were instructed to arrive at the laboratory in a rested and euhydrated state, about 3 h postprandial, and to avoid strenuous exercise in the 24 h preceding each testing session. In addition, they were invited to avoid alcohol and caffeine products intake 48 h before the exercise test. All laboratory exercise testing sessions were carried out in a well-ventilated laboratory at 19– 21◦
C on a motorized treadmill (Laufergotest, Jaeger, Germany) set at 1% gradient to compensate for air resistance cost (Jones and Doust, 1996). The speed was frequently checked by belt length and count of rotations while subjects were running. On the first day, subjects performed a ramp incremental exercise test (IE) for determination ofVO˙ 2peakand gas exchange threshold (GET).
The protocol began with subjects running at 8 km·h−1for 6 min
and the belt speed was thereafter increased by 1 km·h−1 every
minute until volitional exhaustion. The peak values of the main cardiovascular, respiratory, and metabolic parameters were taken as the highest 30-s mean value attained prior to the subject’s volitional exhaustion. The GET was determined as described previously (Beaver et al., 1986) and speed at GET was the speed equivalent at thatVO˙ 2value. Maximal speed (vpeak) reached at
the end of IE was also recorded.
At least 48 h following IE, subjects performed two repetitions of 6-min moderate intensity (at the speed equivalent to 60% of
˙
VO2peak) constant load exercise (CLE) exercise, separated by at
least a 20 min recovery period. Breath-by-breath data obtained in the two repetitions were pooled and time-aligned for each subject. Average steady-state values of the main cardiovascular, respiratory and metabolic parameters were calculated during the last 40–60 s of both trials. The energy cost of running (Cr, J·kg−1·m−1) was calculated during CLE as the ratio between
net VO˙ 2 (steady state VO˙ 2-VO˙ 2 measured at rest in standing
position, mL·kg−1·m−1) and the progression speed; the unit
conversion from mL O2 to metabolic J was achieved by
considering the mean respiratory exchange ratio (RER) value (Margaria et al., 1963). As previously reported (Margaria et al., 1963), Cr is speed independent, at least for speeds wherein the air resistance is negligible (approximately up to 18 km·h−1).
Finally, participants completed a 5-km time trial on a 400-m outdoor track. PRE and POST running test was perfor400-med twice, at least 5 days apart, and the best performance time recorded. Weather conditions (temperature, relative humidity, absence of wind) were consistent between the trials. During trials, subjects received only information regarding the number of laps remaining. Performance time was measured using a manual stopwatch.
Measurements
Pulmonary ventilation (VE, in BTPS), O˙ 2 consumption (VO˙ 2),
and CO2 output (VCO˙ 2), both in STPD, were determined
breath-by-breath by a metabolic cart (Vmax29c; SensorMedics, Bilthoven, The Netherlands). Expiratory flow was determined by a mass flow sensor (hot wire anemometer), calibrated before
each experiment by a 3 liters syringe at three different flow rates. ˙
VO2 and VCO˙ 2 were determined by continuously monitoring
PO2 and PCO2 at the mouth throughout the respiratory cycle
and from established mass balance equations. RER was calculated as VCO˙ 2/VO˙ 2. Calibration of O2 and CO2 analyzers was
performed before each experiment by utilizing gas mixtures of known composition. Heart rate (HR) was determined from the ECG signal continuously monitored throughout the tests. At rest and at various times (1, 3, 5, and 7 min) during recovery, 20µL of capillary blood was obtained from a preheated
earlobe for the determination of blood lactate concentration ([La−]b) by an enzymatic method (Biosen C-Line; EKF,
Germany).
Training Intervention
CMIT and DHIT groups trained 3 times per week during an 8-week period on a 400-m outdoor track. Three different types of training sessions were scheduled for each group, based on the individual speed at GET value. Total distance achieved during each session was calculated in order to obtain an identical training volume. For CMIT, sessions were: (i) 64.5 min at 70% speed at GET, (ii) 58.5 min at 80% speed at GET, and (iii) 54 min at 90% speed at GET. For DHIT, sessions were: (i) 18
× (1 min at 120% speed at GET followed by 2 min at 65% speed at GET), (ii) 18×(1 min at 130% speed at GET followed
by 2 min at 65% speed at GET), and (iii) 18 × (1 min at
140% speed at GET followed by 2 min at 65% speed at GET). All athletes in CMIT and DHIT groups received a detailed training plan before the start of the study and they trained under the supervision of a professional coach. As for CON, participants maintained their training habits during the 8-week period, consisting of 3/4 training session per week and about 50 km·week−1. No specific indications about training volume
and intensity were given to these subjects but HR, speed, and total distance of each session were recorded. Competitions were not allowed during the entire period of the study for all groups.
Statistical Analysis
Results are presented as box and whiskers plot. The box extends from the 25th percentile to the 75th percentile, with a bold line at the median value. In the text and tables, results are expressed as mean ± SD and 95% CI of the differences is also reported. Data were analyzed using a two-way ANOVA for repeated measures (groups×time), excluding training volume
RESULTS
Training Volume
During the 8 weeks, training volume was significantly lower (P=0.007) in both CMIT (34.1±3.1 km·wk−1) and DHIT (33.3 ±2.8 km·wk−1) compared to CON (51.8±13.4 km·wk−1).
Incremental Exercise
Mean values of the main cardiovascular, respiratory, and metabolic variables obtained at PRE and POST in CMIT, DHIT, and CON are shown in Table 1. All groups attained peak HR values corresponding to 95% of the age predicted maximum. Thus, taking into account also RER and [La−
]b
peak values, it can be assumed that maximum exercise capacity had in fact been reached in each condition. VO˙ 2peak did
not change in all groups (CMIT 47.6 ± 4.2 vs. 48.0 ± 6.5 mL·kg−1·min−1, CI 95%−2.2 to 2.9, ES 0.08trivial; DHIT 48.8 ± 5.5 vs. 49.0± 4.4 mL·kg−1·min−1, CI 95%−2.3 to 2.8, ES
0.05 trivial; CON 48.4 ± 4.4 vs. 48.3 ± 4.0 mL·kg−1·min−1,
CI 95% −2.6 to 2.5, ES 0.02 trivial, at PRE and POST, respectively).
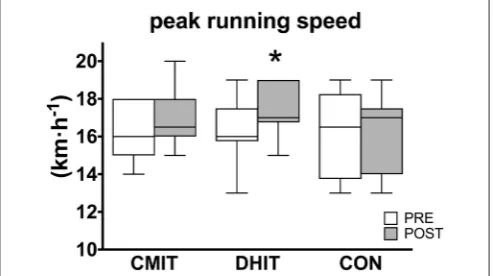
vpeakwas significantly higher in POST only in DHIT (16.4±
1.8 vs. 17.4±1.3 km·h−1, CI 95% 0.3 to 1.7, ES 0.62moderate, at
PRE and POST, respectively;P=0.015) whereas no differences were found for CMIT (16.4 ± 1.5 vs. 16.9 ± 1.4 km·h−1, CI
95%−0.2 to 1.2, ES 0.31small, at PRE and POST, respectively)
and CON (16.3± 1.9 vs. 16.5±1.6 km·h−1, CI 95% −0.5 to
0.9, ES 0.12 trivial, at PRE and POST, respectively;Figure 1). As for GET expressed as percentage ofVO˙ 2peak, no significant
differences were found at POST compared to PRE in CMIT (88.6
± 3.2 vs. 87.6 ± 6.1%, CI 95% −3.9 to 5.7, ES 0.17 trivial),
in DHIT (88.8 ±4.6 vs. 86.8±4.9%, CI 95%−3.6 to 6.0, ES
0.31small) and CON (88.8±3.8 vs. 87.6±6.3%, CI 95%−2.5
to 7.1, ES 0.22small). However, the speed at GET significantly improved in CMIT (14.6±1.4 vs. 15.1±1.1 km·h−1, CI 95%
0.2 to 1.4, ES 0.39small, P=0.023, PRE and POST, respectively)
and DHIT (14.1 ± 1.2 vs. 14.9 ±1.1 km·h−1, CI 95% 0.3 to
1.4, ES 0.51 small, P = 0.025, PRE and POST, respectively) whereas no differences were found in CON (14.0±1.6 vs. 14.2
± 1.3 km·h−1, CI 95%−0.5 to 0.7, ES 0.15 trivial, PRE and
POST, respectively;Figure 2). No differences were found among groups.
Constant Load Exercise
The absolute intensity of CLE did not change for the three groups after training (∼10 km·h−1). MeanVE,˙ VO˙
2, RER and,
HR values obtained during steady state exercise and 1[La− ]b
(highest value into recovery—resting value) are presented in
Table 2. All variables were significantly (P<0.05) lower POST compared to PRE both in CMIT and DHIT, whereas no changes were observed in CON. Energy cost of running is shown in
Figure 3. After training, CMIT and DHIT significantly decreased Cr by 4.4 and 4.9%, respectively. No change was found for CON.
Running Performance
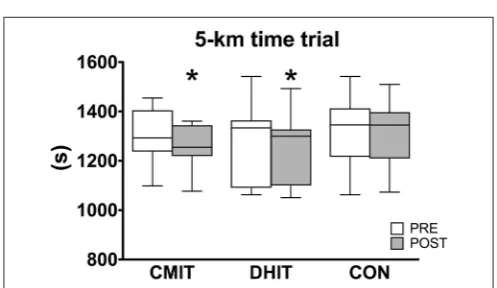
5-km time trial results are shown in Figure 4. At PRE, no significant difference among groups was observed. At POST (vs. TA
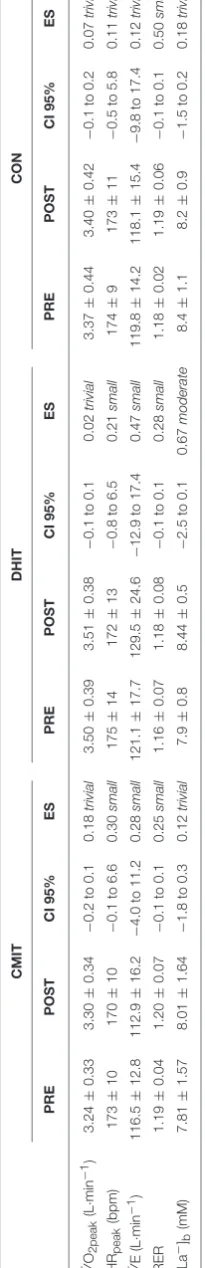
B L E 1 | V a lu e s o f th e m a in c a rd io va sc u la r, re sp ira to ry , a n d m e ta b o lic p a ra m e te rs o b ta in e d d u rin g th e in c re m e n ta lt e st . C M IT D H IT C O N P R E P O S T C I 9 5 % E S P R E P O S T C I 9 5 % E S P R E P O S T C I 9 5 % E S
˙ VO
2 p e a k (L · m in − 1) 3 .2 4 ± 0 .3 3 3 .3 0 ± 0 .3 4 − 0 .2 to 0 .1 0 .1 8 tr iv ia l 3 .5 0 ± 0 .3 9 3 .5 1 ± 0 .3 8 − 0 .1 to 0 .1 0 .0 2 tr iv ia l 3 .3 7 ± 0 .4 4 3 .4 0 ± 0 .4 2 − 0 .1 to 0 .2 0 .0 7 tr iv ia l H Rp e a k (b p m ) 1 7 3 ± 1 0 1 7 0 ± 1 0 − 0 .1 to 6 .6 0 .3 0 s m a ll 1 7 5 ± 1 4 1 7 2 ± 1 3 − 0 .8 to 6 .5 0 .2 1 s m a ll 1 7 4 ± 9 1 7 3 ± 1 1 − 0 .5 to 5 .8 0 .1 1 tr iv ia l
˙ VE
(L · m in − 1) 1 1 6 .5 ± 1 2 .8 1 1 2 .9 ± 1 6 .2 − 4 .0 to 1 1 .2 0 .2 8 s m a ll 1 2 1 .1 ± 1 7 .7 1 2 9 .5 ± 2 4 .6 − 1 2 .9 to 1 7 .4 0 .4 7 s m a ll 1 1 9 .8 ± 1 4 .2 1 1 8 .1 ± 1 5 .4 − 9 .8 to 1 7 .4 0 .1 2 tr iv ia l R E R 1 .1 9 ± 0 .0 4 1 .2 0 ± 0 .0 7 − 0 .1 to 0 .1 0 .2 5 s m a ll 1 .1 6 ± 0 .0 7 1 .1 8 ± 0 .0 8 − 0 .1 to 0 .1 0 .2 8 s m a ll 1 .1 8 ± 0 .0 2 1 .1 9 ± 0 .0 6 − 0 .1 to 0 .1 0 .5 0 s m a ll [L a −] b (m M ) 7 .8 1 ± 1 .5 7 8 .0 1 ± 1 .6 4 − 1 .8 to 0 .3 0 .1 2 tr iv ia l 7 .9 ± 0 .8 8 .4 4 ± 0 .5 − 2 .5 to 0 .1 0 .6 7 m o d e ra te 8 .4 ± 1 .1 8 .2 ± 0 .9 − 1 .5 to 0 .2 0 .1 8 tr iv ia l V a lu e s a re m e a n s ± S D . C I, c o n fide n c e in te rv a l; ES , e ff e c t s iz e ;
˙ VO
2 p e a k , pe a k ox yge n u pta ke ; H Rp e a k , pe a k h e a rt ra te ;
˙ VE,
FIGURE 1 |Peak running speed obtained during incremental test before (PRE, white boxes) and after (POST, gray boxes) training intervention. CMIT, continuous moderate intensity training; DHIT, discontinuous high-intensity
training; CON, control group. *Significantly different from PRE,P<0.05. The
box extends from the 25th percentile to the 75th percentile, with a bold line at the median value.
FIGURE 2 |Running speed at gas exchange threshold (GET) before (PRE,
white boxes) and after (POST, gray boxes) training intervention. CMIT, continuous moderate intensity training; DHIT, discontinuous high-intensity
training; CON, control group. *Significantly different from PRE,P<0.05. The
box extends from the 25th percentile to the 75th percentile, with a bold line at the median value.
PRE), the time to cover 5 km was statistically lower both in CMIT (1264 ± 85 vs. 1304 ± 109 s, P = 0.003) and DHIT
(1254 ± 140 vs. 1282 ± 155 s, P = 0.016). Performance did
not change in CON (1309± 142 vs. 1320±149 s). Results of the Pearson product moment-correlation analysis showed that all variables measured were significantly correlated with 5-km time trial (Table 3). The stepwise multiple regression analysis performed in PRE on all runners (n=30) revealed that vpeak
(km·h−1), GET (mL·kg−1·min−1), and Cr (J·kg−1·m−1) were the
variables to be selected for prediction of the 5-km time trial. The analysis showed that 72.4% of the variance in 5-km time trial could be explained by vpeak alone (P < 0.0001), and the
addiction of GET and Cr to the prediction equation increased this significantly to 79.0% (vpeak and GET; P < 0.0001) and
85.5% (vpeak, GET and Cr; P < 0.0001). Table 4 summarizes
the linear multiple regression equations obtained. No differences
were found among groups. TA
B L E 2 | V a lu e s o f th e m a in c a rd io va sc u la r, re sp ira to ry , a n d m e ta b o lic p a ra m e te rs o b ta in e d d u rin g th e c o n st a n t lo a d e xe rc is e . C M IT D H IT C O N P R E P O S T C I 9 5 % E S P R E P O S T C I 9 5 % E S P R E P O S T C I 9 5 % E S
˙ VO
2 ss (m L · K g −
1·m
in − 1) 3 3 .9 ± 2 .8 3 2 .6 ± 2 .2 * 1 .7 to 5 .3 0 .4 6 s m a ll 3 3 .1 ± 3 .3 3 1 .7 ± 3 .1 * 0 .8 to 6 .1 0 .4 2 s m a ll 3 3 .3 ± 2 .3 3 3 .0 ± 2 .1 − 1 .4 to 3 .1 0 .1 3 tr iv ia l H R (b p m ) 1 3 7 ± 1 2 1 3 2 ± 1 3 * 1 .1 to 1 0 .4 0 .4 1 s m a ll 1 2 9 ± 1 1 1 2 5 ± 1 0 * 0 .2 to 6 .9 0 .3 6 s m a ll 1 3 6 ± 1 3 1 3 4 ± 1 4 − 2 .2 to 4 .6 0 .1 5 tr iv ia l
˙ VE
(L · m in − 1) 6 1 .2 ± 9 .4 5 7 .1 ± 1 0 .2 * 3 .8 to 1 3 .6 0 .4 3 s m a ll 6 0 .1 ± 8 .2 5 7 .7 ± 6 .3 * 0 .3 to 1 3 .1 0 .2 9 s m a ll 5 9 .7 ± 8 .3 5 8 .1 ± 9 .0 − 0 .3 to 3 .4 0 .1 9 tr iv ia l R E R 0 .9 2 ± 0 .0 5 0 .8 9 ± 0 .0 4 * 0 .0 to 0 .1 0 .6 m o d e ra te 0 .9 4 ± 0 .0 2 0 .9 1 ± 0 .0 3 * 0 .0 to 0 .2 1 .5 0 la rg e 0 .9 2 ± 0 .0 2 0 .9 1 ± 0 .0 4 − 0 .1 to 0 .1 0 .5 0 s m a ll 1 [L a −] b (m M ) 0 .7 ± 0 .4 0 .4 ± 0 .3 * 0 .1 to 0 .5 0 .7 5 m o d e ra te 0 .7 ± 0 .4 0 .3 ± 0 .3 * 0 .0 to 0 .6 1 ,0 0 m o d e ra te 0 .7 ± 0 .5 0 .5 ± 0 .5 − 0 .1 to 0 .3 0 .4 0 s m a ll V a lu e s a re m e a n s ± S D . C I, c o n fide n c e in te rv a l; ES , e ff e c t s iz e ;
˙ VO
2 s s , ox yge n c on s u m pti on a t s te a dy s ta te ; H R , h e a rt ra te ;
˙ VE,
FIGURE 3 |Energy cost of running (Cr) calculated during constant load exercise before (PRE, white boxes) and after (POST, gray boxes) training intervention. CMIT, continuous moderate intensity training; DHIT, discontinuous high-intensity training; CON, control group. *Significantly
different from PRE,P<0.05. The box extends from the 25th percentile to the
75th percentile, with a bold line at the median value.
FIGURE 4 |Five kilometers time trial performance on a 400-m outdoor track
before (PRE, white boxes) and after (POST, gray boxes) training intervention. CMIT, continuous moderate intensity training; DHIT, discontinuous
high-intensity training; CON, control group. *Significantly different from PRE,P
<0.05. The box extends from the 25th percentile to the 75th percentile, with a
bold line at the median value.
DISCUSSION
The main finding of this study was that both moderate-intensity continuous training and high-moderate-intensity discontinuous training improve running performance in middle-aged master runners.
Form a physiological point of view, it is widely accepted that running performance depends on maximal oxygen uptake (VO˙ 2max), the ability to sustain a high percentage ofVO˙ 2max
for an extended period of time (f ˙VO2), and the energy cost
of running (Cr): v = f ˙VO2max · Cr−1 (di Prampero, 1986;
Capelli, 1999). After training, VO˙ 2peak was unchanged in the
master runners participating to the present study. At the same time, in the master runners participating to the present study we have observed a significant decrease of Cr following both CMIT and DHIT (4.4 and 4.9%, respectively). The magnitude of this improvement was close to the change in energy cost
of running reported in young trained distance runners after a period of interval training (Franch et al., 1998; Billat et al., 1999; Helgerud et al., 2007). We are unaware of similar studies performed in middle-aged master endurance athletes. Of interest is the observation that the positive effect on Cr was achieved despite a significant reduction of the previous self-managed training volume. Our results are in line with the theoretical model of the performance determinants: v = f ˙VO2max·Cr−1
(di Prampero, 1986; Capelli, 1999). After training VO˙ 2peak,
GET and calculated f ˙VO2max (91 and 90% at PRE and
POST, respectively) were unchanged. However, the analysis of 5-km finish time with the theoretical model of performance by considering the Cr value in POST lead to a reduction of 3.1% in CMIT, the same as with Capelli’s model 1999 and of 2.2% in DHIT, that was lower than the model prediction of 4.9%. Thus, other factors (i.e., biomechanical, neurophysiological, psychological etc.) counterbalanced the reduction of Cr and negatively influenced running performance of DHIT runners.
The energy cost of running, as is well known, is influenced by several metabolic, neuromuscular, and/or biomechanical factors (Saunders et al., 2004; Lacour and Bourdin, 2015). It has been suggested that training interventions able to reduce VE, HR,˙ and1[La−
]bduring exercise may be beneficial to Cr (Saunders et al., 2004). In our study, we observed after training, a significant reduction of VE and HR at the same running speed both˙ in CMIT and DHIT. However, it is hard to think that these changes were responsible for the overall VO˙ 2 reduction and
consequently for the Cr decrease. Taking into account the ratio of 1.5–2.0 mL·min−1VO˙
2per L·min−1of hyperpnea calculated
byAaron et al. (1992), a 2–4 L·min−1 difference inVE should˙
correspond to a reduction of about 3–8 mL O2·min−1 (0.04–
0.11 mL O2·min−1when expressed per kilogram body weight).
Likewise, assuming a myocardialVO˙ 2of 0.4 mL O2per 100 g of
left ventricular mass and per beat (Sheffield, 1988), the reduction of 4–5 b·min−1observed after training should induce a negligible
effect on the overall energy balance. Finally, in both PRE and POST the1[La−]bmeasured indicates that the metabolic energy
produced via anaerobic glycolysis was negligible, as expected for an exercise of moderate intensity, and we can assume that lactate did not contribute significantly to total energy expenditure. Thus, the metabolic factors cannot completely explain the improved energy cost of running.
Beside physiological aspects, neuromuscular, and biomechanical factors may also be important determinants of Cr (Lacour and Bourdin, 2015). Previous studies have reported an improvement of neuromuscular characteristics following plyometric (Spurrs et al., 2003) and strength (Paavolainen et al., 1999) training in young runners. Similar results were observed also in master runners following concurrent strength and endurance training (Piacentini et al., 2013). Moreover, high-intensity training may lead to a high engagement of the neuromuscular system (Buchheit and Laursen, 2013) and improve muscular function, especially in older athletes that experience a decrease in muscle mass and neural function with aging. In our study, we did not directly evaluate neuromuscular function but the improvement in vpeak (with no change in
˙
TABLE 3 |Relationships between˙VO2peak, Vpeak, GET, Speed at GET, Cr, and 5-km time trial (n=30).
Variables VO˙ 2peak(mL·kg−1·min−1) vpeak(km·h−1) GET (mL·kg-1·min-1) Speed at GET (km·h−1) Cr (J·kg−1·min−1)
5-km time trial (s) −0.733** −0.856** −0.695** −0.831** 0.428*
˙VO2peak, peak oxygen uptake; vpeak, maximal speed at the end of incremental test; GET, gas exchange threshold; Cr, energetic cost.**P<0.01,*P<0.05.
TABLE 4 |Linear multiple regression equations (n=30).
5-km time trial (s)=2353.979–64.350 vpeak
5-km time trial (s)=2690.008–51.091 vpeak-13.166 GET
5-km time trial (s)=2181.979–26.394 vpeak-23.977 GET+146.629 Cr
vpeak, maximal speed at the end of incremental test; GET, gas exchange threshold; Cr,
energetic cost.
in part, to improvements in muscular function (Esfarjani and Laursen, 2007). Thus, the reduction of the energy cost of running observed may be due to an improved neuromuscular function, at least in the subjects enrolled in the DHIT group.
From a biomechanical point of view, several parameters can be optimized (e.g., stride frequency, spring mass model related stiffness) or minimized (e.g., mechanical work) in order to improve Cr (Dalleau et al., 1998; Lieberman et al., 2015; Zamparo et al., 2016). However, published data on masters athletes or aged runners seem to show an already optimized system.Cavagna et al. (2008)reported that the freely chosen stride frequency is higher in old runners compared with young, but it is closer to the natural frequency of the system, and with a lower total mechanical work.
Pantoja et al. (2016)showed that both vertical and leg stiffness are similar in young and master runners even if Cr is higher in master. Biomechanical analysis was beyond the aims of this study and we did not measure any of the aforementioned parameters, thus we cannot say if any change occurred after training and if they could have affected Cr.
Another finding of this study is that CMIT and DHIT group significantly improved speed at GET by 3.7 and 4.8% for CMIT and DHIT, respectively. It is known that a rightward shift of the GET to a higher running speed is a clear sign of successful endurance training programs. This adaptation allows a higher absolute exercise intensity to be sustained without the accumulation of blood lactate that can be translated in a higher average running speed during competitions (Jones and Carter, 2000). Indeed, participants in both CMIT and DHIT group were able to run the 5-km time trial at higher speed after training (∼2.5% faster). Nevertheless, we did not find any change in GET when expressed as a percentage VO˙ 2peak. This may be
due to an already high pre-training GET value (overall mean
∼87% ofVO˙ 2peak) that is a common feature of endurance master
athletes (Kusy et al., 2012), which signified a limited potential for improvements with training.
Previous studies have consistently reported that both CMIT and DHIT induce large improvements in the VO˙ 2max of
untrained/moderately trained healthy adults aged 18–45 years (for a review seeMilanovi´c et al., 2015). In our master runners, however, we did not find any significant change in VO˙ 2peak
following the two training programs. When considering this
discrepancy, two factors should be taken into account: (1) participants were master runners with several years of training experience; (2) both CMIT and DHIT induced a significant reduction of the previous self-managed training volume that could negatively affected VO˙ 2peak. Thus, our data should be
observed with a different point of view: a significant reduction in training volume did not changeVO˙ 2peakafter both CMIT and
DHIT whereas the 5-km running performance improved after both training protocols. These findings are interesting because they indicate that when master athletes have reached a good maximal aerobic capacity, other factors could be important in order to obtain further improvements in running performance. This seems to be supported by the stepwise regression analysis performed before the training intervention. Our data showed that all variables (physiological and mechanical) measured were significantly correlated with 5-km performance (Table 3). However, the vpeakand speed at GET had the higher correlation
coefficient (r = −0.856 and r = −0.831, respectively). This result supports previous studies, in which vpeakand the fractional
utilization of the VO˙ 2peak (expressed as lactate or ventilatory
threshold) were highly correlated with performance in 5-km in young (Lacour et al., 1990) and middle-aged runners (Takeshima and Tanaka, 1995). Moreover, the stepwise regression analysis revealed that only vpeak, GET, and Cr predicted the 5-km
performance (adjustedr2=0.855). In the present study, DHIT
improved Cr, speed at GET and vpeak whereas CMIT only
influenced Cr and speed at GET. These findings are in accordance with other studies showing that vpeak, lactate or ventilatory
threshold and energy cost may be better predictors of endurance performance thanVO˙ 2peakin a homogeneous group of trained
endurance athletes (Conley and Krahenbuhl, 1980; Allen et al., 1985; Stratton et al., 2009).
From a practical point of view, it should be highlighted that a sizeable reduction of self-managed training volume replaced by a controlled training program significantly improved performance. Before the intervention the whole group of runners reported to undertake a combination of both high-intensity (∼4–10% of total) and high-volume (∼ 90% of total) training sessions for a training volume of about 50 km·wk−1. However, subjects
did not follow any individualized training program and training intensity, as well as training volume was based only on the participants’ experience. Previous studies have emphasized that the reduction in the exercise training stimulus with advancing age may have a critical role in the decline of peak performance (Tanaka et al., 1997). Our findings suggest that the quality of training should also be taken into account to improve running performance.
tendons, ligaments, cartilage, and muscle break down more easily and heal with greater difficulty (Maharam et al., 1999). Although it was not the aim of this study, we observed a low incidence (one runner in DHIT and one runner in CMIT) of muscular or orthopedic injuries after training intervention. These results indicate that a controlled DHIT program can be safely carried out not only in young athletes (Gibala et al., 2006) but also in master runners as outlined by the observation that, in the same cohort of athletes, DHIT does not cause higher level of exercise-induced oxidative stress than CMIT (Vezzoli et al., 2014).
In conclusion, this study indicates that both well-controlled CMIT and DHIT training program may significantly reduce the amount of weekly training volume (with a consistent reduction of time) and significantly improve running performance in middle-aged master runners, mainly lowering the energy cost of running. vpeak, fractional utilization of VO˙ 2peak,
and energy cost appear to be the best predictors of 5-km performance in middle-aged master runners suggesting that
training sessions should focus on the improvement of these parameters.
AUTHOR CONTRIBUTIONS
LP, SP, AL, FS, and MM: participated in the study design; LP, SP, and MM: conducted the experiments; MM: was responsible for medical expertise and screening of the athletes; LP, SP, AV, and GP: performed the data analysis; LP, SP, AV, AL, FS, GP, and MM: wrote or contributed to the writing of the manuscript.
ACKNOWLEDGMENTS
Authors would like to thank “Club GEAS Atletica” for expert technical assistance. The authors are grateful to all the participating athletes for the spontaneous and unlimited collaboration. This study was partially supported by “Federazione Medico Sportiva Italiana, FMSI.”
REFERENCES
Aaron, E. A., Johnson, B. D., Seow, K. C., and Dempsey, J. A. (1992). Oxygen
cost of exercise hyperpnea: measurements.J. Appl. Physiol.72, 1810–1817.
doi: 10.1152/jappl.1992.72.5.1810
Allen, W. K., Seals, D. R., Hurley, B. F., Ehsani, A. A., and Hagberg, J. M. (1985). Lactate threshold and distance-running performance in
young and older endurance athletes. J. Appl. Physiol. 58, 1281–1284.
doi: 10.1152/jappl.1985.58.4.1281
Batterham, A. M., and Hopkins, W. G. (2006). Making meaningful
inferences about magnitudes. Int. J. Sports Physiol. Perform. 1, 50–57.
doi: 10.1123/ijspp.1.1.50
Beaver, W. L., Wasserman, K., and Whipp, B. J. (1986). A new method for
detecting anaerobic threshold by gas exchange.J. Appl. Physiol.60, 2020–2027.
doi: 10.1152/jappl.1986.60.6.2020
Billat, V. L., Flechet, B., Petit, B., Muriaux, G., and Koralsztein, J. P. (1999). Interval training at VO2max: effects on aerobic performance and overtraining markers.
Med. Sci. Sports Exerc.31, 156–163. doi: 10.1097/00005768-199901000-00024 Brisswalter, J., and Nosaka, K. (2013). Neuromuscular factors associated with
decline in long-distance running performance in master athletes.Sports Med.
43, 51–63. doi: 10.1007/s40279-012-0006-9
Buchheit, M., and Laursen, P. B. (2013). High-intensity interval training,
solutions to the programming puzzle. Part II: anaerobic energy,
neuromuscular load and practical applications. Sports Med. 43, 927–954.
doi: 10.1007/s40279-013-0066-5
Capelli, C. (1999). Physiological determinants of best performances in
human locomotion. Eur. J. Appl. Physiol. Occup. Physiol. 80, 298–307.
doi: 10.1007/s004210050596
Cavagna, G. A., Legramandi, M. A., and Peyré-Tartaruga, L. A. (2008). Old men
running: mechanical work and elastic bounce.Proc. R. Soc. B275, 411–418.
doi: 10.1098/rspb.2007.1288
Conley, D. L., and Krahenbuhl, G. S. (1980). Running economy and distance
running performance of highly trained athletes.Med. Sci. Sports Exerc.12,
357–360. doi: 10.1249/00005768-198025000-00010
Dalleau, G., Belli, A., Bourdin, M., and Lacour, J. R. (1998). The spring-mass model
and the energy cost of treadmill running.Eur. J. Appl. Physiol.77, 257–263.
doi: 10.1007/s004210050330
di Prampero, P. E. (1986). The energy cost of human locomotion on land and in
water.Int. J. Sports Med.7, 55–72. doi: 10.1055/s-2008-1025736
Donato, A. J., Tench, K., Glueck, D. H., Seals, D. R., Eskurza, I., and Tanaka, H. (2003). Declines in physiological functional capacity with age:
a longitudinal study in peak swimming performance.J. Appl. Physiol.94,
764–769. doi: 10.1152/japplphysiol.00438.2002
Esfarjani, F., and Laursen, P. B. (2007). Manipulating high-intensity interval training: effects on VO2max, the lactate threshold and 3000 m running
performance in moderately trained males. J. Sci. Med. Sport 10, 27–35.
doi: 10.1016/j.jsams.2006.05.014
Franch, J., Madsen, K., Djurhuus, M. S., and Pedersen, P. K. (1998). Improved running economy following intensified training correlates with
reduced ventilatory demands. Med. Sci. Sports Exerc. 30, 1250–1256.
doi: 10.1097/00005768-199808000-00011
Gibala, M. J., Little, J. P., van Essen, M., Wilkin, G. P., Burgomaster, K. A., Safdar, A., et al. (2006). Short-term sprint interval versus traditional endurance training: similar initial adaptations in human skeletal muscle and exercise
performance.J. Physiol.575, 901–911. doi: 10.1113/jphysiol.2006.112094
Helgerud, J., Høydal, K., Wang, E., Karlsen, T., Berg, P., Bjerkaas, M., et al. (2007). Aerobic high-intensity intervals improve VO2max
more than moderate training. Med. Sci. Sports Exerc. 39, 665–671.
doi: 10.1249/mss.0b013e3180304570
Holloszy, J. O., and Coyle, E. F. (1984). Adaptations of skeletal muscle to endurance
exercise and their metabolic consequences.J. Appl. Physiol. Respir. Environ.
Exerc. Physiol.56, 831–838. doi: 10.1152/jappl.1984.56.4.831
Iaia, F. M., Hellsten, Y., Nielsen, J. J., Fernström, M., Sahlin, K., and Bangsbo, J. (2009). Four weeks of speed endurance training reduces energy expenditure during exercise and maintains muscle oxidative capacity
despite a reduction in training volume. J. Appl. Physiol. 106, 73–80.
doi: 10.1152/japplphysiol.90676.2008
Jones, A. M., and Carter, H. (2000). The effect of endurance training
on parameters of aerobic fitness. Sports Med. 29, 373–386.
doi: 10.2165/00007256-200029060-00001
Jones, A. M., and Doust, J. H. (1996). A 1% treadmill grade most accurately
reflects the energetic cost of outdoor running.J. Sports Sci.14, 321–327.
doi: 10.1080/02640419608727717
Kubukeli, Z. N., Noakes, T. D., and Dennis, S. C. (2002). Training techniques
to improve endurance exercise performances. Sports Med. 32, 489–509.
doi: 10.2165/00007256-200232080-00002
Kusy, K., Krol-Zielinska, M., Domaszewska, K., Krysciak, J., Podgorski, T., and Zielinski, J. (2012). Gas exchange threshold in male speed-power versus
endurance athletes ages 20–90 years.Med. Sci. Sports Exerc.44, 2415–2422.
doi: 10.1249/MSS.0b013e318267c36f
Lacour, J. R., and Bourdin, M. (2015). Factors affecting the energy cost of
level running at submaximal speed. Eur. J. Appl. Physiol. 115, 651–673.
doi: 10.1007/s00421-015-3115-y
Lacour, J. R., Padilla-Magunacelaya, S., Barthélémy, J. C., and Dormois, D. (1990).
The energetics of middle-distance running.Eur. J. Appl. Physiol. Occup. Physiol.
Laursen, P. B. (2010). Training for intense exercise performance:
high-intensity or high-volume training? Scand. J. Med. Sci. Sports 20, 1–10.
doi: 10.1111/j.1600-0838.2010.01184.x
Laursen, P. B., and Jenkins, D. G. (2002). The scientific basis for high-intensity interval training: optimising training programmes and maximising
performance in highly trained endurance athletes. Sports Med. 32, 53–73.
doi: 10.2165/00007256-200232010-00003
Lieberman, D. E., Warrener, A. G., Wang, J., and Castillo, E. R. (2015). Effects of stride frequency and foot position at landing on braking force, hip torque,
impact peak force and the metabolic cost of running in humans.J. Exp. Biol.
218, 3406–3414. doi: 10.1242/jeb.125500
Maharam, L. G., Bauman, P. A., Kalman, D., Skolnik, H., and Perle, S. M.
(1999). Master athletes: factor affecting performance.Sports Med.28, 273–285.
doi: 10.2165/00007256-199928040-00005
Margaria, R., Cerretelli, P., Aghemo, P., and Sassi, G. (1963). Energy cost of
running.J. Appl. Physiol.18, 367–370. doi: 10.1152/jappl.1963.18.2.367
Milanovi´c, Z., Sporiš, G., and Weston, M. (2015). Effectiveness of high-intensity interval training (HIT) and continuous endurance training for VO2max
improvements: a systematic review and meta-analysis of controlled trials.Sports
Med.45, 1469–1481. doi: 10.1007/s40279-015-0365-0
Paavolainen, L., Häkkinen, K., Hämälainen, I., Nummela, A., and Rusko, H. (1999). Explosive-strength training improves 5-km running time by improving
running economy and muscle power. J. Appl. Physiol. 86, 1527–1533.
doi: 10.1152/jappl.1999.86.5.1527
Pantoja, P. D., Morin, J. B., Peyré-Tartaruga, L. A., and Brisswalter, J. (2016). Running energy cost and spring-mass behavior in young
versus older trained athletes. Med. Sci. Sports Exerc. 9, 1779–1786.
doi: 10.1249/MSS.0000000000000959
Piacentini, M. F., De Ioannon, G., Comotto, S., Spedicato, A., Vernillo, G., and La Torre, A. (2013). Concurrent strength and endurance training effects on
running economy in master endurance runners.J. Strength Cond. Res. 27,
2295–2303. doi: 10.1519/JSC.0b013e3182794485
Reaburn, P., and Dascombe, B. (2008). Endurance performance in masters
athletes. Eur. Rev. Aging Phys. Act. 5, 31–42. doi: 10.1007/s11556-008-0
029-2
Saunders, P. U., Pyne, D. B., Telford, R. D., and Hawley, J. A. (2004). Factors
affecting running economy in trained distance runners. Sports Med. 34,
465–485. doi: 10.2165/00007256-200434070-00005
Seiler, K. S., and Kjerland, G. (2006). Quantifying training intensity distribution in
elite endurance athletes: is there evidence for an “optimal” distribution?Scand.
J. Med. Sci. Sports16, 49–56. doi: 10.1111/j.1600-0838.2004.00418.x
Sheffield, L. T. (1988). “Exercise stress testing,” inHeart Disease: A Text Book of
Cardiovascular Medicine,ed E. Braunwald (Philadelphia, PA: W. B. Saunders), 224.
Spurrs, R. W., Murphy, A. J., and Watsford, A. J. (2003). The effect of plyometric
training on distance running performance.Eur. J. Appl. Physiol. 89, 1–7.
doi: 10.1007/s00421-002-0741-y
Stratton, E., O’Brien, B. J., Harvey, J., Blitvich, J., McNicol, A. J., Janissen, D., et al.
(2009). Treadmill velocity best predicts 5000-m run performance.Int. J. Sports
Med.30, 40–45. doi: 10.1055/s-2008-1038761
Takeshima, N., and Tanaka, K. (1995). Prediction of endurance running
performance for middle-aged and older runners.Br. J. Sports Med.29, 20–23.
doi: 10.1136/bjsm.29.1.20
Tanaka, H., Desouza, C. A., Jones, P. P., Stevenson, E. T., Davy, K. P., and Seals, D. R. (1997). Greater rate of decline in maximal aerobic capacity with age in
physically active vs. sedentary healthy women.J. Appl. Physiol.83, 1947–1953.
doi: 10.1152/jappl.1997.83.6.1947
Tanaka, H., and Seals, D. R. (2008). Endurance exercise performance in masters
athletes: age-associated changes and underlying physiological mechanisms.J.
Physiol.586, 55–63. doi: 10.1113/jphysiol.2007.141879
Trappe, S., Hayes, E., Galpin, A., Kaminsky, L., Jemiolo, B., Fink, W., et al. (2013). New records in aerobic power among octogenarian lifelong endurance athletes.
J. Appl. Physiol.114, 3–10. doi: 10.1152/japplphysiol.01107.2012
Vezzoli, A., Pugliese, L., Marzorati, M., Serpiello, F. R., La Torre, A., and Porcelli, S. (2014). Time-course changes of oxidative stress response to high-intensity discontinuous training versus moderate-high-intensity continuous training
in masters runners.PLoS ONE9:e87506. doi: 10.1371/journal.pone.0087506
Zamparo, P., Pavei, G., Nardello, F., Bartolini, D., Monte, A., and Minetti, A. E.
(2016). Mechanical work and efficiency of 5+5 m shuttle running.Eur. J. Appl.
Physiol.116, 1911–1919. doi: 10.1007/s00421-016-3443-6
Conflict of Interest Statement: The authors declare that the research was conducted in the absence of any commercial or financial relationships that could be construed as a potential conflict of interest.