https://doi.org/10.5194/nhess-19-1215-2019 © Author(s) 2019. This work is distributed under the Creative Commons Attribution 4.0 License.
The impact of drought on the productivity of two
rainfed crops in Spain
Marina Peña-Gallardo1,*, Sergio Martín Vicente-Serrano1, Fernando Domínguez-Castro1, and Santiago Beguería2 1Instituto Pirenaico de Ecología, Consejo Superior de Investigaciones Científicas (IPE-CSIC), Zaragoza, Spain
2Estación Experimental de Aula Dei, Consejo Superior de Investigaciones Científicas (EEAD-CSIC), Zaragoza, Spain *Invited contribution by Marina Peña-Gallardo, recipient of the EGU Natural Hazards Outstanding
Student Poster and PICO Award 2018.
Correspondence:Marina Peña-Gallardo ([email protected]) Received: 1 January 2019 – Discussion started: 9 January 2019
Accepted: 9 May 2019 – Published: 19 June 2019
Abstract. Drought events are of great importance in most Mediterranean climate regions because of the diverse and costly impacts they have in various economic sectors and on the environment. The effects of this natural hazard on rainfed crops are particularly evident. In this study the im-pacts of drought on two representative rainfed crops in Spain (wheat and barley) were assessed. As the agriculture sector is vulnerable to climate, it is especially important to iden-tify the most appropriate tools for monitoring the impact of the weather on crops, and particularly the impact of drought. Drought indices are the most effective tool for that purpose. Various drought indices have been used to assess the influ-ence of drought on crop yields in Spain, including the Stan-dardized Precipitation Evapotranspiration Index (SPEI), the Standardized Precipitation Index (SPI), the Palmer drought indices (Palmer Drought Severity Index, PDSI; PalmerZ In-dex, Z Index; Palmer Hydrological Drought Index, PHDI; Palmer Modified Drought Index, PMDI), and the Standard-ized Palmer Drought Index (SPDI). Two sets of crop yield data at different spatial scales and temporal periods were used in the analysis. The results showed that drought indices calculated at different timescales (SPI, SPEI) most closely correlated with crop yield. The results also suggested that different patterns of yield response to drought occurred de-pending on the region, period of the year, and the drought timescale. The differing responses across the country were related to season and the magnitude of various climate vari-ables.
1 Introduction
The Mediterranean region is one of the major areas in Eu-rope likely to be subject to the potential impacts of climate change. Many semiarid regions of southwestern Europe are expected to undergo a critical decline in water availability as a consequence of reduced precipitation and an increase in in-terannual and intra-annual rainfall variability (IPCC, 2014, EEA, 2017). It is also expected that future changes in the precipitation regime, along with a rise in temperature, will inevitably bring more extreme and severe weather events (Giorgi and Lionello, 2008; Webber et al., 2018; Wigley, 2009) that will impact ecosystems and economic sectors (As-seng et al., 2014; Tack et al., 2015). It has been suggested that precipitation and temperature changes in the western Mediterranean region will lead to more severe and longer drought events in coming decades (Alcamo et al., 2007; Dai, 2011; Forzieri et al., 2016; Giorgi and Lionello, 2008; Spinoni et al., 2018; Vicente-Serrano et al., 2014). This is significant because agriculture plays a key role in food sup-ply; in 2017 it accounted for 2.59 % of GDP in Spain, 1.92 % in Italy, and 3.53 % in Greece (World Bank, 2017).
and forestry losses from drought in France, Italy, Germany, Spain, Portugal, and Austria were approximately EUR 13 bil-lion (Fink et al., 2004; García-Herrera et al., 2010). The most recent drought, which mostly affected north–central Europe, caused European farmers to claim agricultural aid because of the low production that resulted (European Commission, 2018).
For these reasons the vulnerability of agricultural produc-tion to extreme events and the quantificaproduc-tion of drought im-pacts on crop yields have become a focus of interest. In re-cent years diverse studies in the Mediterranean region have assessed these issues from multiple perspectives. For exam-ple, Capa-Morocho et al. (2016) investigated the link be-tween seasonal climate forecasts and crop models in Spain, Loukas and Vasiliades (2004) used a probabilistic approach to evaluate the spatiotemporal characteristics of drought in an agricultural plain region in Greece, and Moore and Lo-bell (2014) estimated the impacts of climate projections on various crop types across Europe.
Droughts are difficult to measure and quantify (Vicente-Serrano et al., 2016), and consequently a wide range of drought indices have been developed to provide tools for quantifying the effects of drought across different sectors (Zargar et al., 2011). In this respect, drought indices are the most widely used method for monitoring drought impacts on agriculture; examples of their use available in the scientific literature include that in Europe (Hernandez-Barrera et al., 2016; Potopová et al., 2016a; Sepulcre-Canto et al., 2012; Vergni and Todisco, 2011), America (McEvoy et al., 2012; Quiring and Papakryiakou, 2003), and Asia (Ebrahimpour et al., 2015; Wang et al., 2016a). However, there is no general consensus on the most suitable indices for this purpose (Es-fahanian et al., 2017). Despite the existing literature, very few studies (Peña-Gallardo et al., 2018a; Tian et al., 2018) have compared drought indices to identify their appropriate-ness for monitoring drought impacts on agriculture and for various crop types.
Among Mediterranean countries, agriculture in Spain is particularly sensitive to climate because of the low aver-age precipitation level and its marked interannual variabil-ity (Vicente-Serrano, 2006). Spain has been subject to mul-tiple episodes of drought (Domínguez-Castro et al., 2012), with those in the last century being amongst the most se-vere to have occurred in Europe (González-Hidalgo et al., 2018; Vicente-Serrano, 2006). In 2017 the agricultural and livestock losses caused by drought were estimated to be at least EUR 3600 million (UPA, 2017), highlighting the need to establish appropriate tools for monitoring drought impacts on crops. Recent studies such as that conducted by Ribeiro et al. (2019) in the Iberian Peninsula stressed the risk of this region of suffering from yield losses in the context of cli-mate change. For that purpose, these authors analyzed the exposure of cereal rainfed crops to drought conditions using remote sensing information and performing a multi-scalar drought index.
Information on crop production is commonly limited in terms of spatial or temporal availability. Recent studies in Spain have analyzed the impact of climate on various crops since the early 21st century at national or provincial scales (Cantelaube et al., 2004; Hernandez-Barrera et al., 2016; Pás-coa et al., 2016; Ribeiro et al., 2019), but few have used yield data at finer resolution (García-León et al., 2019). In this study we compared different drought indices using two datasets at different spatial scales: provincial information provided by the national statistical services and a regional dataset specifically developed for the study. The objectives of this study were (1) to determine the most appropriate and functional drought index among four Palmer-related drought indices (Palmer Drought Severity Index, PDSI; Palmer Hy-drological Drought Index, PHDI; Palmer Z Index, Z In-dex; Palmer Modified Drought Index, PMDI) and the Stan-dardized Precipitation Evapotranspiration Index (SPEI), the Standardized Precipitation Index (SPI), and the Standardized Palmer Drought Index (SPDI); (2) to identify the temporal response of two main herbaceous rainfed crops (wheat and barley) to drought; and (3) to determine whether there were common spatial patterns, by comparing the two datasets at different spatial scales.
2 Methods and datasets 2.1 Crop yield data
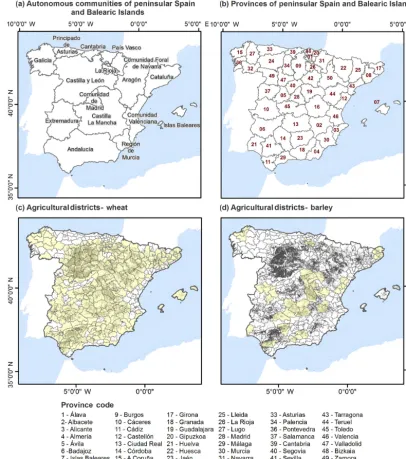
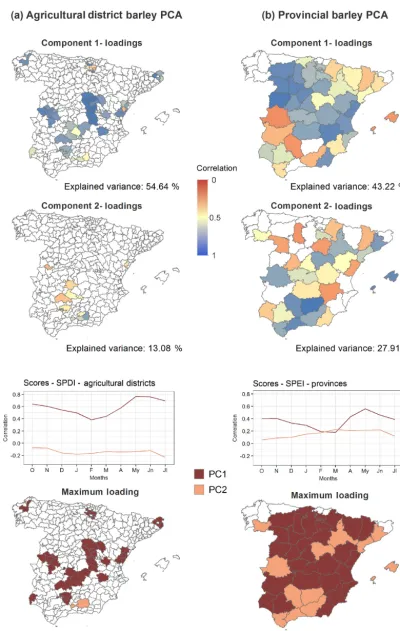
Figure 1.Location of Spanish autonomous communities(a)and provinces(b)and the distribution of agricultural districts with data available (yellow) for wheat(c)and barley(d)yields for the period 1993–2015. Areas where rainfed cereal crops are cultivated (Corine Land Cover 2006) are shown in grey.
in this study did not correspond to all the areas where this crop is cultivated.
For both datasets the unit of measure was the harvested production per unit of harvested area (kg ha−1); it did not in-clude any measure of production related to the area of the crop planted in each province or region. To consider the total area covered by the crops we used the defined rain-fed crop delimited area for Spain, derived from the Corine Land Cover 2000 database (http://centrodedescargas.cnig. es/CentroDescargas/catalogo.do?Serie=MPPIF, last access: March 2018).
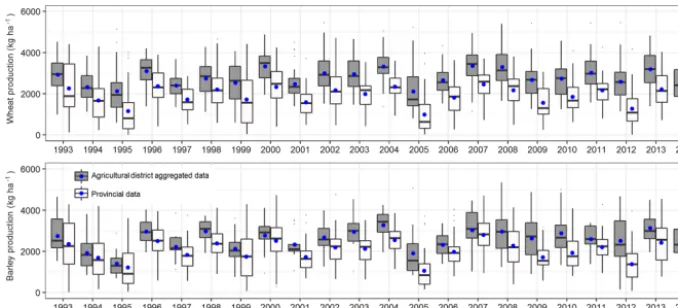
Figure 2.Temporal series of wheat(a)and barley(b)yields for the provincial data and the aggregated agricultural district data at the province scale for the common period 1993–2014. The solid black line shows the median, and the blue dot shows the mean.
yields in the analyzed provinces. Wheat yields showed good agreement and highly significant correlations between both datasets in provinces including Ávila (r=0.77), Barcelona (r=0.69), Burgos (r=0.82), Cuenca (r=0.86), Guadala-jara (r=0.87), León (r=0.69), Palencia (r=0.73), Sala-manca (r=0.87), Segovia (r=0.94), Teruel (r=0.83), Valladolid (r=0.92), and Zamora (r=0.75), while in other provinces including Castellón, Málaga, Murcia, and Navarra the correlations were nonsignificant or negative. Thus, the national statistics for these districts were unreliable. For bar-ley yields the available regional data were more limited, but similar relationships with good agreement and more highly significant correlations were found among the datasets for the provinces where wheat was also cultivated, including Cáceres (r=0.48), Cuenca (r=0.88), Granada (r=0.51), Guadalajara (r=0.86), La Rioja (r=0.76), and Tarragona (r=0.88); however, for Sevilla the correlation was negative and significant (r= −0.35).
Mechanization and innovation in agriculture have in-creased in the last century, resulting in a trend of inin-creased yields (Lobell and Field, 2007), which is also evident in data for Spain. To remove bias introduced by non-climate factors, and to enable comparison of yields between the two crop types, the original series were transformed to standardized yield residuals series (SYRS) using the following quadratic polynomial equation:
SYRS=yd−µ σ ,
where yd denotes the residuals of the de-trended yield ob-tained by fitting a linear regression model,µis the mean of the de-trended series, andσ is the standard deviation of the de-trended yield.
This methodology has been applied in other similar stud-ies (Chen et al., 2016; Tian et al., 2018). First announced as SYRS by Potopová et al. (2015), the full procedure of the fol-lowing methodology is described by Lobell and Asner (2003)
and Lobell et al. (2011). In Fig. S1 (Supplement) an example of the positive trend (more evident in the provincial data due to the length of available data) and the temporal evolution of SYRS is illustrated for both type of crops and spatial scale. 2.2 Climate data
We used a weekly gridded dataset of meteorological vari-ables (precipitation, maximum and minimum temperature, relative humidity, and sunshine duration) at 1.1 km resolution for peninsular Spain and the Balearic Islands for the period 1962–2015. The grids were generated from a daily meteo-rological dataset provided by the Spanish National Meteo-rological Agency (AEMET), following quality control and homogenization of the data. Further details on the method and the gridding procedure are provided by Vicente-Serrano et al. (2017). Reference evapotranspiration (ETo) was calcu-lated using the FAO-56 Penman–Monteith equation (Allen et al., 1998). Weekly data were aggregated at the monthly scale for calculation of the various drought indices.
2.3 Methods
2.3.1 Drought indices Palmer drought indices
deter-mining a suitable regional coefficient, developing the self-calibrated Palmer indices. Palmer indices are also referred to as uni-scalar indices, which can only be calculated at fixed and unknown timescales (Guttman, 1998; Vicente-Serrano et al., 2010); this is a limitation of these indices.
Standardized Precipitation Index (SPI)
The Standardized Precipitation Index (SPI) was introduced by Mckee et al. (1993) and provided a new approach to the quantification of drought at multiple timescales. The index is based on the conversion of precipitation series to a stan-dard normal variable, with a mean equal to 0 and variance equal to 1, by adjusting an incomplete gamma distribution. The SPI is a meteorological index used worldwide and is especially recommended by the World Meteorological Or-ganization (WMO, 2012) for drought monitoring and early warning.
Standardized Precipitation Evapotranspiration Index (SPEI)
Vicente-Serrano et al. (2010) proposed the Standardized Pre-cipitation Evapotranspiration Index (SPEI) as a drought in-dex that takes into consideration the effect of atmospheric evaporative demand on drought severity. It provides monthly climate balances (precipitation minus reference evapotran-spiration), and the values are transformed to normal standard-ized units using a three-parameter log-logistic distribution. Following the concept of the SPI, the SPEI enables compar-ison of drought characteristics at various timescales among regions, independently of their climatic conditions. The SPEI has been widely used in drought-related studies, including to investigate the impacts of drought on various crops world-wide (Chen et al., 2016; Kuhnert et al., 2016; Peña-Gallardo et al., 2018b; Potopová et al., 2016b; Vicente-Serrano et al., 2012).
Standardized Precipitation Drought Index (SPDI) The Standardized Precipitation Drought Index (SPDI) was developed by Ma et al. (2014) and relies on the concept of timescales. It is considered to be a combined version of the PDSI and the SPEI because the SPDI accumulates the in-ternal water balance anomalies (D) obtained in the PDSI scheme at various timescales, and the values are later trans-formed intozunits following a standard normal distribution. For this purpose a log-logistic distribution has been used be-cause this has been shown to be effective at the global scale (Vicente-Serrano et al., 2015).
The SPEI, SPI, and SPDI are referred to here as multi-scalar indices and the Palmar drought indices as uni-multi-scalar indices. Thus, the multi-scalar indices were computed at scales of 1, 12, 18, and 24 months and along with the Palmer drought indices series were de-trended by adjusting a linear regression model to enable accurate comparisons with
de-trended crop yield information. Following the same proce-dure used for the yield series, the residual of each monthly series was summed to the average value for the period. 2.3.2 Correlation between drought indices and crop
yields
The relationship between the drought indices and the SYRS for both datasets was assessed by calculating polynomial cor-relation coefficients (c) (Baten and Frame, 1959). We used a second-order polynomial regression model, given the com-mon nonlinear relationship between drought indices and crop production (Páscoa et al., 2016; Zipper et al., 2016). Here-after, the references made to correlations refer to results ob-tained using the polynomial approach. The months of August and September were excluded from the analysis because they correspond to the post-harvest period, and we were consider-ing only the period from sowconsider-ing to harvest.
As the month of the year when the greatest correlation be-tween the drought index and the crop yield was not known beforehand, all 10 monthly series for each index were corre-lated with the annual yield, and the highest correlation value was used. In the case of the multi-scalar indices, for each monthly series and timescale we obtained 10 correlations (one for each of the 10 months and the 14 timescales con-sidered in the analysis). Thus, 140 correlations were obtained for each crop and spatial unit considered in the analysis (only correlations significant atp <0.05 were considered). In ad-dition, we used the timescale (in the case of multi-scalar drought indices) and the month in which the strongest cor-relation was found.
At test was performed to assess the significance of the differences in the polynomial regression correlation coeffi-cients obtained from the drought–yield relationships, to de-termine whether there were significant similarities or differ-ences among the indices.
2.4 Identification of spatial patterns for crop yield response to drought
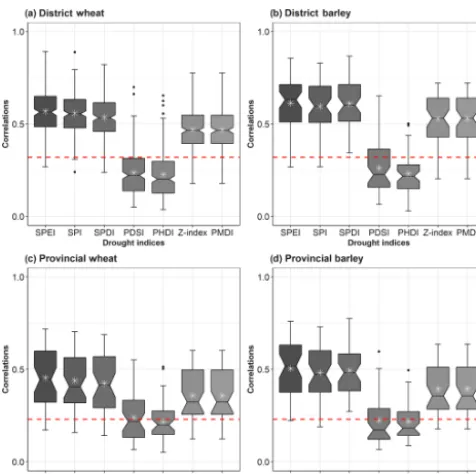
Figure 3.Box plots showing the strongest correlation coefficients found between drought indices and wheat and barley yields at the agricultural district (aand b) and provincial (candd) scales, for all districts and provinces analyzed. The solid black line shows the median, the white asterisk shows the mean, and the dashed red lines show thep <0.05 significance level.
according to the maximum loading rule (i.e., assigning each spatial unit to the PC for which the highest loading value was found). The loadings were expressed in the original correla-tion magnitudes using the matrix of component weights.
3 Results
3.1 Relationship of drought indices to crop yields Figure 3 shows the strongest correlation found between the crop yield for each dataset and the monthly drought in-dices. The correlations differed substantially between the two groups of indices. Independently of the crop type, month of the year, or the drought timescale considered, the correlation coefficients for the multi-scalar indices were much higher than those for the uni-scalar indices. In both cases weaker correlations were found for the wheat crops compared with the barley crops. The PDSI, PHDI, and PMDI correlations were nonsignificant (p <0.05), but the correlations for theZ Index and the multi-scalar indices were significant for most provinces and agricultural districts. The correlation values for the three multi-scalar drought indices were similar. At district scale the average values were c=0.57 andc=0.6 for wheat and barley, respectively, andc=0.41 andc=0.48 at the provincial scale. Thus, the datasets showed a stronger correlation for the drought indices at district scale than at the
provincial scale. In addition, more variability was found in the provincial data than in the regional data, associated with the length of the available records.
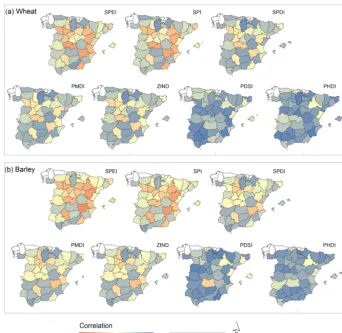
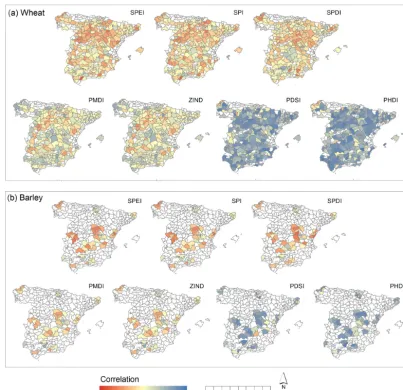
The spatial distribution of the maximum correlation coef-ficients between the drought indices and the crop yields is shown in Figs. 4 and 5, for the province and district scales, respectively. The wheat and barley yield–drought correla-tions showed a similar spatial pattern among indices at the province scale. Stronger correlations (c≥0.7) were found for the SPEI and SPI for the provinces of Castilla y León (Valladolid, Zamora, Segovia, and Soria), Aragón (Zaragoza and Teruel), Castilla La Mancha (Guadalajara, Albacete, and Toledo), and Valencia (particularly the cereal agricultural districts). The weakest correlations were found for the south-ern (Andalusian) provinces. For the Palmer drought indices, the PMDI andZIndex showed similar spatial patterns to the multi-scalar indices (especially in the central and northern provinces), but the correlations were weaker (c=0.25–0.6). For most provinces the weakest correlations were found for the PDSI and PHDI (c=0.1–0.25) for both crops, with no clear spatial difference in the correlations.
The spatial distribution of correlations between wheat yields and the drought indices at the agricultural district scale showed clearer patterns than those for the province level. Thus, the response of drought indices at district scale is sim-ilar to the response observed at provincial scale, showing stronger correlations for the multi-scalar indices and weaker correlations for the Palmer indices, especially the PDSI and PHDI. The distribution of correlations among the multi-scalar indices was very similar. The most correlated agricul-tural districts (c≥0.8) were in Castilla y León, especially Valladolid, Segovia, north of Ávila, and northeast of Sala-manca. Similar correlations were found for areas of north-east Spain. There was a gradient in correlations from north to south, with the exception of some districts in northwestern Málaga, where wheat is extensively cultivated. In addition, in some districts of Galicia, where expansion of the planted wheat area has not been large, there was a strong relation-ship between drought indices and crop yields. The results for barley suggest a similar spatial relationship for the var-ious drought indices. The highest coefficients were found for the multi-scalar indices, followed by the Z Index and the PMDI, with districts north of Cáceres, north of Galicia, and in Guadalajara showing correlations on the order ofc=0.8, while the correlations were weaker (c=0.25–0.4) in districts in the south of Córdoba and Jaén.
3.2 Relationship of drought indices to crop yields: temporal responses
Figure 4.Spatial distribution of the highest correlation coefficients between the drought indices and the wheat(a)and barley(b)yields at the provincial scale, independently of the timescale.
for 52.6 % of the agricultural districts the yield was most strongly correlated with all three drought indices at a timescale of 1–3 months; this was also the case for 49.6 % of provinces. In agricultural districts where wheat is cultivated the strongest correlations were predominantly at the 1-month scale (20.37 %), especially for the SPDI, while for most of the provinces this occurred at the 3-month scale, particularly for the SPEI and SPI (23.26 %). For barley, 57.4 % of the dis-tricts and 58.7 % of provinces where this crop was grown, the strongest correlations were predominantly at 1- to 3-month timescales. Among the various indices for districts, the SPI showed the strongest correlation at the 1-month scale, while for provinces the SPEI showed the strongest correlation at the 3-month scale (33.33 %).
The multi-scalar drought indices showed similar results. Among these, the SPEI was the index most strongly corre-lated with yield in the highest percentage of provinces and districts (Table 2). For wheat crops the SPEI was the most strongly correlated index with yield in ∼37 % of the agri-cultural districts and∼58 % of the provinces; these correla-tions were found predominantly at the 3-month timescale. For this crop the SPDI was most strongly correlated with
yield in a similar proportion of districts (∼33 %), primarily at the 1-month scale, but only∼14 % at the province scale. In general, most of the maximum correlations corresponded to short timescales.
Figure 5.Spatial distribution of the highest correlation coefficients between the drought indices and the wheat(a)and barley(b)yields at the agricultural district scale, independently of the timescale.
a weaker correlation of yield with drought indices. The re-sults suggest that, for districts with strong correlations be-tween drought indices and crop yields, the two indexes were equally useful. A lower proportion of districts where barley is planted showed that statistical differences among indices ex-ist. In contrast, for provinces no significant differences were found. Overall, this suggests the appropriateness of using any of these multi-scalar indices indistinctly.
3.3 Spatial patterns of drought index correlations at the monthly scale
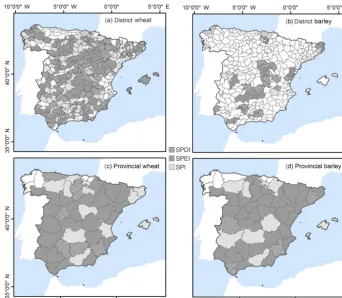
Regionalization of the crop yield response to drought based on monthly correlations with the drought indices was under-taken in relation to the most correlated drought index in each region, independently of the month in which this maximum correlation occurred. Thus, in this analysis the results ob-tained using the various multi-scalar drought indices were
merged. General spatial patterns in the effect of drought con-ditions on yield were identified using a T-mode PCA. Fig-ures 7 and 8 show the results for the provincial and regional datasets, respectively. We selected two components that ex-plained more than the 60 % of the variance in each case. This classification reinforced the north–south pattern of cor-relations previously found for both datasets. Figure 9 shows the timescales for which the maximum monthly correlations were found for the provinces and agricultural districts for each of the defined components, using a maximum loading rule.
3.3.1 Wheat
Agricultural district scale
Table 1.Percentage of analyzed agricultural districts(a)and provinces(b)where wheat and barley are cultivated, for which the maximum correlations per timescale were found using the multi-scalar indices.
Timescale 1 2 3 4 5 6 7 8 9 10 11 12 18 24
(a)Agricultural district data
Wheat SPI 18.38 15.38 13.68 9.83 4.27 7.26 2.56 5.13 1.28 3.42 6.41 2.14 5.98 4.27 SPEI 16.67 14.96 17.09 9.83 6.41 3.42 5.13 4.7 3.42 2.56 3.85 4.27 5.13 2.56 SPDI 26.07 21.79 13.68 5.13 3.42 2.99 2.56 2.56 2.14 5.13 1.71 3.85 3.42 5.56 Averaged % 20.37 17.38 14.82 8.26 4.70 4.56 3.42 4.13 2.28 3.70 3.99 3.42 4.84 4.13 Barley SPI 29.63 14.81 14.81 12.96 0 3.7 3.7 1.85 3.7 1.85 1.85 3.7 3.7 3.7
SPEI 24.07 12.96 22.22 9.26 1.85 3.7 5.56 3.7 3.7 1.85 0 5.56 1.85 SPDI 24.07 14.81 14.81 7.41 7.41 3.7 11.11 1.85 0 3.7 0 0 3.7 7.41 Averaged % 25.92 14.19 17.28 9.88 3.09 3.70 6.79 2.47 2.47 2.47 0.62 3.09 3.08 4.94
(b)Provincial data
Wheat SPI 6.98 13.95 23.26 6.98 2.33 6.98 6.98 6.98 6.98 2.33 4.65 4.65 4.65 2.33 SPEI 9.3 11.63 23.26 11.63 9.3 0 6.98 6.98 2.33 2.33 4.65 4.65 4.65 2.33 SPDI 13.95 32.56 13.95 2.33 2.33 4.65 4.65 6.98 0 2.33 6.98 2.33 0 6.98 Averaged % 10.08 19.38 20.16 6.98 4.65 3.88 6.20 6.98 3.10 2.33 5.43 3.88 3.10 3.88 Barley SPI 7.14 19.05 30.95 9.52 4.76 7.14 0 2.38 2.38 0 0 11.9 0 4.76 SPEI 11.9 11.9 33.33 7.14 4.76 4.76 7.14 4.76 7.14 0 0 2.38 2.38 2.38 SPDI 9.52 38.1 14.29 4.76 4.76 7.14 0 0 7.14 0 2.38 4.76 2.38 4.76 Averaged % 9.52 23.02 26.19 7.14 4.76 6.35 2.38 2.38 5.55 0.00 0.79 6.35 1.59 3.97
Table 2.Percentage of analyzed agricultural districts and provinces where wheat and barley are cultivated, for which the maximum cor-relations with the multi-scalar indices were found. Information in parentheses shows the timescale at which the provinces and agricultural districts correlate most and the percentage of the provinces and district.
SPEI SPDI SPI
Agricultural Wheat 36.75 (3, 7.26) 33.33 (1, 7.69) 29.91 (2, 4.70) districts Barley 35.19 (3, 11.11) 44.44 (1, 12.96) 20.37 (1, 11.11) Provinces Wheat 58.14 (3, 18.60) 13.95 (24, 4.65) 27.9 (3, 4.65) Barley 69.04 (3, 16.66) 9.52 (1, 7.14) 21.42 (5,24, 4.76)
scale. The first component (PC1) explained 43.36 % of the variance and was characterized by stronger correlations (c= 0.7–0.9) in districts mainly located on the north and cen-tral plateau; these were stronger than those recorded for the same locations at the provincial scale. Weaker correlations (c=0.15–0.5) were dispersed, although these were found predominantly in the south and northwest. The scores for PC1 showed particular sensitivity to drought during spring, although strong correlations were also found during autumn. The second component (PC2) explained 18.63 % of the vari-ance, and the loading coefficients also showed a clear spa-tial pattern, with the agricultural districts north of Sevilla and east of Castilla La Mancha having the highest values. The weakest correlations were found for the districts of An-dalucía, Extremadura, and Aragón. Lower scores in PC2 characterized the interannual response to drought relative to
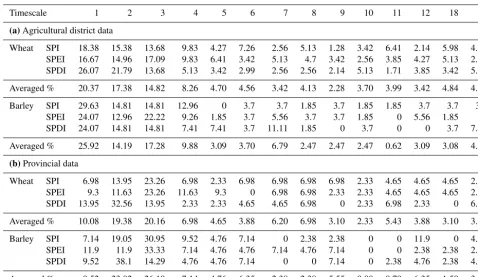
Figure 6. Spatial distribution of the drought indices with the strongest correlations with wheat(a, c) and barley(b, d)at the province
(c, d)and agricultural district(a, b)scales.
Provincial scale
The results for wheat at the provincial scale (Fig. 7b) showed that the first (PC1) and second (PC2) components explained 51.7 % and 20.8 % of the variance, respectively. The loadings of the first component were higher for the central plateau and the east of Spain. These represent provinces in the Castilla y León and Castilla y La Mancha districts and the provinces of Castellón, Valencia, Alicante, Cantabria, and Huelva, and Sevilla and Almería in Andalucía. In these provinces there was a strong correlation between drought indices and crop yields, especially during spring, with particularly strong cor-relations in May. In contrast, during winter the corcor-relations were weaker, especially in February. PC2 showed greater spatial heterogeneity, with strong correlations in the east (Zaragoza and Tarragona provinces) and south (Cádiz, Cór-doba, Málaga, Granada, and Jaén provinces) of Spain. For this component the temporal response to drought was not as strong as that for PC1, but the maximum correlation was also found during May. The distribution of the maximum loadings showed a dispersed pattern, with PC1 grouping provinces in the central plateau and east of Spain and PC2 grouping those in southern and some northeastern provinces. The averaged temporal response to drought during spring is set at medium timescales (4–7 months). In particular, in May most of the
provinces correlated at 5 months (Fig. 9a, b), indicating the importance of climatic conditions during winter and spring to the crop yields obtained. This was also evident for the longer timescales at which most of the provinces correlated during the winter months (11–18 months). It is noteworthy that there was great variability in the temporal response of provinces in PC1 in October, February, March, and April.
3.3.2 Barley
Agricultural district scale
Figure 9.Box plots showing the timescale at which significant monthly correlations were found in the provinces(a–d)and agricultural districts(e–h)for wheat and barley for each of the components defined in the PCA.
Provincial scale
For barley at the provincial scale (Fig. 8b) we found more variability in the magnitude of correlations. For PC1 (ex-plaining 43.22 % of the variance) strong correlations (r= 0.7–0.9) were found for the north and central provinces of Castilla y León, the central provinces of Castilla y la Mancha, and Madrid, Teruel, Valencia, and Castellón. The provinces associated with PC2 (explaining 27.91 % of the variance) were more dispersed than those in PC1, and those show-ing strong correlations included Zaragoza and Guadalajara
corre-lations at longer timescales (7–8 months), while provinces in PC2 showed responses at shorter timescales (3–4 months) (Fig. 9c, d).
3.3.3 General climatological characteristics for the PCA components
Figures S3–S12 show the distribution of climatic characteris-tics including precipitation, atmospheric evaporative demand (AED), maximum and minimum temperature, and the hy-droclimatic balance (precipitation minus AED) at the district scale for the two PCA components. For those districts where wheat was cultivated, no major differences in AED values were found among the components. However, minor differ-ences were observed in precipitation among districts belong-ing to different PCA components. Those in PC2 had on av-erage less precipitation than those in PC1, especially during autumn, but the difference was not substantial. Greater dif-ferences were observed for temperature, with PC1 mainly characterized by districts that had higher maximum temper-atures in autumn and spring, and with higher minimum tem-peratures than the districts in PC2. These results highlight the important role of temperature in the different responses of crop yield to drought and demonstrate that, contrary to what may have been expected, temperature and not precip-itation was the main factor constraining crop growth. Thus, changes in extreme temperature levels may influence future crop yields. Districts in PC2 where the barley yield corre-lated with drought indices were characterized by lower levels of precipitation and higher maximum and minimum temper-atures than districts represented by PC1 and by higher AED, especially from April to July. Extremes of temperature also seemed to be the major factor determining barley crop yield.
4 Discussion
In this study we investigated the impacts of drought on two rainfed crops in Spain, as measured by a variety of drought indices. We used two datasets of annual crop yields, one from agricultural statistics at the provincial scale spanning the pe-riod 1962–2013 and the other a new database at the agricul-tural district scale from the available parcel data from the national survey covering the period 1993–2015. To identify the best indicator of the impact of drought on yields and their sensitivity to climate, we evaluated the performance of seven drought indices. The selection of drought indices was based on those commonly used to monitoring droughts worldwide, including the Standardized Precipitation Evapotranspiration Index (SPEI), the Standardized Precipitation Index (SPI), the Palmer drought indices (PDSI,ZIndex, PHDI, and PMDI), and the Standardized Palmer Drought Index (SPDI).
Independently of the type of crop and the temporal scale considered, our results showed that drought indices calcu-lated at different timescales (the SPEI, the SPI, and the SPDI)
had greater capacity to reflect the impacts of climate on crop yields, relative to uni-scalar drought indices. The better per-formance of these multi-scalar drought indices was mainly because of their flexibility in reflecting the negative impacts of drought over a range of regions with very different char-acteristics (Vicente-Serrano et al., 2011). This issue is espe-cially relevant in agriculture, as vegetation components do not respond equally to water deficit. The sensitivity and vul-nerability of each type of crop to drought and the character-istics of the specific region influence the variability evident in the response to droughts (Contreras and Hunink, 2015). Nonetheless, the results of the assessment of the performance of the Palmer drought indices demonstrated that correlations varied markedly among them, showing some exceptions that may affect their usefulness for monitoring purposes. Overall, our results showed that the PHDI had the weakest relation-ship to crop yields, followed by the PDSI and the PMDI. The better performance of the PDSI over the PHDI was expected, as the latter was primarily developed for hydrological pur-poses. Likewise, our results confirmed a better performance of the PMDI (a modified version of the PDSI) over the origi-nal PDSI for both crops. Our results are consistent with those of previous studies assessing agricultural drought impacts on crop yields at the global (Vicente-Serrano et al., 2012) and regional (Peña-Gallardo et al., 2018b) scales. TheZ Index was the best uni-scalar index among the set analyzed in our study. This index measures short-term moisture conditions, which is a major factor in crop stress (Quiring and Papakryi-akou, 2003). Thus, theZIndex was more closely correlated with crop yield than any of the other Palmer indices, indi-cating its usefulness relative to other Palmer drought indices (Karl, 1986).
Although our findings point to poorer performance of the Palmer drought indices relative to the multi-scalar drought indices, they remain among the most widely accepted in-dices. Numerous studies have used the Palmer indices in as-sessments of the use of drought indices for monitoring agri-cultural drought in various regions worldwide and have re-ported the superiority of the Z Index (Mavromatis, 2007; Quiring and Papakryiakou, 2003; Sun et al., 2012; Tu-nalıo˘glu and Durdu, 2012; our results confirm its usefulness among the Palmer drought indices.
Al-though previous studies reported differences among some of the above three indices (e.g., the SPDI and the SPEI; Ghabaei Sough et al., 2018), others have reported similar-ities in their performance in assessing agricultural drought impacts (Labudová et al., 2016; Peña-Gallardo et al., 2018a). The similar magnitudes of their correlations suggest a sim-ilar ability to characterize the impact of drought on crop yields. However, minor differences among these indices sug-gested the SPEI performed best. First, for both crops slightly stronger correlations were observed with the SPEI, although the SPDI was superior in relation to barley yields at the agri-cultural district scale. In general, the SPEI was found to be the most suitable drought index in the majority of agricultural districts and provinces, in accordance to Ribeiro et al. (2018) who also found it suitable in Spain for relating drought con-ditions and yields variability. This suggests that inclusion of AED in the drought index calculation, as occurs in the SPEI, provides greater capacity to predict drought impacts on crop yields compared with the use of precipitation only. Varia-tion in the maximum and minimum temperatures has been found to be the major factor differentiating agricultural dis-tricts and provinces with greater sensitivity to drought. Previ-ous studies have stressed the risks associated with an increase in global temperatures, particularly maximum temperatures, and the possible effects on crop yields (Lobell and Field, 2007; Moore and Lobell, 2014). Thus, a ∼5.4 % reduction in grain yields resulting from an increase in average temper-ature is expected to occur under the current global warming scenario (Asseng et al., 2014; Zhao et al., 2017).
The temporal and spatial effects of drought on yields seem to be very complex, given the observed variability in Spain. In this respect, significant yield effects of drought were found in both datasets. Nevertheless, at the agricultural district scale there was a more evident spatial effect of drought on agricultural yields. This is a key finding for spatial-scale analyses, although the lack of long time series datasets on regional yields is a common constraint.
Drought effects on barley and wheat were similar in space and time, although their sensitivity to drought differed, as shown by differences in the magnitude of the correlations with the drought indices, with wheat yields showing stronger correlations than barley yields. This can be explained by the different physiological characteristics of the two crops, as barley is less dependent on water availability at germi-nation and the grain filling stage than wheat (Mamnouie et al., 2006). Although the transpiration coefficient for barley is higher, this crop is not as subject as wheat to water stress under drought conditions (Fischer et al., 1998). Our results indicate that the temporal responses of barley and wheat to drought conditions were very similar, despite the fact that in Spain barley is typically cultivated later than wheat and in soils with poor moisture retention. Therefore, the pheno-logical characteristics of each type of crop determine how drought affects yields. The results showed that temperature had a more important role than precipitation, suggesting that
extreme variations in average temperature conditions during the most sensitive growth stages may have a negative impact on crops.
Overall, crop yields in Spain tend to respond to short drought timescales (1–3 months). However, the sensitivity of crops to drought is greater during spring at medium (4– 6 months) timescales. These results are in line with previ-ous studies conducted in the Iberian Peninsula with a sim-ilar database at provincial scale that also point to shorter timescales, mostly during spring months (1–6 months) (Ribeiro et al., 2018). This highlights that moisture condi-tions during winter (the period corresponding to planting and the first growth stages of tillering and stem elongation) are crucial for the successful development of the plants (Çakir, 2004; Moorhead et al., 2015; Wang et al., 2016a, b).
5 Conclusions
The main findings of this study are summarized below. 1. Assessment of the efficacy of drought indices for
mon-itoring the effect of climate on agricultural yields demonstrated the better performance of multi-scalar in-dices. The ability to calculate these indices at vari-ous timescales enabled drought impacts to be more precisely defined than with the use of indices lacking this characteristic. The multi-scalar drought indices as-sessed also had fewer computational and data require-ments (particularly the SPEI and the SPI), which is a significant consideration when performing analyses based on scarce climate data.
2. From a quantitative evaluation of the relationship of drought indices to crop yields we determined that both of the multi-scalar drought indices tested were useful for the assessment of agricultural drought in Spain. How-ever, the SPEI had slightly better correlations and is the most highly recommended for the purpose.
3. The spatial definition of yield responses to drought was clearer at the district scale, where the finer spatial res-olution enabled better definition of the patterns of re-sponses because the climatic variability of each region was better captured at this scale.
4. Barley and wheat yields were more vulnerable to drought during spring, both at short (1–3 months) and medium (4–6 months) timescales. Moisture conditions during late autumn and winter also had an impact on the crop yields.
5. The strongest relationships between drought indices and crop yields were found for the northern and central agri-cultural districts. The relationships for the southern dis-tricts were weaker because of the difficulty of charac-terizing drought impacts over the diverse and complex territory involved.
6. The climatic and agricultural conditions in Spain are very diverse. The large spatial diversity and the com-plexity of droughts highlight the need to establish accu-rate and effective indices to monitor the variable evolu-tion of drought in vulnerable agriculture areas. Climate change is likely to lead to yield losses because of in-creased drought stress on crops, so in this context effec-tive monitoring tools are of utmost importance. The au-thors consider that further analysis complementing this study may help to unravel the climate mechanisms that influence the spatiotemporal responses of yields to cli-mate in Spain.
Data availability. Crop yield data are publicly available and can be accessed for free upon request from the Spanish Ministry of
Agri-culture, Fisheries and Food. Climatic information used to create the gridded datasets was provided privately by the Spanish Meteorolog-ical Agency (AEMET). It can be accessed by users upon request to the agency.
Supplement. The supplement related to this article is available online at: https://doi.org/10.5194/nhess-19-1215-2019-supplement.
Author contributions. SMVS and SBP designed the research. MPG performed the formal analysis and drafted the paper. SMVS, SB, and FDC contributed to writing the review and editing the paper.
Competing interests. The authors declare that they have no conflict of interest.
Special issue statement. This article is part of the special issue “Hydroclimatic extremes and impacts at catchment to regional scales”. It is not associated with a conference.
Acknowledgements. Authors thank the three anonymous reviewers for their constructive comments in the review of this paper and the anonymous judges that evaluated this study during the OSPP-EGU 2018.
Financial support. This research has been supported by the Euro-pean Geosciences Union (OSPP Award 2018 grant), the Spanish Commission of Science and Technology and FEDER (grant nos. PCIN-2015-220 and CGL2014-52135-C03-01), the Water Works 2014 and European Commission (IMDROFLOOD grant), the JPI Climate, funded by FORMAS (SE), DLR (DE), BMWFW (AT), IFD (DK), MINECO (ES), and ANR (FR), with co-funding by the European Union (INDECIS, ERA4CS, and ERA-NET grants, grant no. 690462), and the Spanish Ministry of Economy and Competi-tiveness (grant no. FPI2015 – BES-2015-072022).
Review statement. This paper was edited by Chris Reason and re-viewed by three anonymous referees.
References
Alcamo, J., Flörke, M., and Märker, M.: Future long-term changes in global water resources driven by socio-economic and climatic changes, Hydrol. Sci. J., 52, 247–275, https://doi.org/10.1623/hysj.52.2.247, 2007.
Allen, R. G., Pereira, L. S., Raes, D., and Smith, M.: No Title, Crop Evapotranspiration Guidel, Comput. Crop Water Requir., ISBN 92-5-104219-5, 1998.
Mete-orol., 23, 1100–1109, https://doi.org/10.1175/1520-0450(1984)023<1100:TPDSIL>2.0.CO;2, 1984.
Asseng, S., Foster, I., and Turner, N. C.: The impact of temperature variability on wheat yields, Glob. Chang. Biol., 17, 997–1012, https://doi.org/10.1111/j.1365-2486.2010.02262.x, 2011. Asseng, S., Ewert, F., Martre, P., Rötter, R. P., Lobell, D. B.,
Cam-marano, D., Kimball, B. A., Ottman, M. J., Wall, G. W., White, J. W., Reynolds, M. P., Alderman, P. D., Prasad, P. V. V., Aggar-wal, P. K., Anothai, J., Basso, B., Biernath, C., Challinor, A. J., De Sanctis, G., Doltra, J., Fereres, E., Garcia-Vila, M., Gayler, S., Hoogenboom, G., Hunt, L. A., Izaurralde, R. C., Jabloun, M., Jones, C. D., Kersebaum, K. C., Koehler, A.-K., Müller, C., Naresh Kumar, S., Nendel, C., O’Leary, G., Olesen, J. E., Palo-suo, T., Priesack, E., Eyshi Rezaei, E., Ruane, A. C., Semenov, M. A., Shcherbak, I., Stöckle, C., Stratonovitch, P., Streck, T., Supit, I., Tao, F., Thorburn, P. J., Waha, K., Wang, E., Wal-lach, D., Wolf, J., Zhao, Z., and Zhu, Y.: Rising temperatures reduce global wheat production, Nat. Clim. Change, 5, 143–147, https://doi.org/10.1038/nclimate2470, 2014.
Blanc, E.: The Impact of Climate Change on Crop Yields in Sub-Saharan Africa, Am. J. Clim. Change, 1, 1–13, https://doi.org/10.4236/ajcc.2012.11001, 2012.
Çakir, R.: Effect of water stress at different development stages on vegetative and reproductive growth of corn, F. Crop. Res., 89, 1–16, https://doi.org/10.1016/j.fcr.2004.01.005, 2004.
Cantelaube, P., Terres, J., and Doblas-Reyes, F.: Influence of climate variability on European agriculture-analysis of winter wheat production, Clim. Res., 27, 135–144, https://doi.org/10.3354/cr027135, 2004.
Capa-Morocho, M., Ines, A. V. M., Baethgen, W. E., Rodríguez-Fonseca, B., Han, E., and Ruiz-Ramos, M.: Crop yield out-looks in the Iberian Peninsula: Connecting seasonal climate fore-casts with crop simulation models, Agric. Syst., 149, 75–87, https://doi.org/10.1016/J.AGSY.2016.08.008, 2016.
Chen, T., Xia, G., Liu, T., Chen, W., Chi, D., Chen, T., Xia, G., Liu, T., Chen, W., and Chi, D.: Assessment of Drought Impact on Main Cereal Crops Using a Standardized Precipitation Evap-otranspiration Index in Liaoning Province, China, Sustainability, 8, 1069, https://doi.org/10.3390/su8101069, 2016.
Contreras, S. and Hunink, J. E.: Drought effects on rainfed agri-culture using standardized indices: A case study in SE Spain, in Drought: Research and Science-Policy Interfacing, 2015. Dai, A.: Drought under global warming: a review, Wiley Interdiscip.
Rev. Clim. Change, 2, 45–65, https://doi.org/10.1002/wcc.81, 2011.
Doesken, N. J. and Garen, D.: Drought Monitoring in the West-ern United States using a Surface Water Supply Index, Preprints, Seventh Conference on Applied Climatology, Salt Lake City, UT, American Meteorological Society, 266–269, 1991.
Domínguez-Castro, F., Ribera, P., García-Herrera, R., Vaquero, J. M., Barriendos, M., Cuadrat, J. M., and Moreno, J. M.: Assess-ing extreme droughts in Spain durAssess-ing 1750–1850 from rogation ceremonies, Clim. Past, 8, 705–722, https://doi.org/10.5194/cp-8-705-2012, 2012.
Ebrahimpour, M., Rahimi, J., Nikkhah, A., and Bazrafshan, J.: Monitoring Agricultural Drought Using the Standardized Effec-tive Precipitation Index, J. Irrig. Drain. Eng., 141, 04014044, https://doi.org/10.1061/(ASCE)IR.1943-4774.0000771, 2015.
Esfahanian, E., Nejadhashemi, A. P., Abouali, M., Ad-hikari, U., Zhang, Z., Daneshvar, F., and Herman, M. R.: Development and evaluation of a comprehen-sive drought index, J. Environ. Manage., 185, 31–43, https://doi.org/10.1016/j.jenvman.2016.10.050, 2017.
European Commission, Agriculture and Rural Devel-opment: Commission offers further support to Eu-ropean farmers dealing with droughts, available at:https://ec.europa.eu/info/news/commission-offers-further-support-european-farmers-dealing-droughts-2018-aug-02-0_en, last access: 26 October 2018.
European Environment Agency (EEA): Climate change, impacts and vulnerability in Europe 2016, An indicator-based report, Luxembourg, 424 pp., 2017.
Fink, A. H., Brücher, T., Krüger, A., Leckebusch, G. C., Pinto, J. G., and Ulbrich, U.: The 2003 European summer heatwaves and drought – synoptic diagnosis and impacts, 59, 209–216, https://doi.org/10.1256/wea.73.04, 2004.
Fischer, R. A., Rees, D., Sayre, K. D., Lu, Z.-M., Condon, A. G., and Saavedra, A. L.: Wheat Yield Progress Asso-ciated with Higher Stomatal Conductance and Photosyn-thetic Rate, and Cooler Canopies, Crop. Sci., 38, 1467, https://doi.org/10.2135/cropsci1998.0011183X003800060011x, 1998.
Fontana, G., Toreti, A., Ceglar, A., and De Sanctis, G.: Early heat waves over Italy and their impacts on durum wheat yields, Nat. Hazards Earth Syst. Sci., 15, 1631–1637, https://doi.org/10.5194/nhess-15-1631-2015, 2015.
Forzieri, G., Feyen, L., Russo, S., Vousdoukas, M., Alfieri, L., Outten, S., Migliavacca, M., Bianchi, A., Rojas, R., and Cid, A.: Multi-hazard assessment in Europe under climate change, Clim. Change, 137, 105–119, https://doi.org/10.1007/s10584-016-1661-x, 2016.
García-Herrera, R., Díaz, J., Trigo, R. M., Luterbacher, J., and Fischer, E. M.: A Review of the European Summer Heat Wave of 2003, Crit. Rev. Environ. Sci. Technol., 40, 267–306, https://doi.org/10.1080/10643380802238137, 2010.
García-León, D., Contreras, S., and Hunink, J.: Comparison of meteorological and satellite-based drought indices as yield pre-dictors of Spanish cereals, Agr. Water Manage., 213, 388–396, https://doi.org/10.1016/J.AGWAT.2018.10.030, 2019.
Ghabaei Sough, M., Zare Abyaneh, H., and Mosaedi, A.: Assessing a Multivariate Approach Based on Scalogram Analysis for Agri-cultural Drought Monitoring, Water Resour. Manag., 32, 3423– 3440, https://doi.org/10.1007/s11269-018-1999-0, 2018. Giorgi, F. and Lionello, P.: Climate change projections for
the Mediterranean region, Glob. Planet. Change, 63, 90–104, https://doi.org/10.1016/j.gloplacha.2007.09.005, 2008.
Gouveia, C. M., Trigo, R. M., Beguería, S., and Vicente-Serrano, S. M.: Drought impacts on vegetation activity in the Mediter-ranean region: An assessment using remote sensing data and multi-scale drought indicators, Glob. Planet. Change, 151, 15– 27, https://doi.org/10.1016/j.gloplacha.2016.06.011, 2016. Guttman, N. B.: Comparing the Palmer Drought Index and
Hanjra, M. A. and Qureshi, M. E.: Global water crisis and future food security in an era of climate change, Food Policy, 35, 365– 377, https://doi.org/10.1016/J.FOODPOL.2010.05.006, 2010. Heim, R. R.: A Review of Twentieth-Century Drought
Indices Used in the United States, B. Am. Meteo-rol. Soc., 83, 1149–1165, https://doi.org/10.1175/1520-0477(2002)083<1149:AROTDI>2.3.CO;2, 2002.
Hernandez-Barrera, S., Rodriguez-Puebla, C., and Challinor, A. J.: Effects of diurnal temperature range and drought on wheat yield in Spain, Theor. Appl. Climatol., 129, 503–519, https://doi.org/10.1007/s00704-016-1779-9, 2016.
IPCC 2014: Climate Change 2014: Mitigation of Climate Change, Contribution of Working Group III to the Fifth Assessment Re-port of the Intergovernmental Panel on Climate Change, edited by: Edenhofer, O., Pichs-Madruga, R., Sokona, Y., Farahani, E., Kadner, S., Seyboth, K., Adler, A., Baum, I., Brunner, S., Eickemeier, P., Kriemann, B., Savolainen, J., Schlömer, S., von Stechow, C., Zwickel, T., and Minx, J. C., Cambridge Univer-sity Press, Cambridge, United Kingdom and New York, NY, 1454 pp., USA.
Karl, T. R.: The Sensitivity of the Palmer Drought Sever-ity Index and Palmer’s Z-Index to their Calibration Co-efficients Including Potential Evapotranspiration, J. Clim. Appl. Meteorol., 25, 77–86, https://doi.org/10.1175/1520-0450(1986)025<0077:TSOTPD>2.0.CO;2, 1986.
Kim, B.-S., Sung, J.-H., Kang, H.-S., and Cho, C.-H.: As-sessment of Drought Severity over South Korea us-ing Standardized Precipitation Evapo-transpiration In-dex (SPEI), J. Korea Water Resour. Assoc., 45, 887–900, https://doi.org/10.3741/JKWRA.2012.45.9.887, 2012.
Koláˇr, P., Trnka, M., Brázdil, R., and Hlavinka, P.: Influence of climatic factors on the low yields of spring barley and winter wheat in Southern Moravia (Czech Republic) during the 1961–2007 period, Theor. Appl. Climatol., 117, 707–721, https://doi.org/10.1007/s00704-013-1037-3, 2014.
Kuhnert, M., Yeluripati, J., Smith, P., Hoffmann, H., van Oijen, M., Constantin, J., Coucheney, E., Dechow, R., Eckersten, H., Gaiser, T., Grosz, B., Haas, E., Kersebaum, K.-C., Kiese, R., Klatt, S., Lewan, E., Nendel, C., Raynal, H., Sosa, C., Specka, X., Teixeira, E., Wang, E., Weihermüller, L., Zhao, G., Zhao, Z., Ogle, S., and Ewert, F.: Impact analysis of climate data aggregation at different spatial scales on simulated net pri-mary productivity for croplands, Eur. J. Agron., 88, 41–52, https://doi.org/10.1016/j.eja.2016.06.005, 2016.
Labudová, L., Labuda, M., and Takáˇc, J.: Comparison of SPI and SPEI applicability for drought impact assess-ment on crop production in the Danubian Lowland and the East Slovakian Lowland, Theor. Appl. Climatol., 1–16, https://doi.org/10.1007/s00704-016-1870-2, 2016.
Liu, B., Asseng, S., Müller, C., Ewert, F., Elliott, J., Lobell, D. B., Martre, P., Ruane, A. C., Wallach, D., Jones, J. W., Rosenzweig, C., Aggarwal, P. K., Alderman, P. D., Anothai, J., Basso, B., Bier-nath, C., Cammarano, D., Challinor, A., Deryng, D., Sanctis, G. D., Doltra, J., Fereres, E., Folberth, C., Garcia-Vila, M., Gayler, S., Hoogenboom, G., Hunt, L. A., Izaurralde, R. C., Jabloun, M., Jones, C. D., Kersebaum, K. C., Kimball, B. A., Koehler, A.-K., Kumar, S. N., Nendel, C., O’Leary, G. J., Olesen, J. E., Ottman, M. J., Palosuo, T., Prasad, P. V. V., Priesack, E., Pugh, T. A. M., Reynolds, M., Rezaei, E. E., Rötter, R. P., Schmid, E., Semenov,
M. A., Shcherbak, I., Stehfest, E., Stöckle, C. O., Stratonovitch, P., Streck, T., Supit, I., Tao, F., Thorburn, P., Waha, K., Wall, G. W., Wang, E., White, J. W., Wolf, J., Zhao, Z., and Zhu, Y.: Sim-ilar estimates of temperature impacts on global wheat yield by three independent methods, Nat. Clim. Change, 6, 1130–1136, https://doi.org/10.1038/nclimate3115, 2016.
Lobell, D. B. and Asner, G. P.: Climate and management contri-butions to recent trends in U.S. agricultural yields, Science, 80, 1032, https://doi.org/10.1126/science.1078475, 2003.
Lobell, D. B. and Field, C. B.: Global scale climate-crop yield rela-tionships and the impacts of recent warming, Environ. Res. Lett., 2, 014002, https://doi.org/10.1088/1748-9326/2/1/014002, 2007. Lobell, D. B., Schlenker, W., and Costa-Roberts, J.: Climate Trends and Global Crop Production Since 1980, Science, 333, 6042, 616–620, 2011.
Loukas, A. and Vasiliades, L.: Probabilistic analysis of drought spa-tiotemporal characteristics inThessaly region, Greece, Nat. Haz-ards Earth Syst. Sci., 4, 719–731, https://doi.org/10.5194/nhess-4-719-2004, 2004.
Ma, M., Ren, L., Yuan, F., Jiang, S., Liu, Y., Kong, H., and Gong, L.: A new standardized Palmer drought index for hydro-meteorological use, Hydrol. Process., 28, 5645–5661, https://doi.org/10.1002/hyp.10063, 2014.
Mamnouie, E., Ghazvini, R. F., Esfahany, M., and Nakhoda, B.: The Effects of Water Deficit on Crop Yield and the Physiological Characteristics of Barley (Hordeum vulgareL.) Varieties, avail-able at: http://jast.modares.ac.ir/article-23-5420-en.pdf (last ac-cess: 24 November 2018), 2006.
Mavromatis, T.: Drought index evaluation for assessing future wheat production in Greece, Int. J. Climatol., 27, 911–924, https://doi.org/10.1002/joc.1444, 2007.
McEvoy, D. J., Huntington, J. L., Abatzoglou, J. T., Edwards, L. M., McEvoy, D. J., Huntington, J. L., Abatzoglou, J. T., and Edwards, L. M.: An Evaluation of Multiscalar Drought Indices in Nevada and Eastern California, Earth Interact., 16, 1–18, https://doi.org/10.1175/2012EI000447.1, 2012.
Mckee, T. B., Doesken, N. J., and Kleist, J.: The relation-shio of drought frequency and duration to time scales, Eighth Conf. Appl. Climatol., 17–22 available at: http: //www.droughtmanagement.info/literature/AMS_Relationship_ Drought_Frequency_Duration_Time_Scales_1993.pdf (last access: 30 May 2018), 1993.
Meng, Q., Chen, X., Lobell, D. B., Cui, Z., Zhang, Y., Yang, H., and Zhang, F.: Growing sensitivity of maize to water scarcity under climate change, Sci. Rep., 6, 19605, https://doi.org/10.1038/srep19605, 2016.
Moore, F. C. and Lobell, D. B.: Adaptation potential of European agriculture in response to climate change, Nat. Clim. Change, 4, 610–614, https://doi.org/10.1038/nclimate2228, 2014.
Moorhead, J. E., Gowda, P. H., Singh, V. P., Porter, D. O., Marek, T. H., Howell, T. A., and Stewart, B. A.: Identifying and Eval-uating a Suitable Index for Agricultural Drought Monitoring in the Texas High Plains, JAWRA J. Am. Water Resour. Assoc., 51, 807–820, https://doi.org/10.1111/jawr.12275, 2015.
Palmer, W. C.: Meteorological Drought, Research Paper, U.S. Dep. Commer. Weather Bur. Washington, DC, Research P., 45, p. 58., 1965.
Peninsula from 1929 to 2012, Int. J. Biometeorol., 61, 1–13, https://doi.org/10.1007/s00484-016-1224-x, 2016.
Peña-Gallardo, M., Vicente-Serrano, S., Domínguez-Castro, F., Quiring, S., Svoboda, M., Beguería, S., and Hannaford, J.: Effectiveness of drought indices in identifying impacts on major crops across the USA, Clim. Res., 75, 221–240, https://doi.org/10.3354/cr01519, 2018a.
Peña-Gallardo, M., Quiring, S., Svoboda, M., Hannaford, J., Tomas-Burguera, M., Martín-Hernández, N., Domínguez-Castro, F. and El Kenawy, A.: Response of crop yield to different time-scales of drought in the United States: Spatio-temporal patterns and cli-matic and environmental drivers, Agr. Forest Meteorol., 264, 40– 55, https://doi.org/10.1016/j.agrformet.2018.09.019, 2018b. Potopová, V.: Evolution of drought severity and its impact on corn
in the Republic of Moldova, Theor. Appl. Climatol., 105, 469– 483, https://doi.org/10.1007/s00704-011-0403-2, 2011. Potopová, V., Štˇepánek, P., Možný, M., Türkott, L., and Soukup,
J.: Performance of the standardised precipitation evapotranspi-ration index at various lags for agricultural drought risk assess-ment in the Czech Republic, Agr. Forest Meteorol., 202, 26–38, https://doi.org/10.1016/J.AGRFORMET.2014.11.022, 2015. Potopová, V., Štˇepánek, P., Farda, A., Türkott, L., Zahradníˇcek, P.,
and Soukup, J.: Drought stress impact on vegetable crop yields in the Elbe River lowland between 1961 and 2014, Cuad. Investig. Geográfica, 42, 127, https://doi.org/10.18172/cig.2924, 2016a. Potopová, V., Boronean¸t, C., Boincean, B., and Soukup, J.:
Impact of agricultural drought on main crop yields in the Republic of Moldova, Int. J. Climatol., 36, 2063–2082, https://doi.org/10.1002/joc.4481, 2016b.
Quiring, S. M. and Papakryiakou, T. N.: An evaluation of agricultural drought indices for the Canadian prairies, Agr. Forest Meteorol., 118, 49–62, https://doi.org/10.1016/S0168-1923(03)00072-8, 2003.
Ribeiro, A. F. S., Russo, A., Gouveia, C. M., and Páscoa, P.: Mod-elling drought-related yield losses in Iberia using remote sensing and multiscalar indices, Theor. Appl. Climatol., 136, 203–220. https://doi.org/10.1007/s00704-018-2478-5, 2019.
Richman, M. B.: Rotation of principal components, J. Climatol., 6, 293–335, https://doi.org/10.1002/joc.3370060305, 1986. Sepulcre-Canto, G., Horion, S., Singleton, A., Carrao, H., and Vogt,
J.: Development of a Combined Drought Indicator to detect agri-cultural drought in Europe, Nat. Hazards Earth Syst. Sci., 12, 3519–3531, https://doi.org/10.5194/nhess-12-3519-2012, 2012. Spinoni, J., Vogt, J. V., Naumann, G., Barbosa, P., and
Dosio, A.: Will drought events become more frequent and severe in Europe?, Int. J. Climatol., 38, 1718–1736, https://doi.org/10.1002/joc.5291, 2018.
Sun, L., Mitchell, S. W., and Davidson, A.: Multiple drought indices for agricultural drought risk assessment on the Canadian prairies, Int. J. Climatol., 32, 1628–1639, https://doi.org/10.1002/joc.2385, 2012.
Tack, J., Barkley, A., and Nalley, L. L.: Effect of warming temper-atures on US wheat yields., P. Natl. Acad. Sci. USA, 112, 6931– 6936, https://doi.org/10.1073/pnas.1415181112, 2015.
Tian, L., Yuan, S., and Quiring, S. M.: Evaluation of six indices for monitoring agricultural drought in the south-central United States, Agr. Forest Meteorol., 249, 107–119, https://doi.org/10.1016/J.AGRFORMET.2017.11.024, 2018.
Tsakiris, G. and Tigkas, D.: Drought Risk in Agriculture in Mediter-ranean Regions. Case Study: Eastern Crete, in Methods and Tools for Drought Analysis and Management, Springer Nether-lands, Dordrecht, 399–414, 2007.
Tunalıo˘glu, R. and Durdu, Ö. F.: Assessment of future olive crop yield by a comparative evaluation of drought indices: a case study in western Turkey, Theor. Appl. Climatol., 108, 397–410, https://doi.org/10.1007/s00704-011-0535-4, 2012.
UPA, Unión de Pequeños Agricultores y Ganaderos: La se-quía y sus efectos sobre la agricultura y la ganadería, avail-able at: https://www.upa.es/upa/uControlador/index.php?nodo= 1021&hn=2232 (last access: 25 October 2018), 2017.
Vergni, L. and Todisco, F.: Spatio-temporal variability of precipitation, temperature and agricultural drought indices in Central Italy, Agr. Forest Meteorol., 151, 301–313, https://doi.org/10.1016/j.agrformet.2010.11.005, 2011.
Vicente-Serrano, S. M.: Spatial and temporal analysis of droughts in the Iberian Peninsula (1910–2000), Hydrol. Sci. J., 51, 83–97, https://doi.org/10.1623/hysj.51.1.83, 2006.
Vicente-Serrano, S. M., Beguería, S., and López-Moreno, J. I.: A Multiscalar Drought Index Sensitive to Global Warming: The Standardized Precipitation Evapotranspiration Index, J. Climate, 23, 1696–1718, https://doi.org/10.1175/2009JCLI2909.1, 2010. Vicente-Serrano, S. M., Beguería, S., and López-Moreno, J. I.:
Comment on “Characteristics and trends in various forms of the Palmer Drought Severity Index (PDSI) during 1900– 2008” by Aiguo Dai, J. Geophys. Res., 116, D19112, https://doi.org/10.1029/2011JD016410, 2011.
Vicente-Serrano, S. M., Beguería, S., Lorenzo-Lacruz, J., Ca-marero, J. J., López-Moreno, J. I., Azorin-Molina, C., Revuelto, J., Morán-Tejeda, E., Sanchez-Lorenzo, A., Vicente-Serrano, S. M., Beguería, S., Lorenzo-Lacruz, J., Camarero, J. J., López-Moreno, J. I., Azorin-Molina, C., Revuelto, J., Morán-Tejeda, E., and Sanchez-Lorenzo, A.: Performance of Drought Indices for Ecological, Agricultural, and Hydrological Applications, 16, 1–27, https://doi.org/10.1175/2012EI000434.1, 2012.
Vicente-Serrano, S. M., Lopez-Moreno, J.-I., Beguería, S., Lorenzo-Lacruz, J., Sanchez-Lorenzo, A., García-Ruiz, J. M., Azorin-Molina, C., Morán-Tejeda, E., Revuelto, J., Trigo, R., Coelho, F., and Espejo, F.: Evidence of increasing drought severity caused by temperature rise in southern Europe, Env-iron. Res. Lett, 9, 44001–44009, https://doi.org/10.1088/1748-9326/9/4/044001, 2014.
Vicente-Serrano, S. M., Van der Schrier, G., Beguería, S., Azorin-Molina, C., and Lopez-Moreno, J.-I.: Contribution of precipitation and reference evapotranspiration to drought indices under different climates, J. Hydrol., 526, 42–54, https://doi.org/10.1016/j.jhydrol.2014.11.025, 2015.
Vicente-Serrano, S. M., Camarero, J. J., Olano, J. M., Martín-Hernández, N., Peña-Gallardo, M., Tomás-Burguera, M., Gazol, A., Azorin-Molina, C., Bhuyan, U., and El Kenawy, A.: Diverse relationships between forest growth and the Normalized Differ-ence Vegetation Index at a global scale, Remote Sens. Environ., 187, 14–29, https://doi.org/10.1016/j.rse.2016.10.001, 2016. Vicente-Serrano, S. M., Tomas-Burguera, M., Beguería, S.,
Wang, H., Vicente-serrano, S. M., Tao, F., Zhang, X., Wang, P., Zhang, C., Chen, Y., Zhu, D., and Kenawy, A. El: Mon-itoring winter wheat drought threat in Northern China us-ing multiple climate-based drought indices and soil mois-ture during 2000–2013, Agr. Forest Meteorol., 228, 1–12, https://doi.org/10.1016/j.agrformet.2016.06.004, 2016a. Wang, Q., Wu, J., Li, X., Zhou, H., Yang, J., Geng, G., An, X.,
Liu, L., and Tang, Z.: A comprehensively quantitative method of evaluating the impact of drought on crop yield using daily multi-scale SPEI and crop growth process model, Int. J. Biometeorol., 1–15, https://doi.org/10.1007/s00484-016-1246-4, 2016b. Webber, H., Ewert, F., Olesen, J. E., Müller, C., Fronzek, S., Ruane,
A. C., Bourgault, M., Martre, P., Ababaei, B., Bindi, M., Ferrise, R., Finger, R., Fodor, N., Gabaldón-Leal, C., Gaiser, T., Jabloun, M., Kersebaum, K.-C., Lizaso, J. I., Lorite, I. J., Manceau, L., Moriondo, M., Nendel, C., Rodríguez, A., Ruiz-Ramos, M., Se-menov, M. A., Siebert, S., Stella, T., Stratonovitch, P., Trombi, G., and Wallach, D.: Diverging importance of drought stress for maize and winter wheat in Europe, Nat. Commun., 9, 4249, https://doi.org/10.1038/s41467-018-06525-2, 2018.
Wells, N., Goddard, S., Hayes, M. J., Wells, N., Goddard, S., and Hayes, M. J.: A Self-Calibrating Palmer Drought Severity In-dex, J. Climate, 17, 2335–2351, https://doi.org/10.1175/1520-0442(2004)017<2335:ASPDSI>2.0.CO;2, 2004.
Wigley, T. M. L.: The effect of changing climate on the fre-quency of absolute extreme events, Clim. Change, 97, 67–76, https://doi.org/10.1007/s10584-009-9654-7, 2009.
WMO: Standardized Precipitation Index User Guide, 24 pp., 2012. World Bank: World Bank Data, Agriculture, forestry, and fish-ing, value added (% of GDP) Data, available at: https://data. worldbank.org/indicator/nv.agr.totl.zs (last access: 25 October 2018), 2017.
Zargar, A., Sadiq, R., Naser, B., and Khan, F. I.: A review of drought indices, Environ. Rev., 19, 333–349, https://doi.org/10.1139/a11-013, 2011.
Zhao, C., Liu, B., Piao, S., Wang, X., Lobell, D. B., Huang, Y., Huang, M., Yao, Y., Bassu, S., Ciais, P., Durand, J.-L., Elliott, J., Ewert, F., Janssens, I. A., Li, T., Lin, E., Liu, Q., Martre, P., Müller, C., Peng, S., Peñuelas, J., Ruane, A. C., Wallach, D., Wang, T., Wu, D., Liu, Z., Zhu, Y., Zhu, Z., and Asseng, S.: Tem-perature increase reduces global yields of major crops in four in-dependent estimates., P. Natl. Acad. Sci. USA, 114, 9326–9331, https://doi.org/10.1073/pnas.1701762114, 2017.
Zhu, Y., Wang, W., Singh, V. P., and Liu, Y.: Combined use of me-teorological drought indices at multi-time scales for improving hydrological drought detection, Sci. Total Environ., 571, 1058– 1068, https://doi.org/10.1016/J.SCITOTENV.2016.07.096, 2016.