steve North
Virtual Reality Centre for the Built Environment
The Bartlett School of Architecture, Planning
and Construction Management
University College London
PhD Thesis
First Supervisor: Prof. Graham M. Winch
Second Supervisor: Alan Penn
ProQuest Number: U642334
All rights reserved
INFORMATION TO ALL USERS
The quality of this reproduction is dependent upon the quality of the copy submitted. In the unlikely event that the author did not send a complete manuscript and there are missing pages, these will be noted. Also, if material had to be removed,
a note will indicate the deletion.
uest.
ProQuest U642334
Published by ProQuest LLC(2015). Copyright of the Dissertation is held by the Author. All rights reserved.
This work is protected against unauthorized copying under Title 17, United States Code. Microform Edition © ProQuest LLC.
ProQuest LLC
789 East Eisenhower Parkway P.O. Box 1346
ABSTRACT
Problem definition:
Construction clients are currently without adequate software tools for simplifying the complexity of project performance.
Can 3D Information Visualisation provide construction clients with informative performance reports?
Contributions to knowledge:
A conceptual 3D framework for the interpretation of construction performance parameters
A practical example of implementing the 3D framework
A protocol for prototyping and evaluating the developed software
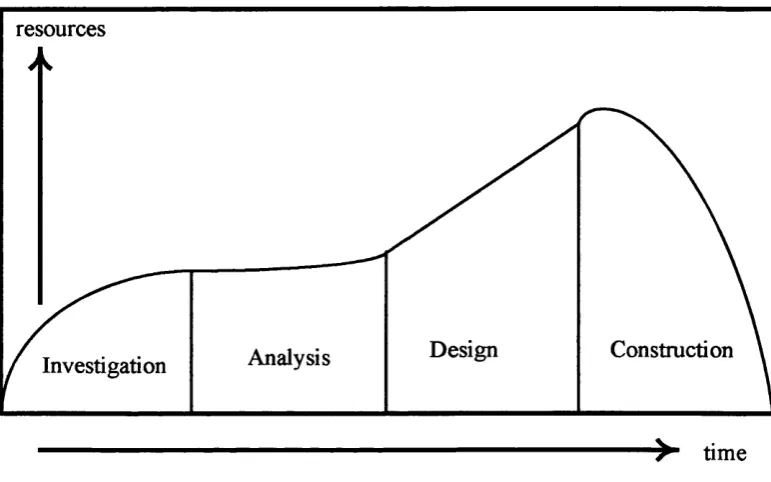
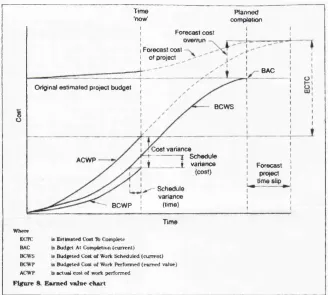
Construction project management traditionally uses two dimensional visualisation techniques to analyse project performance. These techniques are usually graphically represented as an ‘s-curve’, so called because of the characteristic plot shape (generated by resource take-up in many projects). S-curves are often limited by the amount of information that can be
simultaneously displayed.
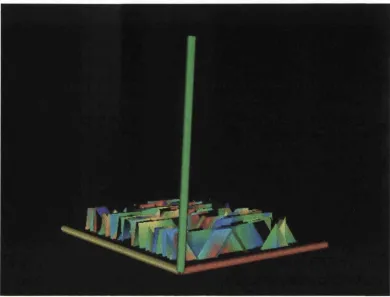
It is proposed that a more comprehensive performance measurement system might represent project progress as a three-dimensional data
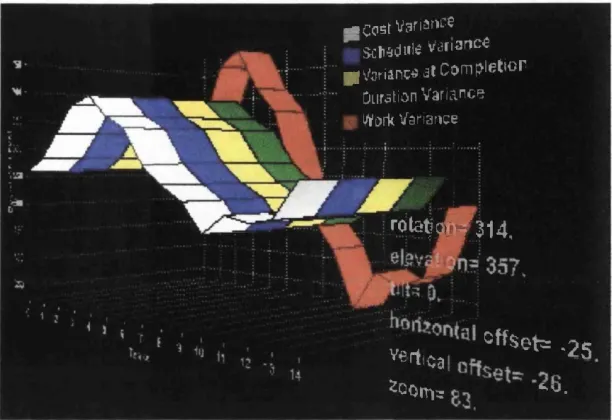
surface. This research considers the use of ‘desk-top’ Virtual Reality as an alternative to traditional project performance measurement systems. A conceptual three-dimensional framework for the representation of non physical construction industry data is outlined. This framework led to the development of Procession, a three-dimensional Information Visualisation software tool. Procession uses a three-dimensional data surface as an abstract representation of the described framework.
The target group for Procession was social housing project clients, or Registered Social Landlords (RSLs). In the UK, the catchall term RSL
describes Housing Associations, Housing Cooperatives and Local Housing Companies. Field experiments were undertaken to compare the information quality and usability of Procession, with progress reporting methods currently used in the construction industry.
CONTENTS
FIGURES... 5
Acknowledgements... 7
Chapter 1 : Introduction...8
Chapter 2: Research context and scope...15
2.1 Chapter introduction... 15
2.2 What information is being visualised (the distinction between construction product, process and performance)?...16
2.3 An overview of current construction software... 17
2.4 Modelling, communicating and sharing construction information...21
2.5 Social housing and the Registered Social Landlord (RSL)... 28
2.6 Focus of the research... 29
2.7 Chapter summary and contextualisation...31
Chapter 3; Selecting a software development methodology...33
3.1 Chapter introduction... 33
3.2 Requirements Engineering... 33
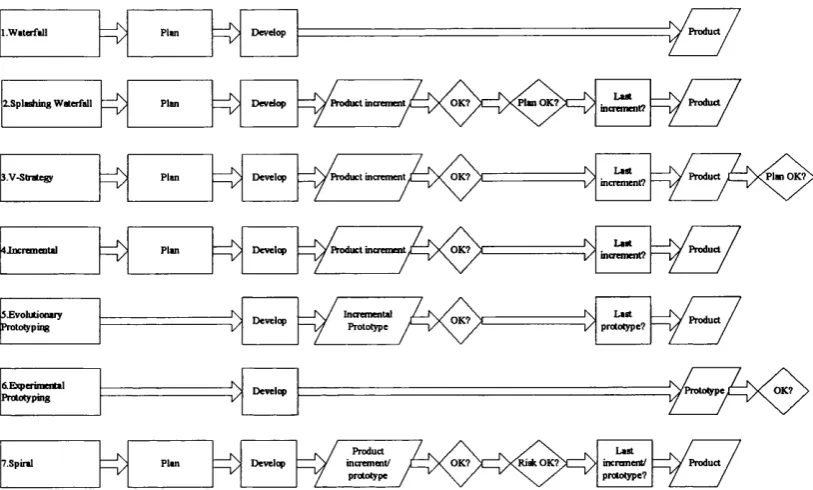
3.3 Traditional methods for software development... 35
3.4 New methods for software development... 36
3.5 The selected development methodology...40
3.6 Chapter summary...43
Chapter 4: Methods for measuring and visualising project performance (current and potential)... 44
4.1 Chapter introduction... 44
4.2 Current method : s-curves... 44
4.3 Current method: Earned Value Analysis...45
4.4 Current method: Completion Cost Analysis...47
4.5 Current method: Performance Indices... 47
4.6 Current method: Project statusing... 48
4.7 Potential method: 3D Information Visualisation... 50
4.8 Chapter summary and contextualisation...52
Chapter 5: A 30 framework for measuring construction planning performance... 54
5.1 Chapter Introduction... 54
5.2 Morphological Frameworks... 54
5.3 Performance deviation parameters and sub-parameters...58
5.4 Chapter summary and contextualisation...61
Chapter 6: Developing the software tool...62
6.1 Chapter introduction... 62
6.2 Using Procession...64
6.3 Procession v1.0: The Visualisation ToolKit C++ libraries...64
6.4 Procession v1.1 and v1.2: The TeeChart ActiveX object with C++...67
6.5 Changes in the visual design of the Procession prototypes from v1.1 to v1.2...69
6.6 User documentation for Procession... 72
6.7 Chapter summary and contextualisation... 72
Chapter 7: Requirements capture and prototype evaluation methodology... 73
7.1 Chapter introduction... 73
7.2 The evaluation methodology...73
7.3 Evaluation hypotheses... 78
7.4 Method for statistical analysis of interviews... 80
7.5 Summary of methodology... 82
7.6 Chapter summary and contextualisation...87
Chapter 8: The live' construction project data s e t...90
8.1 Chapter Introduction... 90
8.2 The 'live' project...91
8.3 Transferring data from Power Project to Microsoft Project... 92
8.4 Assigning costs and producing a baseline...93
8.5 Generating scenarios with Monte-Carlo risk analysis...96
8.6 Results of scenario generation...98
8.7 Traditional performance measurements (s-curves)... 100
8.8 Comparative milestones as shown to RSL Informants: s-curves vs. data surfaces... 109
8.9 Chapter summary and contextualisation... 113
Chapter 9: Results... 114
9.1 Introduction... 114
9.2 Tabulated Results...114
9.3 Results discussed...117
9.4 Hypotheses- detailed results breakdown... 119
9.5 Chapter summary...122
Chapter 10: Future research directions...123
10.1 Chapter introduction... 123
10.2 Artificial Intelligence (Al)... 123
10.4 Adding ‘time’ as a dimension... 125
10.5 Automating morphological analysis... 125
10.6 Chapter summary and contextualisation...126
Chapter 11 : Conclusions...127
11.1 Chapter introduction... 127
11.2 Limitations of research... 129
11.3 Relevant technology rejected as too immature for inclusion at research outset...131
11.4 Scalability and generalisation of research (both in construction and other domains)... 132
References... 134
Appendix 1 : Software development incremental journal notes...142
Appendix 2: C++ code for operational prototype of Procession...148
Appendix 3: Microsoft Project export macro code in Visual Basic for Applications... 163
Appendix 4: Information provided to RSL Informants before experiment... 164
Appendix 5: Client Information Requirement Protocol... 168
Appendix 6: Initial Prototype Usability and Information Evaluation Protocol...172
Appendix 7: Operational Prototype Usability and Information Evaluation Protocol...192
Appendix 8: Results data s e t... 209
Appendix 9: Results value code index... 213
Appendix 10: Initial results and observations after visit 1... 217
Conclusions from assessments of Client Information Requirement Protocol scores...217
Conclusions from assessments of Client Information Requirement Protocol comments... 217
Conclusions from assessments of Initial Prototype Usability and Information Evaluation Protocol scores... 218
Conclusions from assessments of Initial Prototype Usability and Information Evaluation Protocol comments.. 219
Overall observations on the application of methodology... 220
Software changes made for Operational Prototype...221
Appendix 11 ; Article Enter the Virtual Building Site’ in Housingmagazine... 223
Appendix 12: Article Reclaiming the backlands' in B uM ng Homesmagazine...224
Appendix 13: Design layout for Procession's CD label and jewel case... 225
Appendix 14: Draft help file for Procession v1.2 ... 228
Integration with Microsoft Project... 228
Manually exporting files from Microsoft Project to Procession...229
Manually exporting files from other applications to Procession...230
Microsoft Project Macros...230
ODBC, ActiveX and OpenGL set-up issues... 231
TeeChart Active X control...233
Using Procession... 234
Navigation and interface...237
Creating data files by hand... 239
Appendix 15; A contextual discussion of Artificial Intelligence... 242
Appendix 16: Details of Al approaches implemented in Procession v1.0... 246
Appendix 17: Remaining technical issues with Procession operational prototype v1.2... 257
Enclosures:
FIGURES
Figure 3.1 Comparing software development sequences, source: author....36
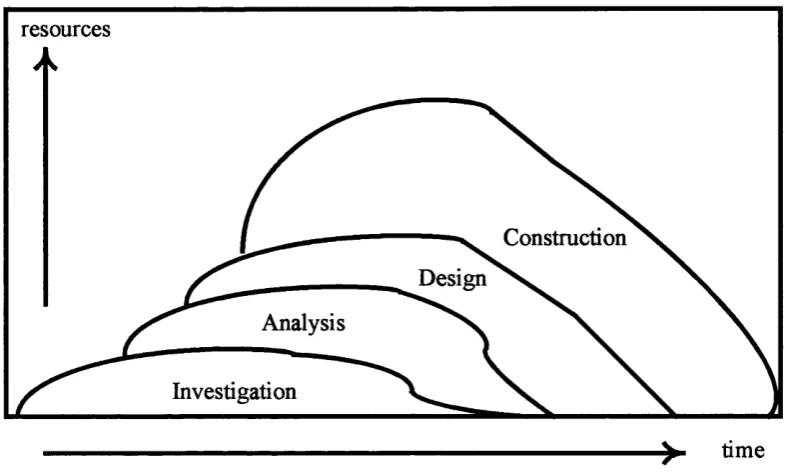
Figure 3.2 Traditional software development, source: Crinnion 1991, p.23 .38 Figure 3.3 Evolutionary software development, source: Crinnion 1991, p.23. ... 39
Figure 3.4 An adaptation of Milton Jenkins’ Evolutionary Development Methodology, source: Crinnion 1991, p.32... 41
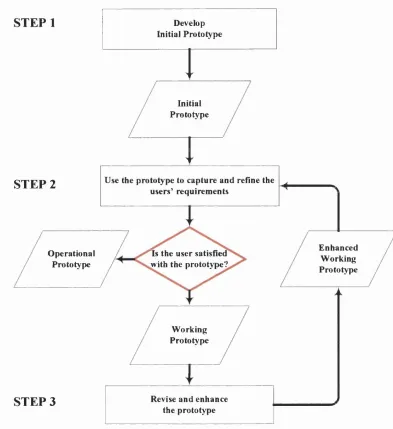
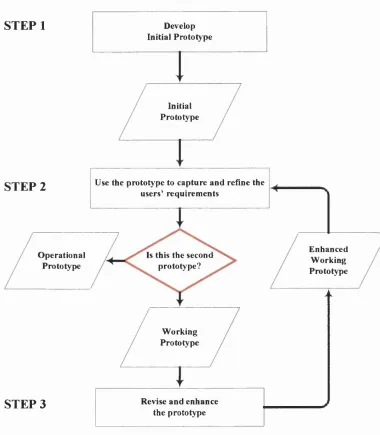
Figure 3.5 Prototyping methodology flow for this research: adapted from Jenkins’ 1985 evolutionary model (Crinnion 1991, p.32), source: author. ... 42
Figure 4.1 BS6079: Earned Value Analysis chart, source: British Standards Institute 2000... 45
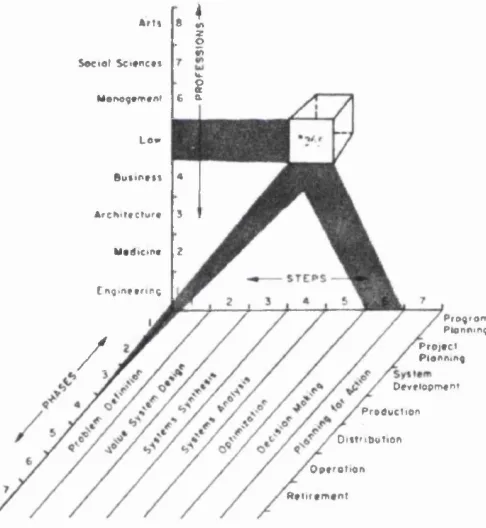
Figure 5.1 An example of a Hall three-dimensional morphological framework, source: Hall 1969... 56
Figure 5.2 A 3D framework for measuring construction planning performance, source: author... 57
Figure 5.3 A 3D framework for measuring construction planning performance (including deviation sub-parameters), source: author... 61
Figure 6.1 An illustrative screenshot of a Procession v1.0 data surface, source: author...67
Figure 6.2 Procession vl.1: example data surface 3, source: author... 71
Figure 6.3 Procession v1.2: example data surface 2, source: author... 71
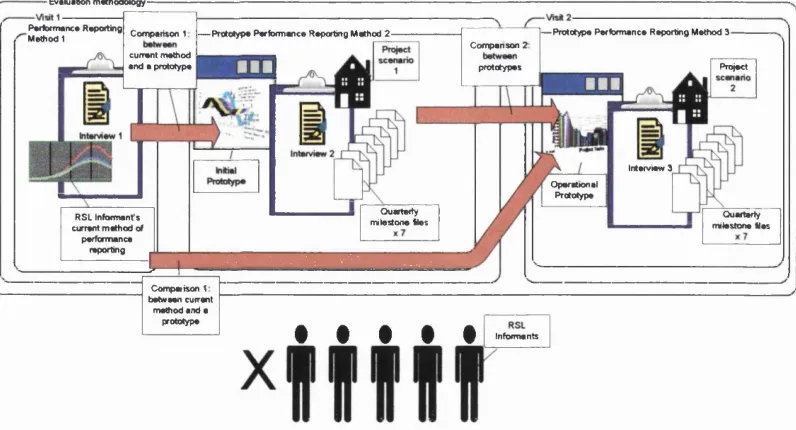
Figure 7.1 Diagram of Evaluation Methodology, source: author...74
Figure 8.1 Location of Moorlands Estate project in South London, source: Mapquest.com/Navigation Technologies B.V... 91
Figure 8.2 ‘Live’ project summary tasks and their scheduled durations before commencement, source: author...94
Figure 8.3 Pricing the 'live' project, source: author...95
Figure 8.4 ‘Live’ project summary task budgets before commencement, source: author...96
Figure 8.5 Scenario 1: At completion s-curve for entire project, source: author... 103
Figure 8.6 Scenario 2: At completion s-curve for entire project,... 104
Figure 8.7 Scenario 1: Cost and Schedule indices s-curve for entire project, source: author...105
Figure 8.8 Scenario 2: Cost and Schedule indices s-curve for entire project, 106 Figure 8.9 Scenario 1: Earned Value s-curve for entire project, source: author... 107
Figure 8.10 Scenario 2: Earned Value s-curve for entire project,...108 Figure 8.11 Scenario 1: Earned Value s-curve at milestone 4 (top) as
compared to Procession Initial Prototype vl.1 data surface (bottom), source: author... I l l Figure 8.12 Scenario 2: Earned Value s-curve at milestone 4 (top) as
(bottom) - surface has been ‘mouse-clicked’ at arrow, source: author. 112 Figure 9.1 Results of left-tailed t-tests showing null hypotheses rejected with
a significance level of 95%, source: author... 116
Figure 9.2 Results of non-directional correlation test showing null hypothesis rejected with a significance level of 95%, source: author...116
Figure 9.3 Correlation scatterplot for hypothesis 6, source: author 117 Figure 9.4 Results for RSL Informants’ ability to assess project status, with a significance level of 95%, source: author... 119
Figure 0.1 Procession CD label design, source: author... 225
Figure 0.2 Procession CD jewel box back cover design, source: author. . .226
Figure 0.3 Procession CD jewel box front and inside cover design, source: author...227
Figure 0.4 ODBC data source administrator in Microsoft Windows, source: author...232
Figure 0.5 ODBC data source administrator in Microsoft Windows: User DSN tab, source: author... 233
Figure 0.6 Opening a local file with Procession (stage 1), source: author. .235 Figure 0.7 Opening a local file with Procession (stage 2), source: author. .236 Figure 0.8 Procession's FTP control panel, source: author...237
Figure 0.9 Procession's 3D navigation panel, source: author... 238
Figure 0.10 Procession's 3D position panel, source: author... 239
Figure 0.11 Example data in Microsoft Excel, source: author... 240
Figure 0.12 Procession vl.O’s symbolic internal data-flow for calculating the significance of deviance and ‘learning’, source: author... 247
Figure 0.13 Procession vl.O’s Significance of Deviance Algorithm, source: author...248
Figure 0.14 Example values for two deviation parameters, source: author.249 Figure 0.15 Expected Deviance calculation, source: author... 250
Figure 0.16 Significance of Deviance calculation, source: author... 251
Figure 0.17 Legacy Archive weighting calculation version 1, source: author. ... 254
Acknowledgements
Alan Penn for academic and organisational support.
Arthur, Beth, Kim, Lucy and Sarah North for familiar understanding.
Derek Elsley at United House Construction for helping to locate live project data.
Prof. Graham M. Winch for his ideas, supervision and support.
Dr Ruth Conroy Dalton for doctoral sympathy.
Dr. Ihsan Faraj at Building Research Establishment for help in connection with the WISPER project.
Eileen Stewart for being endlessly perfect.
Mary Rawes for dog-sitting and making it possible.
NIHHA (New Islington and Hackney Housing Association) for evaluating the Procession software tool.
okupi Ltd for 3DA/irtual Environments inspiration and allowing me to work flexibly during the initial years.
Philip Pamment at SLD (South London Design) for helping to locate live project data.
Professor Anthony Finkelstein for advice and feedback on requirements capture, software evaluation and development.
Professor Mustafa Alshawi at the University of Salford for help in connection with the WISPER project.
Sem and Goblin (RIP) for helping as only canines can.
Sheep (aka Nick Conroy Dalton) for having ‘computer guru’ status.
Southern Housing Group for evaluating the Procession software tool.
This work was supported by a UK Office of Science & Technology Foresight Challenge Award. The Virtual Reality Centre For The Built Environment is an
Chapter 1: Introduction
“Good design can only emerge if there is a deep understanding of the real needs of the client. Ignore those needs or spend too little time in coming to terms with them and the result will be a building that fails to satisfy." (Construct IT Centre of Excellence 1996, p.6)
The client’s role is central to construction. However, this is not always
reflected in the availability of software tools for them to participate in the
project. When clients remain ignorant of a project’s day-to-day performance,
the surprise of an unexpected negative outcome (in terms of delays and cost
overruns) can be very alarming. Winch et al. suggest that putting “the
minimisation of client surprise at the heart of the assessment of project
success’’ (1998) would help to reinforce the client’s role as the key member
of the project. Winch et al. have gone on to propose that ‘gap analysis’, a
service quality management concept, is readily applicable to the study of
project performance. They define these ‘gaps’ as spaces between “the
service that consumers expected that they were going to get, and their
perception of what they actually got” (1998).
This research proposes that ‘gaps’, client ignorance and resulting
surprise can be minimised by providing summarised project performance
reports. These can be made available to clients remotely (via the Internet)
and at a time of their choosing. The software tool presented in this thesis
offers clients a simple 3D visualisation of project performance, in the form of
a data surface. Existing project performance measurement tools (for example
the s-curve) are not specifically intended for client use. The quantitative
values that existing tools provide are the same ones used here for the 3D
tool (basically variances in cost and time). However, accurate interpretation
of s-curves is not intuitive for the amateur. There are no obvious graph peaks
to indicate problems. Several curves must be compared to obtain
performance measurements. In contrast, the 3D tool proposed here improves
techniques describe all tasks simultaneously. Such techniques report the
performance of the entire project. Therefore, it is not possible to identify
specific project tasks that are the cause of any underperformance. It is true
that individual s-curves can be produced for each task, but this then results in
multiple information views, or sheets of paper. Adding a third dimension,
allows all of the tasks (or at least the summary ones) to be represented in
one view. Combining this with reporting by exception means that even a
client unfamiliar with performance measuring techniques, can instantly
identify problematic tasks.
This thesis will now introduce a clear set of research aims and
objectives, which will be revisited in the conclusions. These are as follows:
Aim:
• To investigate whether 3D Information Visualisation can provide
construction clients with informative performance reports.
Objectives:
• To develop a conceptual 3D framework that decomposes construction
project performance into axial dimensions.
• To develop a software tool for construction clients that implements the
conceptual 3D framework.
• To develop and apply a protocol for evaluating the developed software
tool.
With this underlying structure in place, the actual research sequence
will now be described. This will first be introduced in chronological order and
then represented in terms of the chapter structure i.e. where to find each step
documented. The first element of the research was a review of current
availability (or not) of software for construction clients to obtain project
performance reports.
Next, a requirements capture methodology was required, to ensure
the appropriateness of the developed software. It was decided to focus on a
sub-group of construction clients, those who work with social housing. This
will be discussed in more detail later in this chapter. The Researcher’s own
experiences of working within this client sub-group, coupled with initial
feedback from potential research subjects, suggested that they would prove
technically inexperienced. Therefore, a requirements capture and
development methodology was selected that allowed for them to be shown
an initial prototype. If was decided that without this prototype example, the
subjects might not be able to fully appreciate the potential of an Information
Visualisation reporting tool. The chosen prototyping methodology was only
arrived at after a review of the requirements engineering field and differing
approaches to prototyping. Evaluation of the software prototypes was
achieved through the statistical analysis of three questionnaires.
The evaluation methodology and the initial prototype had to be
developed in advance of the first evaluation visit to the subjects. This meant
that certain decisions had to be made, that might prove hard to reverse at a
later stage in the research. The first of these decisions was the assumption
that construction clients were familiar with and regularly used performance
measurement techniques, such as the s-curve. This seemed a reasonable
conclusion, given the inclusion of these techniques in standard textbooks and
literature. When contact was first made with the subjects, the Researcher
informally enquired as to any professional training that they had undertaken.
Those subjects who had attended university, indicated at least a theoretical
familiarity with performance measurement techniques. Evaluation of the
prototypes partially depended on the subjects being familiar with s-curves, in
order to provide a basis for comparison with the Information Visualisation
data surfaces. Therefore, there was potential for the results to be adversely
this eventuality, the Researcher gave each subject an introduction to s-curve
techniques (see Appendix 4).
A second assumption was that different types of construction client
are equally interested in all of the possible performance deviation parameters
(time, cost and quality). The implication of this was that the initial software
prototype needed to implement and visualise all of the performance
parameters. In the initial prototype, the chosen dimensions for the conceptual
3D visualisation space reflected this need to represent all of the parameters.
However, the first visit questionnaires were designed to allow feedback from
the subjects. This allowed modification of the parameters visualised in the
operational (or second) prototype.
Research revealed that the construction industry already had project
performance measurement techniques. Some of these made use of
two-dimensional graphics. It was necessary to consider the applicability of these
techniques to the proposed Information Visualisation tool. It was important to
consider whether greater project insight could actually be provided by a third
visual dimension. Great importance was placed on the extra visual dimension
adding value to the existing two-dimensional performance graphic, for
example the s-curve.
As 3D Information Visualisation was being proposed as a solution for
a client software tool, an introduction to this field was prepared. Having
considered existing project performance measurement techniques,
morphological analysis was used to develop a new conceptual 3D
framework. Morphological analysis allows a system, or problem, to have its
fundamental constituents identified and represented in a conceptual space.
Using this method, the elements of construction project performance were
decomposed into axial dimensions.
Once the initial software prototype had been developed, the
Researcher visited the subjects. Before showing the subject the first
prototype, a five-point scale interview was undertaken to capture the
fictional project scenario was shown to the subject in the form of a single 2D
s-curve. The project was punctuated by seven milestones separated by
quarterly (three monthly) intervals. The subject was asked to assess the
project status at milestone four. The accuracy of this assessment was later
scored on a five-point scale. After completion, the same scenario was
repeated using the prototype at each milestone. At milestone four, the
subject was again asked to assess project status. Immediately after the
second run through the scenario, questions were asked about the
information and usability of the software. The results of this first visit were
collated and the outcomes applied to the development of a second prototype.
On a second visit to each subject, a different fictional scenario was used to
evaluate the second (operational) prototype.
With the research sequence described, this introduction will now detail
how this process is documented on a chapter-by-chapter basis. Chapter 2
provides a contextual overview of current thought and literature in the areas
of construction software, interoperability, standards and construction process
modelling.
As stated, the research documented in this thesis is intended to
investigate techniques for providing a reliable source of project performance
information to the construction client. Specific focus will be on clients who are
building (or renovating) social housing. The current term applied to such
clients is Registered Social Landlords (RSLs). At an early stage in this
research, it was observed that many construction software projects seem
over-focused on the detail of the enabling technologies. However, they fall
down when it comes to identifying a genuine requirement for the product and
then evaluating it against that need. With this in mind, it was decided that a
significant element in the contribution to knowledge should be a protocol for
prototyping and evaluating the developed software. Chapter 3 investigates
current thinking in the field of Software Requirements Engineering and
Humans are good at interpreting visual representations. Many
disciplines have made use of this for the interpretation of mathematical and
statistical data. This often entails physically visualising data sets that may be
intrinsically multidimensional. The construction industry traditionally uses 2D s-curve type visualisations to analyse project performance. Chapter 4
describes the various analytical methods currently available and then briefly
introduces the field of 3D Information Visualisation as a route to more
informative performance reporting.
While the construction industry does use 2D graphing techniques to
view information, little or no thought seems to have been given to more
conceptual frameworks for representing its processes. Researchers, in non
construction fields, have suggested the application of theoretical dimensions
to assist in the morphological analysis of complex data. In Chapter 5, a 3D
morphological framework for visualising construction performance is
proposed.
The software tool developed as a deliverable for this research is called
‘Procession’. This name reflects its ability to report on the performance of a
linear sequence of (sometimes concurrent) construction tasks. Building
further on the prototyping methodology selected in Chapter 3, Chapter 6
documents the technologies underlying the three Procession prototypes
(v.1.0, v1.1 and v1.2). In order to answer the question, “can 3D Information
Visualisation provide construction clients with informative performance
reports?”, a number of hypotheses and a correlation check were formulated.
Evaluating the software prototypes required a protocol and a data set.
Chapter 7 details the theoretical process of obtaining example data from a
real construction project, presenting the software prototypes to RSL
Informants (this term is used from now on for individual subjects employed by
an RSL) and capturing their requirements with interviews. Also documented
are the statistical techniques used to calculate the significance of the
Chapter 8 describes the specific case of applying Chapter 7's
methodology to the ‘live’ project data obtained for this research. As the data
set contained only pre-construction baseline values, risk analysis software
was used to predict likely problem areas during execution. The evaluation
methodology required that two prototypes be produced and presented to
RSL Informants, on two separate occasions. To avoid the subject becoming
familiar with the program sequence of the example data, two separate
scenarios were generated, based on the results of risk analysis. After the
evaluation of the first prototype, it was possible to collate and consider RSL
Informants’ requirements for the operational version. Chapter 9 presents the
final results, after the second visit to the RSL Informants. The hypothetical
outcomes and their statistical significance are recorded.
Chapter 10 describes possible future research directions identified
during the course of this study. Chapter 11 reviews the results of this
Chapter 2: Research context and scope
2.1 Chapter introduction
The introductory chapter described the problem that provided the
focus for this research and then presented the methodologies used to
address it. The research problem is: “can 3D Information Visualisation
provide construction clients with informative performance reports?”. The
purpose of this chapter is to provide context and boundaries for an otherwise
open-ended question.
First of all, it is necessary to specify the nature of the information that
is being reported to the client. For this purpose, some clarification of the
terms product, process and performance is provided. It is then necessary for the reader to have an introduction to current practice in construction industry
Information and Communication Technology (ICT). This includes any
standards that might be applicable to the software tool Procession and the
means by which existing applications communicate and exchange
information. When considering ICT solutions, the availability of existing
software for construction clients is of interest. Also relevant is the nature of
the information that any such tools provide to clients and the reporting
method (text-based, graphical, etc.) that they use.
With overall context provided, this chapter will then provide some
tighter boundaries for the development and evaluation of Procession. For
example, it was decided to focus on a sub-set of all construction clients and
this group are introduced. In addition, reporting to clients was limited to one
phase in the construction project lifecycle. In the light of Section 2.3,
technical decisions were made about the source for Procession's
information.
With a clear scope for the research having been established at this
stage in the thesis, later chapters will further explore the methodologies used
2.2 What information is being visualised (the distinction between
construction product, process and performance)?
It is important to understand the nature of the information being
visualised by the Procession tool. The term used here for the source data is
construction project ‘performance’ information. If should be noted that this is
distinct from ‘technical performance’ information, a term sometimes used in
the construction industry to describe the behaviour of building components or
structures. Performance in the context of this thesis refers to the success or
failure of a project, in relation to planned cost and schedule. It is common
practice in project management to view a project in two ways. The physical
components that contribute to the final product are described as the Product
Breakdown Structure (PBS). The activities or tasks that constitute the
process of building the product are known as the Work Breakdown Structure
(WBS). Another way to express this is that PBS=product and WBS=process.
Performance can be thought of as how well the process delivers the product,
or to express it more formally:
Project performance is a quantitative measure of the processes’ (WBS-Work Breakdown Structure) actual delivery of the product (PBS-Product Breakdown Structure) relative to a planned project baseline.
The performance measurement parameters are time, cost and quality.
Measurement of quality is more complex and subjective than for the more
quantitative parameters of time and cost. Initial developments of the
2.3 An overview of current construction software
This section provides an overview of construction software. The
intention is to provide context for the proposed 3D visualisation tool. Winch
(2002, p.345) describes Information Communications Technology (ICT) tools
for construction as falling into two categories. Firstly, there are Engineering
Information Management Systems (EIMS), which deal with the tools used to
create and manipulate construction product data (for example, architectural
CAD, etc.). Secondly, there are Enterprise Resource Management Systems
(ERMS), which is a catchall name for systems that manage the process data
surrounding a project (for example, payroll, document management, etc.).
Winch (2002) goes on to propose a third sub-category. Project
Management Information Systems (PMIS). This sub-category intersects with
both EIMS and ERMS and includes project planning tools. Examples of
popular project planning tools include: Microsoft Project, PowerProject,
Pertmaster and Primavera (Heesom & Mahdjoubi 2001 ). The tool that was
developed for this research requires performance data. Information of this
type is generated by project planning software. PMIS are not purely product
(EIMS) related, nor do they only relate to process (ERMS). For example,
project planning tools (as components of PMIS) are concerned with the
sequencing of product ‘on site' (utilising EIMS components) but are
fundamentally describing the construction process (in the ERMS domain).
EIMS can be seen as frameworks for the software tools in a project
that actually create data relating to product. The individual elements of an
EIMS are called Engineering Information Creation Systems (EICS). Each
element represents a specific project profession and the tools that they use.
The primary EICS in an EIMS is likely to be the architect and the architect’s
Computer Aided Design (CAD) application, for example AutoCAD.
Secondary EICS might include a Structural Engineer with a Finite Element
Analysis (FEA) tool, or the architect’s Ray Tracing or Virtual Reality
EIMS is the ‘glue’ that holds its constituent EICS elements together
and allows them to share information. The manner in which data is
exchanged by EICS elements within an EIMS, can be anything from high
level interoperability to a primitive so-called ‘sneaker net’ (i.e. walking over to
a colleague’s desk and exchanging CDs, floppy disks or print-outs). The
applications within ERMS focus on tasks such as payroll, estimation,
accounting and the exchange of documents relating to the project. ERMS
can be considered one instance of Enterprise Resource Planning Systems
(ERRS), sometimes also known as Enterprise Systems. Whereas Enterprise
systems are designed to automate the flow of information with a company,
ERMS provide similar tools on a project-specific basis.
Enterprise Systems tend to be concerned with unifying a single
organisation. The most well known commercial implementation of an
Enterprise System is SAP (Systems, Applications and Products). SAP
provides an integrated package of business applications and is widely used
in the oil, chemical and hi-tech industries. The SAP package for construction
is known as SAP E&C and it features sub-applications such as: business
planning, budgeting and contract verification (SAP 2003). The main
drawback with SAP would seem to be high set-up costs and its reliance on
proprietary applications.
As previously mentioned, CAD often forms the primary EICS element
in an EIMS. A recent report on construction industry ICT in the US noted that
one of the particular features of architectural design development which
constantly provokes discussion, “is the use of apparently visual-only
methods- notably drawing- when the phenomena under investigation may be
only partly determined by appearance or other visual considerations” (Gann
et al. 1996, p.12 ). At several points in this chapter it is noted that the
architectural (or CAD) view tends to dominate construction ICT, both in terms
of interoperability and standards.
Architectural CAD (particularly when it is 3D) is often referred to as
term ‘Architectural Visualisation’. This differs from the intended meaning of
3D Information Visualisation, as used in this thesis. In fact, one recent paper
uses Information Visualisation to describe advanced CAD (Aouad et al.
2000). This usage seems contrary to definitions commonly provided by
practitioners in the visualisation field. Information Visualisation is widely
described as relating to ‘abstract’ and ‘non-physical’ data sets (see Chapter 4
and Strothotte 1998). As such, CAD may be visualisation but it does not
meet the criteria for Information Visualisation.
When time is added to 3D CAD, this is often referred to as 4D
CAD-X,Y,Z and time (Mckinney et al. 1996, pp.383-389 and Mckinney & Fischer
1998, pp. 433-447). For example, in his 1997 paper ‘Visualisation
Technologies’ Fischer states that CIFE’s (Center for Integrated Facilities
Engineering) 4D CAD system “captures space and time and puts them into
one common model” (Construct IT Centre of Excellence 1997b, p.80). At its
most basic level, 4D CAD allows evaluation of changes to the project
schedule. When started, the 3D model builds itself in accordance with the
planned programme. Other uses for 4D CAD include; spatial conflict
resolution on building sites (North & Winch 2002), plant movement rehearsal
and fire spread simulation (Mckinney & Fischer 1998).
The pace of technological change is likely to add new software types
to those previously identified. Here are several examples:
• VR immersion techniques such as VR_Systems ‘sphere’ (1998). This is a
ball with 360 degree projection on all its internal surfaces. A single user
enters the sphere through a door and can then ‘walk’ inside the VR
projection. The sphere actually rotates in response to the users walking
motion, changing the projected view accordingly.
• Augmented reality- the superimposing of a VR image onto a real object.
For instance, an engineer working on-site’ could view the plans of an
electrical installation overlaying the actual wiring.
• 3D scanning and reality acquisition of architectural components and site
technology is rapidly becoming smaller and cheaper. It seems likely that
its use will become more common.
• Tele-robotics: radio-controlled robots equipped with cameras can be used
for site overviews/aerial observation, removal of dangerous contaminants,
tunnelling etc..
It is now useful to discuss the type of report to be provided by
Procession. Construction performance reports are currently generated by
components of PMIS, such as Microsoft Project. Such reports often use
existing performance measurement techniques, such as Earned Value
Analysis s-curves (see Chapter 4). The reports may also take the form of a
written document, describing performance and progress. Reports
(particularly s-curves) are frequently intended only for the use of project
managers but may also be circulated to the entire project coalition, including
the client.
Tools specifically for construction clients are thin on the ground. The
few examples that do exist are remote interfaces to a project planning tool, or
commercial PMIS. For example. Spider is a Web-based tool that works with
the planning application Open Plan (Welcome 2002). Such tools will often
allow the client to assess project performance by allowing access to the
current status of the planned programme. However, where such client
interfaces are found, they differ from Procession as follows:
• The view is not designed specifically for the client and may be over
complex.
• They do not use 3D Information Visualisation.
• They do not usually provide a summary of performance.
• They do not report by exception allowing ‘at-a-glance’ statusing.
Tools for construction clients might be described as Decision Support
Systems. One definition of a Decision Support System for construction is a
system that can “aid in the understanding of building construction and
(Gann et al. 1996, p.5). Writing in Information Technology Decision Support in the Construction Industry: Current Developments and Use in the United States, Gann et al observe that:
“Emerging construction processes utilising IT-based decision support systems are quite different in character from conventional approaches, for example:
c) they facilitate a new notion of client/user involvement in the total construction process. Clients can be brought closer to the total process, whereas hitherto they tended only to be involved in specific aspects of design briefing and specification. The transformation in
client/designer/constructor relationship is made possible in part by a number of technologies providing visualisation, auralisation, Virtual Reality visualisations and other realisations- not just to display ideas and proposals, but actually to enable clients and designers to think about them in fundamentally different ways." (Gann et al. 1996, p.9)
It is possible to conclude that there is very little, if anything, currently
available specifically for the client.
2.4 Modelling, communicating and sharing construction information
The software developed for this research is dependent on information
from existing construction software tools. As such, it is important to consider
the current status of technologies that enable communication and data
sharing within the construction industry. The primary motivation for this was
the identification of potential standards or architectures that might have
provided an interface for Procession.
The first area of consideration is ‘modelling’ in the construction industry.
This term describes a variety of related but not identical approaches. Process
Modelling provides an array of tools and techniques for analysing activities
within the project life-cycle (Karsila et al. 2000, pp. 179-186). The most basic
techniques available are generic process mapping tools, providing little more
than a library of symbols and graphic functionality. These are often used to
modelled at many different scales (or levels of granularity) and from many
perspectives.
One of the most influential activities in the area of process modelling is
the attempt to provide a generic chart of the relationships within all projects.
The University of Salford's GDCPP (Generic Design and Construction
Process Protocol) Group have attempted this with their Process Protocol
Map (Kagioglou et al. 1998 and Fleming & Cooper 2000, pp. 187-192). This is
a widely adopted attempt to analyse and model construction processes,
throughout the project life-cycle. Some of the phases in the map can be
conducted concurrently. This is signified by the use of ‘hard’ and ‘soft’ gates.
Phases can only overlap temporally, if they are joined by a soft gate.
In addition to the generic approach, process modelling can also be
applied to specific projects. The performance of a project is directly related to
the performance of its participants. As projects increase in size, stakeholders
may increasingly need evaluation criteria and indicators for application both
to themselves and other project actors. Kumaraswamy et al. suggest the use
of flow charting to select participants for future projects, based on their past
performance (1996a, pp.34-39). Baldwin et al. propose the use of data flow
diagrams to provide a better understanding of information flow between
project actors during a project’s design phase (1999, pp. 155-167). The IBS
(Integrated Engineering Solutions) Project uses a single graphical model to
describe all stages of the design, construction and lifetime use of the building
(Construct IT Centre of Excellence 1997a, p.61).
While process modelling has inevitable crossover with Procession (the
use of graphics etc.), it does not provide any techniques that are directly
applicable. Procession reports on the performance of processes, not the network of processes themselves (whether generic or project-specific).
Another branch of construction modelling is potentially more relevant. This is
known as Information Modelling, although it may sometimes be grouped
under the process-modelling banner. Information modelling attempts to
The models in themselves are not a file format, but they offer the potential for
software interoperability by creating a common view of the project.
Information models usually consist of text or graphical representations of
individual elements, their properties, functionality (methods) and
relationships. For example, an object such as a brick has size, weight,
colour, material etc. Having this single view of project elements allows the
simple creation of computing interfaces that conform to this agreed model.
The most well-known information model for construction has been
developed under the general banner of ISO (International Standards
Organisation) standard 10303 STEP (STandard for the Exchange of Product
model data). STEP covers the exchange of data between software
applications in many major industries including manufacturing and
construction.
“The intention is to create a single ISO standard that enables the capture of information needed to represent a computerised product model in a neutral form throughout the lifecycle of the product without loss of completeness or integrity.” (Gann et al. 1996, p.92)
ISO 10303 provides a neutral mechanism capable of describing
product data throughout the life cycle of that product. It is independent from
any particular software application or computer platform. The format of the
product description is suitable for neutral file exchange and also as a basis
for implementing product databases or data archiving. STEP consists of
many individually documented 'parts'. Each of these parts is referenced
using the STEP prefix, followed by a unique part number. For example, part
11 (ISO 10303-11 ) describes the modelling language EXPRESS, which itself
is used to write all of the other parts. STEP parts 40-49 (ISO 10303-40 to
ISO 10303-49) are known as Integrated Resources. These provide the
generic building blocks to describe any product. Part 49 describes processes
and therefore provides a foundation for any product model capable of
containing associated activity planning data. Parts 40-49 are never directly
Application Protocols (APs). These are product models for a particular
industry and have the part numbers 201-209 (ISO 201 to ISO
10303-209). It should be noted that this is sometimes written as AP201-AP209.
AP225 (ISO 10303-225) defines structural building elements in the
construction industry. AP225 includes process functionality through its
inclusion of Integrated Resource part 49 (as mentioned earlier).
AP225 has undergone many drafts, revisions and extensions since its
first incarnation in the 1990s. Ultimately, though its success still seems
dependent on adoption by the major construction software companies (Haas
2000, pp.25-31). Implementation of each industry specific Application
Protocol (including construction’s AP225) is provided by STEP parts 22-26
(ISO 10303-22 to ISO 10303-26). These parts include programming
interfaces (for example, SDAI part 22) and the widely adopted part 21 (ISO
10303-21), a text-based, physical file format.
A complementary product information model for construction is
provided by the lAI (International Alliance for Interoperability), a US group
that launched its UK chapter in 1996. Its intention is to define a common way
in which construction project objects are written and their attributes defined.
The lAI calls its model Industry Foundation Classes (IPGs). IPGs are based
on STEP AP225 and implemented using EXPRESS, although XML has
recently been offered as an alternative modelling language. The file format
offered by STEP part 21 has also been used in IPGs. There are now minor
differences between the construction product model as originally represented
in AP225 and the IPG model. There have been recent attempts by the two
committees to address these differences and unify IPGs with AP225. The
ability to model scheduled tasks is included in IPGs. This builds on the STEP
part 49 resource found in AP225. The IfcGontrolExtension schema in the IPG
core layer declares basic classes for project resources, tasks, allocations and
milestones.
Autodesk (makers of the industry standard AutoCAD software) is a
writing software that will utilise IFCs. The UK chapter of the lAI includes
members such as: BAA, Lloyds, Ove-Arup, BDP, WS Atkins, Taylor
Woodrow and Kvaemer. lAI also develops CAD standards in conjunction with
the Construction Round Table, BAA, British Airways and Smith Kline
Beecham. Despite this impressive list of contributors, Gann et al comment
that, "IAI must define scope and practical working methods if it is to stand a
chance of succeeding” (1996, p. 17). One of the findings of Gann et al’s US
study was that non-Architectural project actors (for example engineers) are
concerned that the lAI is leaning towards a reliance on CAD as a model:
“The need for a neutral format was stressed so as not to lock information in
to proprietary CAD standards” (1996, p.24).
A third model is UNICLASS (UNIfied CLASSification for the
construction industry), which is intended for organising library materials and
for structuring product literature and project information (Building Project
Information Committee 1998). It consists of fifteen tables, each of which
represents a different facet of construction information. Each table can be
used on its own to classify a particular type of information. Terms from
different tables can also be combined to classify complex subjects.
All three standards have in common a reliance on an architectural
view of the project, rather than that of (say) a structural engineer, project
manager or client. Where processes are included in the model, they are
frequently represented as adjuncts to products. The product, rather than the
task, is predominantly used as the fundamental unit. Gann et al noted that,
“we have poor methods of representing construction processes, so that
architects perforce rely extensively on visual representation as a means of
maintaining a holistic project “ (Gann et al 1996, p. 13). STEP and similar
data models may be seen as the potential ‘glue’ which may one day hold
Engineering Information Management Systems (EIMS) together (see Section
2.3).
In relation to the development of the Procession tool, the key
describe performance. STEP, IFCs and UNICLASS all provide some level of
support for processes (even if it is just a basic WBS). However, they do not
yet consider the cost and time requirements of tasks and so performance
measurement is excluded from the models. As such, while their introduction
provides relevant context, none of these standards offer potential for
interfacing Procession to other construction software.
In addition to work on standards such as STEP, another popular area
of research in construction ICT are Integrated Project Databases (IPDBs).
Sometimes IPDBs are referred to by other names. For example, ‘the single
project database' is a favourite. Amor and Faraj (2001 ) describe the many
different ideas that constitute IPDBs and conclude that the construction
industry is still a long way from achieving true interoperability. Amongst the
IPDB variants documented are: a 3D CAD model acting as a gateway to
project information, a centralised database for all project participants, a
distributed project database using a standard programming interface (for
example CORBA- see Object Management Group 2003), a STEP type
information model and proprietary examples, such as Bentley’s ProjectBank
(Bentley 2002). Amor and Faraj suggest that IPDBs are not currently viable
for several reasons. They argue that Object-oriented ( 0 0 ) approaches such
as STEP, IFC etc. are not well suited to representing large systems. Amor
and Faraj also conclude that ‘real world’ construction is not 0 0 in the sense
used by computer science. Notions such as property inheritance within object
classes are virtually non-existent in real-world building components.
Amor and Faraj (2001 ) support an opinion frequently revisited in this
chapter, that CAD is often assumed to be the default view for determining
information models and database structure. Many researchers working with
IPDBs seem to assume that the views of different project participants are
reconcilable. This is reflected in the prevalence of CAD and product
dominated standards and system prototypes.
It is useful to reflect upon whether interoperability and IPDBs are
to offer a client any meaningful overview of current status. Clients
(experienced or otherwise) seem unlikely to require the detailed information
that would be provided by software tools designed for individuals actively
involved in specific project area, such as the architect or project manager.
Instead, it is extremely plausible that what clients really require is a simple,
user-friendly software application that offers the client a ‘window* on the
project. The client may not actually care whether the data for a performance
report is sourced from a stand-alone application, such as Microsoft Project,
or an IPDB. However, even without directly using standards such as STEP,
Procession is capable of working with either source.
For example, the project now detailed uses a STEP/IFC product
model on the server, but still provides a Web-based interface compatible with
Procession. In this example, server-side programming converts planning
data from the IFC model into CSV (Comma Separated Value) format. The
CSV data is returned in response to HTTP requests from a browser. The
University of Salford's Automation and Integration in Construction (AlC)
Research Group’s PIT/WISPER Project (Faraj et al. 1998a) project was
sponsored by the DETR under reference 39/3/336(CC1109) and led by John
Laing, W.S. Atkins, Matthew Hall Ltd, and J. Wix Consultants. The name of
the project was initially PIT but later changed to WISPER (Web-based IFC
Shared Project EnviRonment). This is an Internet-based STEP/IFC project
that utilises a three-tier client/server design, providing interfaces to VRML,
Microsoft Excel and Microsoft Project. The lowest tier of this architecture
consists of the project database. This is a single project database, as
opposed to a distributed source. In a paper that describes WISPER (Faraj et
al. 1998b), the AlC Group do not discuss the potential for distributing the
data repositories and so it is assumed that this is not a possibility with this
implementation. The significance of this is that it remains unclear as to the
proposed location for such an architecture. Who would house and maintain
the server? Is it suggested that there should be a new actor whose role is the
many concurrent projects. It is possible that data storage space could be
purchased on a project-specific basis. There are certainly issues of trust and
security to be considered. WISPER is described as allowing restrictions to
be placed on levels of access and permissions to modify.
The second tier of the architecture contains a standard web-server,
augmented with CORBA to handle information requests over the Internet.
Both the first and second tiers are server-side. Project actors interact with the
project database through a World Wide Web browser, the third tier.
Architectural drawings, project plans etc. can be set-up and remotely
modified over the Internet. In addition to browser interaction, certain
common formats (Microsoft Excel and Project, for example) can be
requested as downloadable files. This is the interface level that provides
access for Procession to Microsoft Project data.
Having discussed potential architectures for interfacing Procession,
the next section will move from context to scope. This will start by
introducing the sub-group of construction clients who will be the target for
evaluating the software.
2.5 Social housing and the Registered Social Landlord (RSL)
A simple definition of Social Housing (SH) might be that it is housing
built and/or maintained by state funds. An SH construction client is likely to
be one of the following; either a local authority (LA or local council) or a
Registered Social Landlord (RSL), which is the new catchall term for
registered Housing Associations, Housing Co-operatives and Local Housing
Companies. There are several factors that make RSLs unique:
• They are experienced clients usually with ‘in-house’ development
expertise.
• The nature of public grant funding (coupled with an increasing reliance
on private finance) has several
o It often greatly increases the lead-in time from feasibility to
grant confirmation (sometimes to years),
o It places specific restrictions in terms of project time-scale and
component standards that often far exceed statutory
requirements.
o Many of the projects will be ‘new build’ from an ‘off the shelf
design tried and proved many times in the past.
From the software perspective, it seems likely that many RSLs (or at
least their Employer's Agents) will be familiar with the popular low-end
software packages for project management (Microsoft Project, for example).
2.6 Focus of the research
In order to provide some boundaries for the development of
Procession and its subsequent evaluation, several constraints were imposed:
• The client group (subject population for evaluation) was limited to
RSLs (see Section 2.5).
• Procession only reports performance during the ‘on-site’ phase of the
project (i.e. Salford Process Protocol Map, Phase 8). This is the stage
of the project when, anecdotal evidence suggests, clients need the
most information but receive the least. It is possible that project actors
understand a client’s need for information during the pre-project and
pre-construction phases, but assume that once most of the key
• The source for Procession’s information will be Microsoft Project. This
is because it is claimed to be one of the two most popular project
management packages in the construction industry (Meridith and
Mantel 1995, p.469, Knight and Kaka 1998, p.289), with a worldwide
user base of approximately five million (Heesom & Mahdjoubi 2001,
p.28). In addition, STEP/IFC projects are starting to provide interfaces
2.7 Chapter summary and contextualisation
This chapter has identified the subject of Procession's client reports as
project ‘performance’ data. Project performance was described as a
quantitative measure of the processes’ actual delivery of the product relative
to a planned project baseline. The parameters of performance to be included
in Procession’s visual reports were presented as ‘time’ and ‘cost’.
The current state of ICT in the construction industry was introduced, along
with attempts at standardisation. It was noted that many attempts at
providing a unified ICT model for construction, assume that all project actors
will be satisfied with the same ‘view’. A common extension of this belief is
that CAD should provide that primary view, or at least provide the underlying
structure for any unified model.
The data source for Procession's visualisations was selected as the
widely adopted Microsoft Project. This was chosen because attempts to
develop a da jure data standard (such as STEP) are still far from accepted
and currently fail to model information relating specifically to performance. In addition, standard models are very likely to continue providing interfaces for
popular de facto formats such as Microsoft Project, as was found with the STEP-based WISPER project (Faraj et al. 1998a). At the point of selection,
Microsoft Project appeared the most ‘future proof choice, even if not ideal in
terms of it being a proprietary format.
In order to make the research described here more practical, certain
constraints were applied to the scope. Procession’s target end-users for
evaluation were identified as Registered Social Landlords (RSLs), a sub
group of construction clients. Therefore the type of project was also restricted
to the Social Housing (SH) domain. Further to this, it was finalised that
Procession would only report to RSLs during the ‘on-site’ phase of the project
It would seem that little or no software is currently available for
construction clients. Even less of what is available provides a simple
approach to performance monitoring. The application of Information
Visualisation to performance reporting for clients seems unique. It may be
concluded that construction clients are not used to having software tools
developed specifically to meet their needs. As this research required the
development of a new software application for a technically inexperienced
client group, the next chapter will consider existing methods (and sequences)
for capturing requirements. It will then propose an approach suitable for this