Article 1
Utility Value of Water Data for Strategic Planning of
2
Metropolitan Water Supplies
3
Kyle Wang1*, Steven Kenway2 , Matthew Hardy3 and Christian Urich4 4
1* University of Queensland, Chemical Engineering Department; [email protected]; Tel.: +61-4-9092-0444 5
2 The University of Queensland, Chemical Engineering Department; [email protected] 6
3 Bureau of Meteorology, Urban Water Program; [email protected] 7
4 Monash University, Civil Engineering Department; [email protected] 8
Received: date; Accepted: date; Published: date
9
Abstract: Rapid technological advancements in information communication 10
technologies have enabled water resource data collection at greater spatial and 11
temporal scale. However, this water data is often limited to the purposes of its 12
primary collection, and limits decisions made by stakeholders towards sustainable 13
urban water management. This empirically focused research paper examines how 14
water practitioners involved in strategic planning can capture additional values 15
from integrating different water data. Furthermore, the perception of 22 urban 16
water practitioners across Australia are presented, regarding the importance of and 17
difficulty in using water data for strategic planning, and the necessary steps for 18
achieving integrated water management practices. Interviewees perception 19
revealed gaps in available water resource data (i.e. water quality, ground water, 20
stormwater, and urban water use), and limitations of industry guidelines for 21
operating within existing governance frameworks. Overall, the research highlights 22
the Australian urban water sector’s perception of water data’s crucial role in
23
representing stakeholders interest; however, changes made in water data’s
24
collection are required for an integrated water management approach. Implications 25
for future open water data standard are discussed. 26
Keywords: water data management; urban water system; strategic planning; 27
integrated water management 28
29
1. Introduction
30
Water data (i.e. quantity, quality, or use) collection has been growing rapidly 31
with the deployment of information communication technologies across the urban 32
water system1 (UWS) that monitor and capture changes in spatial and temporal 33
scales. Led by research and technological advances (Benedetti et. al 2013), this 34
growth is caused by water authorities shifting focus towards integrated water 35
1 Urban water system is short for urban water infrastructure systems, which is an integration of
centralized and decentralized infrastructure systems, for the purposes of water storage,
treatment, and reuse in the urban landscape (Urich & Rauch 2014).
management2 (IWM) approaches to managing the UWS. A recent assessment of the 36
industry’s integrated water resource assessment and modelling community found 37
that while rapid advances in ‘big data’ analytics did generate useful insights, it also
38
required additional investment and motivation for collecting data (Zare et al. 2017). 39
The growth of water data has created a data management problem, where water 40
data is found to be scattered across multiple platforms with varying quality, and is 41
unusable beyond the primary means for which it was collected (Patterson et al. 2017; 42
BOM 2017). The problem is a global priority. The United Nation’s High-Level Panel 43
on Water (HLPW) (2016) identified access to water data as one of the foundational 44
requirements for delivering the Water Action Plan, a detailed approach with steps 45
for averting a future global water security crisis. 46
Water data is recognized as a critical and strategic investment for UWS to realize 47
sustainable urban water management (SUWM) (Walker 2000 cited in BOM 2017). It 48
does so by informing rigorous evidence-based decision making and generating 49
significant financial returns such as significant mitigation of disaster risks; 50
improvements in water use efficiency; and the cost-effective design of water 51
infrastructure (CIE 2015). Consequently, the utility value of water is measured by its 52
use and the outcomes derived3. Given the challenges involved in using this data, we 53
focus on understanding how advancements made towards water data collection has 54
facilitated strategic planning of water supplies in UWS? 55
Use of Water Data for Planning Functions & Instruments in Strategic Planning
56
Water data underpins a range of integrated urban planning functions and 57
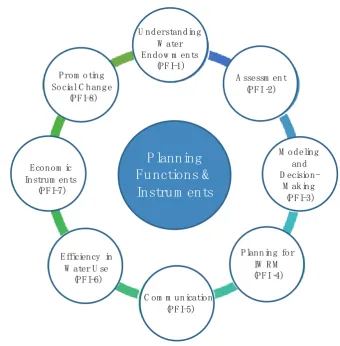
instruments (PFIs4) used for supporting an UWS towards SUWM (CRCWSC 2016). 58
A set of the PFIs have been identified by the Global Water Partnership (Figure 1). 59
Where PFI-1 to PFI-3 are challenged by the described water data management issues 60
for UWS stakeholders to effectively evaluate spatial plans and decisions for planning 61
in PFI-4 (Global Water Partnership 2017; Appendix A). 62
63
2 Integrated Water Management is a process which promotes the coordinated development and
management of water, land and related resources in order to maximize economic and social welfare in an equitable manner without compromising the sustainability of vital ecosystems (Global Water Partnerships 2017).
3 Descriptions of water data types and their use have been covered extensively in multiple industry
report and are not covered in this study (e.g. Good Practice Guidelines for Water Data Management
by BOM, and Internet of Water: Sharing and Integrating Water Data for Sustainability by the Aspen Institute).
4 Planning functions and instruments (PFIs) are artefacts of analysis used to support stakeholders
through the strategic planning process. Examples include water mass balance modelling, integrated
64
Figure 1. Set of Planning Functions & Instruments in the strategic planning process adapted from
65
Global Water Partnership’s Management Instruments.
66
Before the strategic planning process was introduced, industrialized countries 67
in a traditional socio-technical paradigm assumed its sole objective was to define 68
effective and affordable service provisions (water supply & scheme arrangements) 69
and predictability of the future (scenarios) (Dominguez et al. 2011; Störmer et al. 70
2009). This meant that completion of the planning process only required stepping 71
through PFI-1 to PFI-4. These assumptions may have worked in the 1970s and 1980s 72
(at least for industrialized countries), but they no longer apply in the face of 73
increased deep uncertainty bought about by climate change, rapid urbanization, 74
socio-economic changes etc. (Dominguez et al. 2011). 75
A strategic planning process is defined here as a process-oriented way with a set 76
of concepts, processes, and tools to deal with uncertainty and complexity by setting 77
some desirable outcomes (Albrechts 2013; Dominguez et al. 2011). This process 78
addresses a time frame of 20-30 years, due to the nature of the infrastructure sector 79
holding long-time horizons in material structures (i.e. underground piping systems, 80
centralized treatment facilities, etc.) and techno-institutional interdependencies (i.e. 81
regulation, policy, and governance frameworks) (Markard & Truffer 2006; 82
Moaellemi & Malekpour 2018). The goal is to reach a collective understanding 83
between stakeholders about the longer-term priorities of an organization 84
(Schoemaker 1992; Grant 2003). Rather than a fixed objective set by the UWS 85
P lanning
Fu nctions &
Instru m ents
U nderstanding W ater Endow m ents
(PFI-1)
A ssessm ent (PFI–2)
M odeling and D
ecision-M aking (PFI-3)
Planning for IW R M (PFI–4)
C om m unication (PFI-5) Efficiency in
W ater U se (PFI-6) Econom ic Instrum ents (PFI-7)
Prom oting Social C hange
authorities under the traditional paradigm (i.e. ending in PFI-4), strategic planning 86
sets an outcome that is reflective of UWS stakeholders’ diverse perspectives and
87
values to build resilience towards deep uncertainty (i.e. repeating PFI-1 to PFI-8) 88
(Tonn et al. 2000). 89
The construction of a technical and objective basis for an UWS has shifted from 90
asking the question of “What will happen?” to “What can happen?” (Mitchell 2004;
91
Malekpour et al. 2013). Where integrated modelling5 was previously used to answer 92
the former question, research showed the inadequate nature of this with its limited 93
number of scenarios and its lack of consideration for the temporal and spatial 94
dynamics of the UWS (Bankes 1993; Urich & Rauch 2014; Malekpour et al. 2013). 95
Exploratory modelling6 emerged in recent years as a practical approach in strategic 96
planning by engaging stakeholders, reducing cognitive bias, enabling reflexivity 97
and maturation of stakeholders to drive a set of outcomes shared by stakeholders 98
suitable for the UWS context (Urich & Rauch 2014; Moallemi & Malekpour 2018; de 99
Haan et al. 2016; Malekpour et al. 2013; Truffer et al. 2010). 100
The communication phase (PFI-5) of strategic planning requires participation 101
from a wide range of public and private UWS stakeholders, such as federal, state, 102
and local government, consultants, utilities, and myriad of water users from 103
community to commercial use. But the participation begins earlier, with 104
contributions made towards PFI-1 to PFI-3 using each stakeholders’ water data
105
inputs (each having a different jurisdiction, business function, legislative base, and 106
water data management activities) (BOM 2017). The key innovation here is the 107
increase in utility value of the water data owned by each stakeholder that is bought 108
about through highlighting the synergies between social, urban and water systems 109
(Urich & Rauch 2014; Rauch et al. 2017). 110
The Cooperative Research Centre for Water Sensitive City (CRCWSC) is an 111
Australian research entity that partners with UWS stakeholders “to revolutionize 112
urban water management in Australia and overseas” (CRCWSC 2016). Their Water 113
Sensitive Cities Index with 20+ UWS case studies established practicality of steering 114
towards a long-term vision of a ‘water-sensitive city’ and goals in a participatory 115
process with UWS stakeholders, followed by experimentation, learning and 116
reflexivity to test each solution and pathway set forth (Urich & Rauch 2014; 117
CRCWSC 2018). Their success is strengthened by PFIs to communicate the values of 118
integrating social, urban and water systems. 119
5 Integrated modelling mathematically described and quantified the relationship between
infrastructure systems under different scenarios. Its focus was on identifying the data and the
relationships that cause the most variability (Blumensaat et al. 2009).
6 Exploratory modelling explores implications of different assumptions and hypotheses with
computational experiments. Rather than aiming to predict the future accurately, it generates insight into the system behavior, aiming to identify robust policies that perform well under many future
We hypothesize that applying available water data in the strategic planning 120
process will enable data sharing among UWS stakeholders, and capture the value of 121
integrating available water data. This is important for justifying investment and 122
action towards enhancing water data value through actions such as the adoption of 123
water data standards, quality management process, and an open data approach 124
(BOM 2017). Similarly, it also offers a potential solution for solving the previously 125
identified water data management problems occurring across global contexts that 126
inhibit SUWM. 127
Aim of the Study
128
The study examines the utility value of water data to practitioners involved in 129
strategic planning approaches across Australian metropolitan UWSs. The study uses 130
qualitative semi-structured interviews with selected urban water practitioners to 131
explore the role and perception of water data’s value in their individual role and
132
organization. We aim to better understand how water practitioners can enhance 133
their own and overall value of water data available across the UWS. This intrinsic 134
study does not aim to construct a general theory or generic phenomenon that can be 135
applied to quantifying the utility value of water data (Stake 1995). 136
We recognize that SUWM is only achievable with rigorous evidence-based 137
decision making, which requires a solid information base built on reliable water 138
data. Water data is a vital prerequisite, and increasing its value is critical for 139
achieving SUWM. 140
The following section (Section 2) describes the research methods adopted to 141
conduct the study; Section 3 reviews the results generated; Section 4 describes the 142
discussion between authors; Section 5 concludes with future research direction and 143
industry opportunities for an open water data standard. 144
145
2. Materials and Methods
146
Grounded Practical Theory (GPT) is adapted from communication practice, and 147
is a variation of the well-tested academic methodology called grounded theory. GPT 148
is applied in this study to described the observed or reported behavior in how water 149
data is utilized in strategic planning into general terms, also known as theoretical 150
reconstruction, to make performed techniques and values in strategic planning 151
explicit. We build systematic theoretical statements inductively from raw 152
observational data captured in interviews through the process of repeated 153
refinement in open coding, conceptual categories, and themes. This is then tested 154
and re-tested in further data collection (Locke, 2001). Consequently, the aim of 155
deploying GPT is to inform good practice by developing theoretical statements that 156
are tested in their practical usefulness and for reflective practice (Koenig et al. 2013; 157
Craig & Tracy 2014). The approach is proven advantageous for capturing the 158
GPT’s practical use in studying the handoff communication procedure between
160
multidisciplinary providers is adapted for this study with different UWS 161
stakeholders (Koenig et al. 2013). Furthermore, a grounded theory methodology has 162
both persisted and been adopted in disciplines beyond its original domain of 163
sociology, and has proven its application in information science and management 164
studies. As such, this qualitative data driven approach fits the needs of our study. 165
Setting and Participants
166
Water data is defined in this study by its ability to dimension available water 167
resources and provide an objective basis, which then sets the foundation for a solid 168
fact-based stakeholder consultation (Dijk 2008). We will study the utility value of 169
water data underpinning PFI-1 to PFI-3, which make up the scientific/technical 170
understanding and local knowledge. This is key for realizing SUWM (Mitchell 2005). 171
Australian metropolitan UWS stakeholders were grouped into five groups 172
based on the jurisdiction of the organization, legislative base, and water data 173
management activities. The groupings are: 174
175
(1) Council are the local government authority in the metropolitan region who 176
manage the urban environment and represents the local knowledge. 177
(2) Government are the Commonwealth and State government agencies that set the 178
regulatory structure and planning policy for the metropolitan region. 179
(3) Utilities are the water corporations that manage the material infrastructure for 180
supply planning, including both bulkwater suppliers and retailers, who are 181
jointly responsible for producing strategic plans. 182
(4) Academic Institutions are universities and research organizations that support 183
the strategic planning process with their domain expertise. 184
(5) Partners are the service and product providers that are consulted or contracted 185
for completing PFIs. 186
This study examines the use of water data among water practitioners involved 187
in the initial three PFIs (PFI-1 understanding water endowment; PFI-2 assessment; 188
and PFI-3 modelling and decision-making). We contacted practitioners directly 189
based on co-authors professional network and knowledge of his/her role. 190
Participants were eligible if they had day-to-day experiences operating within and 191
between local and regime levels in the strategic planning process of the UWS, and 192
they had knowledge of the PFIs in scope. 193
Qualitative Interviews
194
We conducted individual semi-structured interviews between February and 195
May 2018 with 22 water practitioners. The interviews were structured based on 196
Clarke & Braun (2006)’s recommendation to set a clear scope and share research 197
questions with the interviewees. This limits the parameters for conducting thematic 198
analysis and mitigates the disadvantage of paralyzing researchers seeking an 199
also created to optimally obtain all the potentially available information from each 201
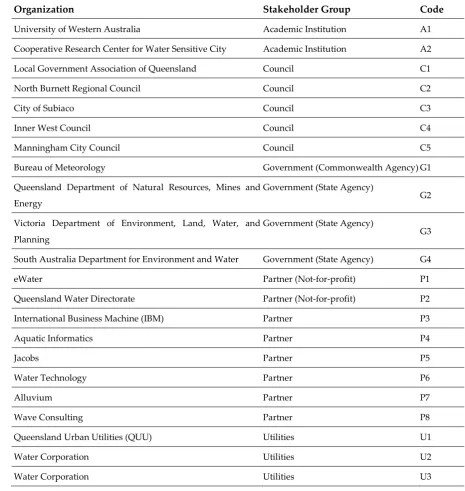
stakeholder group. Table 1 shows the stakeholdergroups and the organizations that 202
each stakeholder is from. Encoding was used to anonymously represent 203
stakeholders in the results section of this report. Interviews began with an 204
explanation of the study goals to investigate practitioners’ eligibility. 205
Table 1. Participant’s organization in stakeholder grouping and associated encoding.
206
Organization Stakeholder Group Code
University of Western Australia Academic Institution A1
Cooperative Research Center for Water Sensitive City Academic Institution A2
Local Government Association of Queensland Council C1
North Burnett Regional Council Council C2
City of Subiaco Council C3
Inner West Council Council C4
Manningham City Council Council C5
Bureau of Meteorology Government (Commonwealth Agency) G1
Queensland Department of Natural Resources, Mines and
Energy
Government (State Agency)
G2
Victoria Department of Environment, Land, Water, and
Planning
Government (State Agency)
G3
South Australia Department for Environment and Water Government (State Agency) G4
eWater Partner (Not-for-profit) P1
Queensland Water Directorate Partner (Not-for-profit) P2
International Business Machine (IBM) Partner P3
Aquatic Informatics Partner P4
Jacobs Partner P5
Water Technology Partner P6
Alluvium Partner P7
Wave Consulting Partner P8
Queensland Urban Utilities (QUU) Utilities U1
Water Corporation Utilities U2
Water Corporation Utilities U3
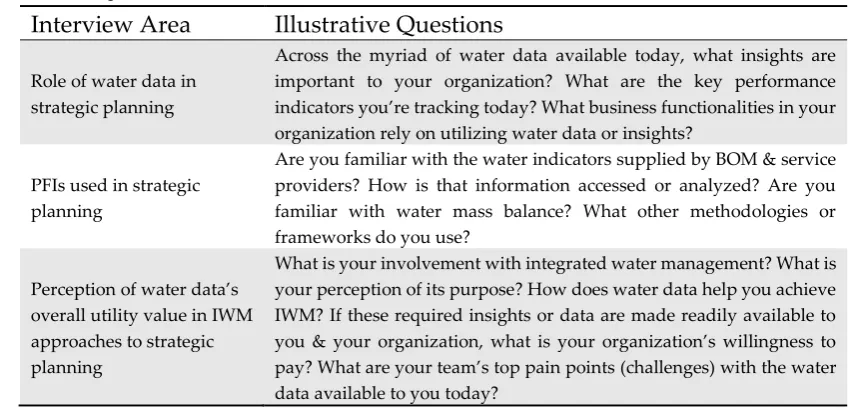
An indication of questions used are illustrated in Table 2 (full interview guide 207
in Appendix B). We piloted the interview guide in our first three interviews and 208
increased follow-up probes to deep dive into areas of knowledge in water data’s use.
209
Interviews lasted approximately 45 min (mean duration = 45:03 min; SD ±17:17 min). 210
14 out of 22 interviews were audio-recorded with participants’ permission, while the 211
environment, or recording error). Transcribed interviews resulted in 95 total pages 213
of transcripts (mean length = 4 pages; SD ±0.9 pages). 214
Table 2. Example Interview Areas and Illustrative Questions from the Semi-Structured Interview Guide
215
Interview Area Illustrative Questions
Role of water data in strategic planning
Across the myriad of water data available today, what insights are important to your organization? What are the key performance
indicators you’re tracking today? What business functionalities in your
organization rely on utilizing water data or insights?
PFIs used in strategic planning
Are you familiar with the water indicators supplied by BOM & service providers? How is that information accessed or analyzed? Are you familiar with water mass balance? What other methodologies or frameworks do you use?
Perception of water data’s
overall utility value in IWM approaches to strategic planning
What is your involvement with integrated water management? What is your perception of its purpose? How does water data help you achieve IWM? If these required insights or data are made readily available to
you & your organization, what is your organization’s willingness to
pay? What are your team’s top pain points (challenges) with the water data available to you today?
Grounded Practical Theory Analysis
216
In order to generate the initial thematic analysis, transcripts were first 217
segmented into question-answer sequences as the basic analytic unit. Next, the semi-218
structured interview guide was condensed into an individual coding scheme, which 219
provided sensitizing concepts for interpreting participants’ responses. The 220
experienced coder listened to the audio recordings (when available) simultaneously 221
with manual coding of the corresponding interview notes and transcripts to discern 222
interactional features contributing to participants’ meanings. This included
223
emphatic intonations, pauses, or changes to the participants response in latter parts 224
of the interview. The authors met during the data collection phase to discuss 225
discrepancies found, and were only resolved after reaching consensus. All identified 226
units were coded, and rich segments or quotes were annotated. Secondary data were 227
then collected through literature review to test, corroborate and augment transcript 228
data. Consequently, employing the GPT analysis for conducting an iterative data 229
analysis to systematically develop coding themes to interview areas (Creswell 2007). 230
Guest et al (2017) found that 94% of all high frequency themes and categories 231
are identified in the first six interviews. After 22 interviews, we found that 232
practitioners had similar interpretations of the insufficiency of data quality and data 233
availability on types of water resources. Review of the initial thematic analysis 234
confirmed the focus of the interviews were valid for answering the research 235
question, how advancements made towards water data collection has facilitated 236
coding7 across all the interview areas to develop the theoretical response to the 238
research question. 239
3. Results
240
3.1. Demographic Characteristics of the Sample 241
22 Australian water practitioners were interviewed out of the 40 identified to be 242
in strategic planning roles across the authors’ network and knowledge of work. The 243
most common reasons provided for non-participation were insufficient experience 244
in strategic planning of water supplies (n = 2), or did not respond to interview 245
request (n = 16). The list below shows the percentage of each stakeholder group from 246
largest to smallest in the interview sample. 247
• Partner: 36% (n = 8) 248
• Council: 23% (n = 5) 249
• Government: 18% (n = 4) 250
• Utilities: 14% (n = 3) 251
• Academic Institutions: 9% (n = 2) 252
3.2. Thematic Analysis 253
Thematic analyses is intentional in being able to move beyond counting the 254
explicit words and phrases, with a focus on identifying and describing implicit and 255
explicit ideas in the qualitative data to form themes (Guest 2012). A series of four 256
themes were identified and re-tested through a literature review to validate its 257
applicability and reduce bias. They are captured in Table 3 and explained in the 258
subsequent sections. In particular, the gaps in data across water resources to model 259
effectively, was found to have the highest frequency across interviews. The theme 260
was then summarized into a preliminary theoretical response in Table 3 before re-261
testing with literature review. The focus of which will inform the discussion for 262
capturing water data’s utility value in strategic planning and aim to answer the
263
research question. 264
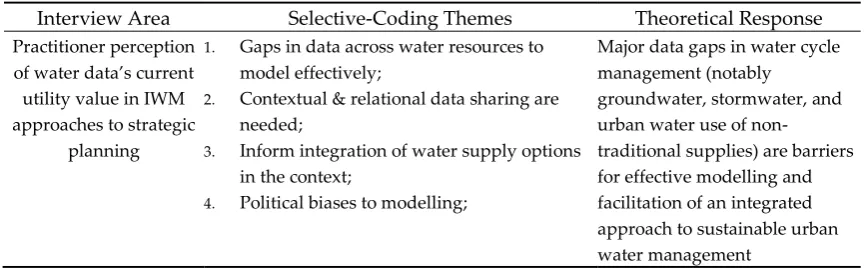
Table 3. Thematic responses to interview question area.
265
Interview Area Selective-Coding Themes Theoretical Response
Practitioner perception
of water data’s current
utility value in IWM approaches to strategic
planning
1. Gaps in data across water resources to model effectively;
2. Contextual & relational data sharing are needed;
3. Inform integration of water supply options in the context;
4. Political biases to modelling;
Major data gaps in water cycle management (notably
groundwater, stormwater, and urban water use of
non-traditional supplies) are barriers for effective modelling and facilitation of an integrated approach to sustainable urban water management
7 Selective coding is a process where the coder treats the various code clusters in a selective fashion,
3.2.1. Selective Coding-Themes 266
Despite agreement on the global aim for achieving SUWM, and the need for 267
resolving the water data management issue, the development of UWS modelling 268
and water-based metabolism models remain unable to make use of the collected and 269
available water data. However, outcomes in a UWS cannot be sufficiently answered 270
with only water data. Studies in theory and case studies applying integrated models 271
found sustainability type criteria to be critical for capturing impacts of water supply 272
intervention strategies across the UWS (Lai et al. 2008; Behzadian & Kapelan 2015). 273
Interviewee’s were then asked about adopting an IWM’s approach, which is
274
inclusive of sustainability criteria beyond conventional water management, to 275
evaluate practitioners’ use of water data for strategic planning. The thematic 276
responses are mapped across different stakeholder groups in Table 4. 277
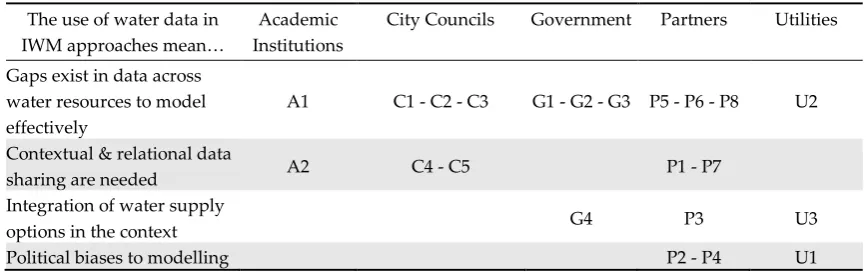
Table 4. Mapping of stakeholder responses to interview questions related to perception of water data’s overall 278
utility value in IWM approaches to strategic planning
279
The use of water data in
IWM approaches mean…
Academic Institutions
City Councils Government Partners Utilities
Gaps exist in data across water resources to model effectively
A1 C1 - C2 - C3 G1 - G2 - G3 P5 - P6 - P8 U2
Contextual & relational data
sharing are needed A2 C4 - C5 P1 - P7
Integration of water supply
options in the context G4 P3 U3
Political biases to modelling P2 - P4 U1
A significant majority of interviewees indicated that there are still large gaps in 280
water data for practitioners to model effectively for an IWM approach (50%). The 281
response is also represented across all stakeholder groups. It was found that each 282
UWS stakeholders’ application of water data involved the use of PFIs described in
283
Figure 1. Different PFIs were mentioned by interviewees, and were interpreted as 284
those under Modelling and Decision Making (PFI-3). From custom in-house 285
modelling with Excel, to industry softwares such as MUSIC8 or web applications, 286
the PFIs applied water data to achieve the specific outcomes sought after in the 287
strategic planning process in the given UWS context. Additional barriers included 288
the lack of contextual and relational data necessary to achieve sustainability 289
outcomes for the UWS (23%), and political biases that influence the models’
290
interpretation (14%). On the contrary, there are also interviewees who understood 291
an IWM approach as the integration of water supply options to meet demand at 292
minimal cost (13%). Consequently, interviewee responses reveal that rapid 293
advancements in data collection for the industry are still insufficient for strategic 294
8 Model for Urban Stormwater Improvement Conceptualisation (MUSIC) is the industry standard
modelling tool for “both simple and highly complex urban stormwater systems using water sensitive urban design. It can simulate urban stormwater systems ranging from a suburban block up to a whole
planning of an UWS to address the sustainability and integration criteria of an IWM 295
approach. 296
“But there’s a huge gap on what data needs to be captured” (C1)
“Perception is that we have the data and its easy. We started scoping the modelling a year ago but still struggle
to get it done. Trying to do a long time.” (G3)
"People are looking at it from a piece meal fashion. Specific answer they wanted for a report. But there’s no
integrated approach.” (U2)
“Urban systems –classic one is we don’t know how people are using rainwater harvesting tanks don’t have
data. If we really want to talk about decentralized sources then we really need to start monitoring them.” (P5)
"Data access –water quality is the problem. Still a large challenge.” (G2)
"Modelling doesn’t always take into the unique context – and use of groundwater – Long dry periods and the
necessary precipitation.” (C3)
"The [developers’ environmental impact assessment] report is handed to a government agency – these reports
are available but not the data.” (A1)
“Key thing is understanding the residual groundwater respond to urbanization. Don’t have the data on that.
Does the groundwater goes up or goes down? No one can agree on this.” (A1)
“Stormwater indicator – missing as a gap. Management of the stormwater then are based on best practices
rather than data supplied via the indicators.” (C4)
“The data on dam heights and river levels is really good at giving the community on whether or not there’s
droughts/flood issues coming up. But does not translate to modelling, there’s a lack of predictability under
changes / scenario planning.” (P7)
“Massive gap in water quality data, it’s really quite old…Contemporary data shows that the old data is
wrong.” (P6)
3.2.2. Decoding Theme: Gaps exist in data across water resources to model effectively 297
Across the four themes, the theme on gaps of water data passed the threshold 298
set by Guest et al (2017) to be a high frequency theme, and was later discussed by 299
the authors to be a useful insight to the research aim. The most commonly heard 300
data gaps were in stormwater, urban water use, water quality, and groundwater 301
data from the interviewees response above. Beyond the integration of data on the 302
water resources in the UWS, sufficient availability of spatial data is also a 303
prerequisite for good model performance (Benedetti et al. 2013). Interviewees seem 304
to agree as they suggested that availability of water data across different spatial and 305
temporal scales is critical for strategic planning in water supplies for UWS. 306
"Temporal scales and spatial scales. The two are key factors that they are grappling with.” (P8)
“Long time for programming and processing data – but when you get a different data sets, and without a tool to process (gets more complex with GIS and spatial with overlays of information and intersection points).
Being able to have ways to process the information quickly.” (C5)
“There’s never enough data. There’s always gaps for more information. Whether that is at the finer spatial or
Interviewees also suggested that for many UWS stakeholders, the responsibility 307
for monitoring such non-conventional water data is not clear. While there are state-308
wide water data portals made available to UWS stakeholders to improve governance 309
of the water assets, they are not necessarily standardized across Australia. 310
“Integrating the two different water supplies –there’s no guidelines for that information and the clear
understanding of them. Led by water authorities themselves (bulkwater suppliers). Part of their system. If
they’re not involved then it’s very hard.” (P8)
“Streamflow data from own streamflow sensor network – WINS – available to Victoria (partner with other
organizations).” (G3)
Western Australia has something called the water information repository – WRI – and this is not available in
other states. We frequently access but it’s not found in other states, and it’s very frustrating to not be able to
find alternatives… Incredible powerful tool that revolutionized how we work with water” (A1)
“The use of spatial information and the availability of the spatial information – soil & land-use, vegetation,
collected by agency but not readily available. Needs interpretation and no responsible agencies for doing it.”
(P7)
With IWM’s sustainability criteria in mind, we were not able to find a PFI in 311
literature that is able to evaluate or compare a comprehensive list of water supply 312
options (e.g. surface water, ground water, desalinated water, recycled water, 313
rainwater, stormwater, greywater) (Rathnayaka et al. 2016). Rather, researchers 314
recommend that relevant information, data monitoring, and findings on this topic 315
are necessary to support an IWM approach to PFIs (Truffer et al. 2010; Rathnayaka 316
et al. 2016). In the absence of a suitable PFI, interviewees made references to national 317
and state guidelines such as Australian Rainfall Runoff (ARR) that guide their use 318
of water data. In ARR’s latest revision in 2016, the authors highlight the big 319
opportunity to enhance understanding in PFIs for utilizing water data compared to 320
the 1987 version (Nathan & Weinmann 2016). Interviewees explained that these gaps 321
in water data resources are often projected with models, rather than collecting them 322
due to the cost of data collecting, and difficulty of data sharing in the strategic 323
planning process. 324
“The Australian Rainfall Report concludes that there’s not enough urban water data.” (P5)
“Australian Rainfall Runoff – software (patch update) now is being developed where you can pick up series
of design storm data. …Urban water chapter – the industry relied on this for the last 30 years.” (C5)
"An area [modelling with water data] that needs a fair bit of work. A lot of modelling is done for the modelling
sake, rather than gathering insights for [missing data]." (P7)
"But the data can be quite construed [through modelling]. Overall data sharing is not very fluid – can be quite
difficult. The data needs to be peer reviewed and measured." (C4)
“Not a lot of sharing of data across agencies – fairly superficial. At least in the council space – more
conversation on that we need to be more sharing information – on GIS data." (C5)
Interviewees gave different responses for their willingness to purchase the data 325
required to complete the PFIs. One interviewee described the influence of politics 326
interviewee from the Partner stakeholder group explained that the water data 328
should be made free as it should be captured by government. In contrast, an 329
interviewee from the Government stakeholder group believes that the role of 330
capturing these data can be owned by private organizations. Yet a discussion paper 331
among water managers and regulators in the U.S. advocated instead for a nonprofit 332
organization to be the provider of water data, acting as the backbone organization 333
for capturing the water data from data producers (Patterson et al. 2017). There is 334
much debate on this subject, and practitioners are still seeking answers for 335
ownership on the growing amount of water data collected to fit the missing pieces 336
in the PFIs used during the strategic planning of UWS. 337
“Will they be able to change anything in the business (benefit) to offset the cost of the information (cost). For
example, economics can’t buy more water –locked in and can’t do anything about it due to political schemes.”
(C2)
“[Depending on the client, some are] not willing to spend a cent on the data, there’s a risk….Water space data
that is purchasable: Healthy Land & Water – collects water quality data – ring them up and buy their data.
We purchase the data, bill it into the budget.” (P6)
“Data collection should be the role of government agencies. Largely to insure the independence and reliability
of that data. Reasonable amount of experience in the UK where a lot of the data is done on a fee for service
model, [but] it hinders the analysis and assessment of the water industry. Since industry is simply not able to
afford and therefore have to use lower quality data. Where information is collected under public funds, the
highest quality of the information should be used.” (P7)
“The way it’s set up right now is that the information gets developed when the need arises. Up till now it’s
been done on the basis where government does the research, or private proponent will do the research. There
might be a time where water is seen as a source for economic development, then there might be a potential
for government and private organizations paying for that information.” (G4)
In addition to the gaps in available data of non-conventional water resources, 338
interviewees explained other barriers for achieving SUWM. This includes 339
insufficient tools & capacity, lack of direction from regulators, and use of non-water 340
data such as social media data to better understand the UWS context, to name a few. 341
"Models themselves cause a lot of problems. Don’t have the right modelling tools.” (P6)
"The gaps are not in the water data, but it’s in where the water regulators are heading. A bit fearful of the
targets set up by the regulators, which will seriously change the parameters.” (C2)
There are other social factors – such as Facebook and social media sites. That has an influence on the water
utility itself. There hasn’t been enough exploration on the external." (C1)
“Time and resources for councils to actually sit down to use the data. Most of the time is spent making sure
the water safe. Instead of sitting back to evaluate improvement opportunities.” (P2)
“There are definite gaps in modelling skillsets across Australia. Some councils have a modelling team, and
there are obvious gaps in modelling skills & gaps.” (C4)
4. Discussion
The following explores our findings as they apply to practitioners involved in 343
strategic planning of UWS, before interpreting them for the development of an open 344
water data standard as advocated by BOM. We then provide a brief reflection on the 345
methodological strengths and weaknesses of this study. 346
4.1. Understanding the impact of data gaps for open water data stanards 347
Water data is foundational to PFIs in the strategic planning process, and sets up 348
the technical understanding and local knowledge for which UWS stakeholders can 349
achieve SUWM. Our empirical analysis suggests that data gaps in both conventional 350
sources (i.e. water quality and groundwater) and non-conventional sources (i.e. 351
stormwater and urban water use) remain missing pieces for strategic planning in 352
UWS. Beyond the water data gaps, there is also the requirement for more spatial and 353
temporal data associated with water resources in order to underpin the PFIs. 354
We heard from the interviewees that these gaps differ across Australia, and 355
where it is unknown, are often informed by either government guidelines or 356
additional modelling by local experts. There is also a difference in opinion around 357
which organizational entity should be fulfilling these gaps. In Australia, under 2008 358
Commonwealth legislated Water Act, the Bureau of Meteorology (BOM) holds a 359
range of responsibilities that includes collecting and publishing water information 360
(CIE 2015). However, rising complexity in user expectations (i.e. user-centric format 361
or temporal and spatial scale of water data) has led to a spiraling technical debt and 362
even introduces system fragility (BOM 2016). In the face of these growing costs, 363
BOM’s (2016) report on the current state of data availability concludes that open data
364
is an area that is still being defined to facilitate the consistent treatment across both 365
government and users of data. 366
This study will form an opinion over the debate on open water data standards. 367
An interview with BOM, described their responsibility as "we work with the 368
industry to understand their information needs, and provide products and services 369
to meet those needs. That’s a broader picture of industry (cross-sectoral) – policy, 370
strategic planning, operations. (G1)" Yet, a comparison of this study’s participant
371
organizations against BOM’s mandated list of organization to provide water 372
information too, found five out of the eleven groups described by BOM missing. 373
They are listed below: 374
• Other agencies of the Commonwealth or a State 375
• Hydroelectricity generators 376
• Rural water utilities 377
• Catchment Management Authorities and others 378
• Providers of water information for flood forecasting and warning 379
Similarly, the BOM’s list does not include the academic institutions (n=2) and 380
partners (n=8) interviewed in this study. Therefore this study provides the input of 381
standards. We discuss the four water data gaps identified below, and its impact on 383
open water data standards. 384
Water quality data
385
Water quality data was described by intervieews to be old (P6) or not reliable 386
enough (G2) for the PFIs used. The data is collected by councils’ legislative
387
responsibility for meeting standards published in The Australian and New Zealand 388
Guidelines for Fresh and Marine Water Quality (ANZECC 2000 Guidelines) (C3). 389
However, another interviewee also described that this data could be accessed by 390
engaging with academic institutions, who collects much of the water quality data 391
(A1). We can infer that there is an implicit understanding on the importance of water 392
quality data, and there is an opportunity to involve academic institutions in 393
developing open water data access. 394
Groundwater data
395
Groundwater data was described by those in states (Western Australia and 396
South Australia) where its availability and quality are relied upon for the UWS’s
397
long-term water supplies. In these states, the data are considered sufficient and 398
useful to strategic planning practitioners. This can be seen in the comment made by 399
an academic institution’s interviewee on WA’s water, “incredibly powerful tool that 400
revolutionized how we work with water”. This is likely due to the investments made 401
by local state government to set data availability standards, including the ability to 402
download spatial data (Government of Western Australia n.d.). We can infer that 403
the data standards set by these leading state agencies can be applied to other states 404
to elevate the availability of groundwater data for strategic planning. 405
On the other hand, the methodology for applying groundwater data for 406
strategic planning can be improved. It was mentioned that water mass balancing 407
modelling, a PFI-1 for Understanding Water’s Endowment, does not take into
408
consideration groundwater’s infiltration beyond the boundary (A2). Instead 409
availability of groundwater for strategic planning is informed by the state 410
government agency, as an Utilities interviewee explained “modelling is using 411
groundwater allocation, dam storage levels, and supplied production of 412
desalination” (U2). We can infer that the state government agency has an important 413
role in setting the standard of groundwater data, and its efforts seen in some states 414
can be applied to others in the development of a national open water data standard. 415
Stormwater data
416
Stormwater or runoff data available for strategic planning is a gap that was 417
highlighted by an interviewee in City Council (C4). And another interviewee agreed 418
on the need for this data as "more information on those [quality of stormwater and 419
for council, as they are “trying to capture data on stormwater systems, and mapping 421
all the stormwater drains in the city to better understand what’s going on, to
422
discover further harvesting opportunities" (C4). Utilities also would like to utilize 423
this information to inform the UWS water outlook, "integrating the traditional water 424
supply right from the source to areas of things like demand as well as alternative 425
sources (stormwater harvesting) and various issues that relate to water quality”
426
(U3). 427
Despite the known importance of stormwater water, a council described that 428
they have “no capacity to undertake modelling” (C3) even if the data was made
429
available. A partner commented that even though there is “more information out 430
there for use, managing, or impact of stormwater – … we’re still not measuring it. 431
Always modelling for it almost every time” (P5). Therefore we can infer that an open 432
water data policy should seek to fill the stormwater data gap through enhanced 433
measurement of data, rather than outputs of modelling PFIs such as MUSIC. 434
Urban water use
435
Urban water use in UWSs include a myriad of decentralized sources of water 436
supply including rainwater harvesting, and recycled water. The Australian Rainfall 437
and Runoff’s new revision in 2016 is a national guideline and reference for
438
Australian engineers, and covers both the urban water data available today and 439
across the state since its first release in 1987. However, the report does not include 440
wording related to open water data standards. We recommend that descriptions of 441
an open water data standard should be updated in its ongoing revisions. This would 442
leverage the guideline’s national prominence among water practitioners and enable 443
greater data sharing. The ambiguity of the description in urban water use data is 444
intentional by the authors and should allow for the flexibility to add new urban 445
water resources made possible through changes to existing socio-technological 446
paradigms in the UWS context. 447
4.2. Enhancing Australia’s open water data standards
448
Advocacy for filling the data gaps assumes that the missing data could be used 449
to support stakeholders in providing their perspectives and eliciting their interests 450
and preferences in the UWS (Delibašić et al. 2015). BOM’s legislative authority is
451
both positioned, and aspires to develop a world-leading approach to public data 452
provision that reflects clear and detailed policy advice to agencies (BOM n.d.). The 453
BOM publication, Good Practices Guidelines for Water Data Management Policy 454
(2017) reflects the action taken to fulfill the very same aspiration. 455
Our study complements these good practice water data guideline by seeking to 456
answer how the rapid growth of water data collection has facilitated the strategic 457
planning process to drive added synergistic value in UWS data. The data gaps 458
Our study employed GPT to not only identify the selective-coding themes through 460
interviews, but further validated its results through a literature review. Grounded 461
by this approach, we infer the following key points: 462
• Academic institutions and partners should be able to contribute their data 463
towards the open water data standards, supporting data gaps where it is 464
lacking or not-trusted. 465
• Stormwater data are to be prioritized in its collection given its use case rather 466
than continously applying more modelled data. 467
• State government agencies should set standards for groundwater data, 468
leading examples can be seen in Western Australia Department of Water and 469
Environmental Regulation’s Water Information Reporting data portal.
470
• The ongoing revisions to ARR 2016 edition should include the description of 471
an open water data standard to increase adoption of data sharing among 472
water practitioners. 473
4.3. Methodological reflections 474
The GPT applied is an adapted grounded theory approach that proposes a 475
theoretical framework or response towards a contested topic. The findings are made 476
stronger through the re-testing of its themes and theoretical framework with 477
additional literature review collected. The weakness of this approach is a tendency 478
for biases that stem from the researchers’ interpretation of the data captured in
479
interviews, and its synthesis. The weakness of the synthesis is the lack of sensitivity 480
analysis done in transfering themes and concepts between situations. In addition, 481
our research scope were limited to 3 out of all 8 PFIs based on time and resources 482
available (i.e. one principle interviewer that could travel and interview), and the 483
three PFIs were also identified in literature review to depend on water data and 484
practitioners’ interpretation. We attempted to preserve the context and allow for the 485
transfer of responses through the selection of water practitioners involved in 486
strategic planning. We also provided structured summaries of our study detailing 487
aims, methods, and setting and sample. This allowed the readers of our study to be 488
able to judge for themselves whether or not the study’s review was similar to their 489
own. 490
Our chosen method means that we cannot say whether or not the water data 491
gaps that were identified applies to all uses of water, nor whether our inferred 492
findings are practical and applicable towards an Australia open water data 493
standards. However, we can say with some confidence which water data gaps are 494
likely to be important for capturing additional value from the integration of existing 495
water data. This can enhance the overall utility value of an open water data standard. 496
5. Conclusions
497
• How have advancements made towards water data collection facilitated 499
strategic planning of metropolitan water supplies? 500
We characterized the need for solving the ongoing water data management 501
problem for making the transition from traditional to strategic planning approaches 502
We employed the GPT methodology adapted from Koenig et al. (2013) to identify 503
the methods for enhancing water data owned and available to different UWS 504
stakeholders. In doing so we found: 505
• Current debates on open water data standards should fulfill data gaps on 506
the collection of water quality, groundwater, stormwater, and urban 507
water use at greater spatial scales for UWS stakeholders to enhance the 508
value of available water data; 509
• BOM’s regulatory oversight of water data collection should include a 510
broader set of UWS stakeholders, rather than only to those identified in 511
the Water Act 2008; 512
• Stormwater data is a priority area for collection given its clear use case 513
among UWS stakeholders, rather than modelled data; 514
• Existing and leading data standards by state government agencies, 515
notably WA’s groundwater standards can be advocated for application
516
in other states; 517
• ARR & similar industry supported national guidelines should include 518
discussions on open water data standards to increase practitioners’
519
awareness of the value in sharing water data. 520
Future research on case studies of open water data standards led by the national 521
government authority will define tangible value for data sharing’s role in 522
sustainable urban water management. This research should be taken in a systematic 523
manner with repeated studies across different social, political, environmental, and 524
economical nations. 525
Fulfilled data gaps for a useful open water data standard with a focus on 526
strategic planning process should address some concerns raised in interviews and 527
literature. Further research is still required to understand whether the specified data 528
gaps are a consequence of individual or organizational-scale data collection failures 529
before appropriate remedial guidance can be given. UWS water data is growing 530
rapidly, and its crucial role in robust decision-making means an IWM approach can 531
strengthen decision-making under deep uncertainty. Ongoing challenges in the 532
water industry will thus require a shared understanding built on water data, 533
collected and synthesized for PFIs, to maximize the economic, social welfare and 534
sustainability of UWS towards SUWM. 535
Acknowledgments: The author acknowledges the support provided by the staff and office support by each
co-536
author’s organization, including Cooperative Research Centre for Water Sensitive City, The University of
537
Queensland, and Bureau of Meteorology. Each of which provided project guidance, office space, professional
538
contacts, and/or financial grants for the research in the form of scholarship. Among them, the International Water
539
Centre’s academic support and tuition scholarship for inspiring the author’s resolve to undertake the research 540
as part of a Master’s program final project. 541
Appendix A – 8 types of Planning Functions & Instruments for Strategic
543
Planning of Integrated Water Resource Management
544
545
Understanding Water Endowments (PFI-1)– Helps to understand water as a physical resource. To that end, it
546
considers the analysis of Demand and Supply 1.01), the collection of data on the hydrological cycle
(PFI-547
1.02), the valuation of the resource itself, as well as the monitoring of water quality and the evaluation of water
548
policies (PFI-1.03).
549
Assessment (PFI-2)– Helps to understand the connections between water resources and their users as well as
550
to calculate the impacts of uncertain events or policy measures on the resource and its users. The aspects
551
considered are risk (PFI-2.01) and vulnerability (PFI-2.02), social structures and effects (PFI-2.03), ecosystems
552
(PFI-2.04), environment (PFI-2.05), and economics (PFI-2.06).
553
Modelling and Decision-Making (PFI-3)– Visualizes the information that has been gathered and helps to make
554
decisions based on that information according to jointly established criteria with stakeholders. For that purpose,
555
it includes further information on GIS 3.01), Stakeholder Analysis 3.02), Shared Vision Planning
(PFI-556
3.03), and Decision Support Systems (PFI-3.04).
557
Planning for IWRM (PFI-4)– On the basis of knowledge gained through assessments and modelling processes,
558
plans can be made that integrate environmental, social and economic aspects of water management on different
559
scales: on the national level (PFI-4.01), river basin level (PFI-4.02), with regards to ground water (PFI-4.03), or
560
coastal areas (PFI-4.04). These plans can also address the specific requirements of particular settings or situations,
561
such as urban water management (PFI-4.05), disaster risk management (PFI-4.06), or national adaptation plans
562
(PFI-4.07).
563
Communication (PFI-5) –Water management does not take place in a vacuum. It involves a variety of
564
stakeholders and relies heavily on sharing knowledge in order to design effective plans and foster participation.
565
P lanning
Fu nctions &
Instru m ents
U nderstanding W ater Endow m ents
(PFI-1)
A ssessm ent (PFI–2)
M odeling and D
ecision-M aking (PFI-3)
Planning for IW R M (PFI–4)
C om m unication (PFI-5) Efficiency in
W ater U se (PFI-6) Econom ic Instrum ents (PFI-7)
Prom oting Social C hange
For that reason, an overview on Communication Tools (PFI-5.01) is given and measures to prevent and deal with
566
conflict are explained, such as Consensus Building (PFI-5.02) and Conflict Management (PFI-5.03).
567
Efficiency in Water Management (PFI-6) – Refers to measures that improve the management of demand and
568
supply by enhancing water Demand Efficiency (PFI-6.01) and Supply Efficiency (PFI-6.02). Another way to reach
569
that goal is to Recycle and Reuse (PFI-6.03).
570
Economic Instruments (PFI-7) – There are different ways to ensure behaviour that is beneficial to the protection
571
of water quality and quantity. Those that are economic in nature are considered here – Water Pricing (PFI-7.01)
572
and Water Markets (PFI-7.02), for example, but also Tradable Pollution Permits (PFI-7.03) and Pollution Charges
573
(PFI-7.04), Subsidies (PFI-7.05), and Payments for Environmental Services (PFI-7.06) that penalize certain kinds
574
of behaviour and reward others.
575
Promoting Social Change (PFI-8) – Social attitudes also play a big role in determining behaviour. In order to
576
ensure behaviour that promotes water security, social change might be necessary. A change in attitudes can be
577
fostered through the integration of water management into Youth Education (PFI-8.01), and through Raising
578
Public Awareness (PFI-8.02). The concept of the Water Footprint (PFI-8.03) can be helpful to explain the
579
relationship between water and agricultural and industry, and Virtual water (PFI-8.04) to learn about how much
580
water is used in the industrial production of goods.
581
Appendix B – Interview Questions used with Interviewees
582
Warm up / background
583
[Goal: Determine where the interviewee’s focus is. Prioritize subsequent sections accordingly]
• Tell me a little bit about yourself, how did you get into the water business?
584
Role of Water Data in Strategic Planning
585
• Across the myriad of data available today, what insights are important to your
586
organization? Are you able to gather these insights today? If so, how? If not, why
587
not?
588
• What are the key performance indicators you’re tracking today? What are the
589
metrics you use? How do you track this today?
590
o How do you or your team interact with data modelling or utilize the
591
insights from modelling, if any?
592
• What business functionalities in your organization rely on utilizing water data or
593
insights generated from data?
594
Planning Functions & Instruments used in Strategic Planning
595
• Are you familiar with the water indicators supplied by service providers? If so,
596
how does your organization use that information today for strategic planning?
597
• Are you familiar with water mass balance? If so, how is that information accessed
598
or analyzed? Please describe to the best extent you know.
599
• What other methodologies or frameworks do you use?
600
Perception of water data’s overall utility value in IWM approaches to strategic planning
601
• What is your involvement with integrated water management? What is your
602
perception of its purpose?
603
• What are your team’s top pain points with the water data available to you today? 604
What technologies are you exploring to solve them?
605
• If these required insights or data are made readily available to you & your
606
Wrap-up
608
• As a wrap up, do you have any suggestions or see any gaps in the water data space
609
that you’d like to point out? 610
• Thanks for the time: as a token of our appreciation, would it be valuable for us to
611
get X based on our research?
612
References
613
1. Albrechts, L., 2013, ‘Reframing strategic spatial planning by using a coproduction perspective,’ Planning
614
Theory, vol. 12, issue 1, pp.46–63.
615
2. Bankes, S., 1993, ‘Exploratory Modeling for Policy Analysis,’ Operations Research, vol. 41, issue 3, pp.
435-616
449.
617
3. Behzadian, K. & Kapelan, Z., 2015, ‘Advantages of integrated and sustainability based assessment for 618
metabolism based strategic planning of urban water systems,’ Science of the Total Environment, vol.
527-619
528, pp. 220–231.
620
4. Benedetti, L., Langeveld, J., Comeau, A., Corominas, L., Daigger, G., Martin, C., Mikkelsen, P.S., Vezzaro,
621
L., Weijers, S. & Vanrolleghem, P.A., 2013, ‘Modelling and monitoring of integrated urban wastewater
622
systems: status and perspectives,’ Water Science and Technology, vol.68, issue 6, pp. 1203-1215.
623
5. Blumensaat, F., Tränckner, J., Hoeft, S., Jardin, N., & Krebs, P., 2009, ‘Quantifying effects of interacting 624
optimisation measures in urban drainage systems,’ Urban Water Journal, vol. 6, issue 2, pp. 93-105.
625
6. Bureau of Meteorology, 2017, Good practice guideline for water data management policy: World Water Data
626
Initiative, Bureau of Meteorology, Melbourne.
627
7. Bureau of Meteorology, 2016, ‘Submission to the Productivity Commission Inquiry into Data Availability 628
and Use,’ Bom.gov.au, August, viewed on 1 June, 2018,
629
www.pc.gov.au/__data/assets/pdf_file/0019/206812/sub198-data-access.pdf.
630
8. Centre for International Economics, 2015, Economic analysis of the Bureau of Meteorology’s water 631
information, December.
632
9. Clarke, V. & Braun, V., 2017, ‘Thematic analysis’, Journal of Positive Psychology, vol. 12, issue 3, pp.297–298.
633
10. Cooperative Research Centre for Water Sensitive Cities, 2016, ‘About the CRCWSC,’ 634
watersensitivecities.org.au, 11 April, viewed on 2 June, 2018, watersensitivecities.org.au/about-the-crcwsc. 635
11. Cooperative Research Centre for Water Sensitive Cities, 2017, ‘Evidence-based integrated urban planning
636
across different scales (IRP3),’ watersensitivecities.org.au, 24 Oct, viewed on 20 May, 2018,
637
watersensitivecities.org.au/content/project-irp3/ 638
12. Craig, R., & Tracy, K., 2014, Building Grounded Practical Theory in Applied Communication Research:
639
Introduction to the Special Issue, Journal of Applied Communication Research, vol. 42, issue 3, pp. 229-243.
640
13. Creswell, J.W., 2007, Qualitative Inquiry and Research Design: Choosing Among Five Approaches, Second
641
Edition, Thousand Oaks, Calif.: Sage Publications.
642
14. De Haan, F., Rogers, B., Brown, R., and Deletic, A., 2016, "Many Roads to Rome: The Emergence of
643
Pathways from Patterns of Change through Exploratory Modelling of Sustainability Transitions,"
644
Environmental Modelling and Software, vol. 85, pp. 279-92. Web.
645
15. Delibašić, B., Hernández, J.E., Papathanasiou, J., Dargam, F., Zaraté, P., Ribeiro, R., Liu, S., Linden, I.,
646
2015, ‘Decision Support Systems V – Big Data Analytics for Decision Making First International
647
Conference,’ ICDSST 2015, Belgrade, Serbia, May 27-29, 2015.
648
16. Dijk, J.M.V., 2008, Water and Environment in Decision-making. Water Assessment, Environmental
649
Impact Assessment, and Strategic Environmental Assessment in Dutch Planning. A Comparison,
650
Dissertation, internally prepared by Wageningen University & Research.
651
17. Dominguez, D., Truffer, B. & Gujer, W., 2011, ‘Tackling uncertainties in infrastructure sectors through 652
strategic planning: the contribution of discursive approaches in the urban water sector,’ Water Policy, vol.
653
13, issue 3, pp.299–316.
654
18. eWater Ltd, 2012, MUSIC by eWater, viewed on 29 May, 2018, https://ewater.org.au/products/music/
655
19. Global Water Partnership, 2017, ‘IWRM Toolbox: Management Instruments,’Global Water Partnership, 28
656