1
TREND ANALYSIS OF TUBERCULOSIS CASES AND THE EFFECT OF HIV CASES ON TUBERCULOSIS CASES IN SOME WEST AFRICAN COUNTRIES USING PANEL
POISSON AND NEGATIVE BINOMIAL REGRESSION MODELS
Monday Osagie
1,2Adenomon & Gbenga Solomon
1Akinyemi
1. Department of Statistics & NSUK-LISA Stat Lab Nasarawa State University, Keffi, Nigeria
2. Foundation of Laboratory for Econometrics and Applied Statistics of Nigeria (aka FOUND-LEAS-IN-NIGERIA)
[email protected]; [email protected]
Tel: +2347036990145; +2348067652424 2. https://orcid.org/0000-0002-9523-8032
Abstract
Tuberculosis is a leading cause of death worldwide and the leading cause from a single infectious agent, ranking above Human immunodeficiency virus (HIV) and Acquired Immune Deficiency Syndrome (AIDS). The aim of this study is to ascertain the trend of tuberculosis prevalence and the effect of HIV prevalence on Tuberculosis case in some West African countries from 2000 to 2016 using count panel data regression models. The data used annual HIV and Tuberculosis cases spanning from 2000 to 2016 extracted from online publication of World health Organization (WHO). Panel Poisson regression model and Negative binomial regression model for fixed and random effects were used to analyzed the count data, the result revealed a positive trend in TB cases while increased in HIV cases leads to increase in TB cases in West African countries. Among the competing models used in this study, Panel Negative Binomial Regression Model with fixed effect emerged the best model with log likelihood value of -1336.554. This study recommended that Government and NGOs need more strategies to fight against HIV menace in West Africa as this will in turn reduced TB cases in West Africa.
Keywords: Tuberculosis (TB), Human immunodeficiency virus (HIV), Acquired Immune Deficiency Syndrome (AIDS), World health Organization (WHO), Panel Data, Poisson, Negative Binomial, Regression
1. Introduction
Tuberculosis is sometime referred to as ‘the silent killer’. This disease is considered the 9th
leading cause of death in 2016, and found to rate higher than HIV in term of infection and
transmission (WHO, 2017). Seven countries amounted for 64% of TB infection globally which
2
include Nigeria and other Countries such as, India, Indonesia, China, Philippines Pakistan and
South Africa. In the order of most infected countries by TB, Nigeria ranked 6th (Ogbo et al. ,
2018).
Due to the havoc of TB and HIV diseases in Africa and the world at large, one may ask the
following questions:
i. What is the trend of tuberculosis prevalence among West African countries?
ii. Is there any significant relationship between patients having tuberculosis as a
result of being infected with HIV/AIDS among the West African?
The aim of this study is to examine the trend of tuberculosis prevalence and the dynamic
interrelationship between TB and HIV prevalence among some West African countries using
count panel data regression models.
2. LITERATURE REVIEW
Brosch, et al., (2002), suggested that TB bacteria (Mycobacterium tuberculosis) is curable and
preventable, it now depend on how much we deepen how fight against it further spread in any
community while WHO (2017) Global Tuberculosis Report highlighted that TB can be spread
from person to person through the air. In a review on the assessment of the trend in TB in
Africa Chatterjee & Pramanikit (2015) discovered that unprecedented growth of the tuberculosis
epidemic in Africa is attributable to several factors, the most important being the HIV epidemic.
Tuberculosis is commonly associated with death from HIV/AIDS autopsy studies have shown
that 30 to 40% of HIV-infected adults die from TB. Among HIV-infected children, TB accounts
3
worldwide live in sub-Saharan Africa. In addition, malnutrition is one of the factors that can
promote TB infection. (Cegielski and McMurray, 2004)
Umeh et al., (2007) carried out an investigated among patients referred to a chest clinic in
Nasarawa State by examining 344 patients who presented with respiratory problems at the clinic,
it was discovered that 44.8% had M. tuberculosis infection, 24.7% HIV infection and 12.8%
HIV/tubercle bacilli co-infection. It was also found that Co-infection rate in HIV infected
persons (HIV+) was 51.8 and 28.6% in those with M. tuberculosis infection. The relative risk of
HIV positive persons being co-infected was 1.075, while it was 0.401 for TB infected persons.
The estimated Odds Ratio (OR) shows that the risk of co-infection was 2.68 times higher among
HIV+ persons than among those with tuberculosis. The attributable risk of 45% was found and
shows the extent to which co-infection could be attributed to HIV infection. A key
socio-economic variable, eating in groups, was significantly correlated with co-infection (r = 0.107; p<
0.05). it was finally concluded that his result corroborates the finding (Brown et al., 2006) that
tuberculosis is highest among people infected with HIV and that HIV infection is likely to be one
of the factors responsible for the recent increase in tuberculosis.
Askar (2008) examined Tuberculosis and HIV co-infection in two district in Somaliland using
839 patient. The study employed logistic regression model and the result revealed HIV
seroprevalence among TB patient in Somaliland had increased Over time.
Njepuome and Odume (2009) examined the impact of HIV syndromes in the treatment of TB
cases in Gombe state Nigeria using 300 patents with HIV and TB. The study revealed no
significant difference in the mean age of male and female. The study also revealed that the death
4
Pimpin and Drumright (2011) carried out a systematic review to determine the burden of
TB-HIV infection in the European Union and European Economic Area on 10 academic literature
databases which were searched between September and October 2009:. The review carried out
on information collected in 1996 and later, regardless of the year of initiation of data collection
and narrative synthesis presented reveals that the proportion of HIV-co-infected patient varied
from 0 to 15%. Higher level and increasing trend of infection was recorded in the Western and
Eastern countries compared with the central European Union / European Economic Area.
Cajetan et al., (2017) examined the Prevalence of drug-resistant tuberculosis in Nigeria using a
systematic review and meta-analysis identified that 34 anti-TB drug resistance surveys with 8002
adult TB patients consisting of 2982 new and 5020 previously-treated cases. The prevalence rate
of any drug resistance among new TB cases was 32.0% (95% CI 24.0–40.0%; 734/2892) and
among previously treated cases, the rate was 53.0% (95% CI 35.0–71.0%; 1467/5020).
Furthermore, multidrug resistance among new and previously-treated cases was 6.0% (95% CI
4.0–8.0%;161/ 2502) and 32.0% (95%CI 20.0–44.0; 357/949), respectively. Heterogeneity was
significant in the studies. It was concluded that the burden of drug resistance TB in Nigeria is
high and as such immediate survey needs to be carried out and measure taken to curb the
increasing trend.
Akinleye et al. (2015) carried out a prospective study on Tuberculosis and HIV co-infection
among patients attending directly observed treatment short course (DOTS) in Lagos, Nigeria
case study of Ojo local government area. This study was carried out to determine the prevalence
of HIV/TB co-infection among tuberculosis patients in DOTS Centre in Lagos. This study was
5
in Lagos, Nigeria. Five hundred and nine (509) DOTS attendees (270 females and 239 males,
age-range 10-70years of age, at the Ojo and Okoko health services Centre. Samples of sputum
and blood were collected and processed using standard laboratory procedures. All the patients’
sera were screened for antibodies for HIV1& 2 using three rapid ELISA kits. The study showed
that there is no significant relationship with a total of one hundred and twenty eight (25.1%) of
HIV infection among diagnosed TB patients. HIV/TB co-infection positive patients for male and
female were 25.6% and 24.8% respectively. Finally it was concluded that The results of the work
show a high burden of HIV/TB co-infection in Lagos state, southwestern Nigeria the overall
prevalence of HIV infection among diagnosed TB patients was 128(25.1%) is higher than
previously reported among this category of patients in the state.
Andrzej et al., (2012) Having examined Tuberculosis and HIV Co-Infection found that the
incidence and mortality rates for new AIDS-defining opportunistic infections have been shown
to be higher if individuals with HIV are infected with TB, they also noted that TB/HIV
co-infection represents a novel pathogenic scenario at the global level. It constitutes a serious
diagnostic and therapeutic challenge and, particularly in poor countries, weighs heavily on
already strained health care budgets. It has recently been realized that the epidemiology, clinical
manifestations, and management of both HIV and M. tuberculosis infections are different and far
more complex in co-infected compared to mono-infected patients. However, our knowledge
about the mechanisms of interaction of the two pathogens still has many gaps that need to be
filled in order to develop preventive measures against the two diseases.
Pontali et al., (2011) under gone a study on Tuberculosis and HIV co-infection bearing in mind
6
should be interested in knowing about the state of the art in tuberculosis (TB) and HIV
co-infection surveillance in Europe? Came up with answers like is probably easier to answer, at
least at a global level: TB–HIV co-infection is responsible for almost 400,000 deaths every year
and TB is by far the major killer of HIV-infected persons, being responsible for over a quarter of
the global burden of HIV-associated deaths; people living with HIV/AIDS infected
with Mycobacterium tuberculosis are at 20–30 times greater risk of developing TB compared
with HIV-uninfected persons.
Aweke et al. (2016) Examining Prevalence and associated factors of TB/HIV co-infection among
HIV Infected patients in Amhara region, Ethiopia. There were 571 respondents in the study. Of
these, 413 (72.3%) were not found to have TB/HIV-co infection while 158(27.7%) had TB/HIV
co-infection. The proportion of female respondents who had TB/HIV-co infection accounted for
a larger proportion in the sample 107(69%) compared to male respondents 48(31%). Patients
with primary education accounted for the larger proportion 64(40%) of having TB/HIV
co-infection compared to those with no education 39(24.8%), secondary education 33(21%), and
certificate and above 21(13.4%). In addition, majority of TB/HIV patients 130(82.8%) were
urban residents while 27(17.2%) were residing in rural areas. Among TB/HIV co-infected
patients, 149(96.8%) were smokers 123(79.9%) of TB/HIV co-infected patients were
non-alcoholics. The majority of participants who had TB/HIV co-infection, 104(67.5%) were in
WHO clinical stage of III followed by WHO clinical stage IV 23(14.9%) and WHO clinical
stage II 19(12.3%). Only 8(5.2%) study participants who have TB/HIV-co infection were found
to be in WHO clinical stage I. Chi-square test shows that the TB/HIV co infection is significantly
associated with marital status, alcohol intake, baseline CD4 count, baseline WHO clinical stage,
7
3. RESEARCH METHODOLOGY
This section looks at the methodology used to achieve the objectives of the study. Also discussed
in this section are the research design, data types and sources, and the model specification
important to the objectives of the study. The estimation techniques used to ascertain the likely
causal relationship was addressed also.
The population target for the study is West African countries which comprises of 16 countries,
but for the purpose of this research only 10 West African countries will be covered. i.e Benin,
Burkina Faso, Gambia, Ghana, Guinea Bissau, Liberia, Mali, Niger, Nigeria and Serra Loane, for
a period of 17 years (2000 to 2016). The data was sourced from the WHO (2018) Publications.
4. Model Specification
Panel data are also called longitudinal data or cross-sectional time-series data. These longitudinal
data have observations on the same units in several different time periods (Kennedy, 2008). A
panel data set has multiple entities, each of which has repeated measurements at different time
periods. Panel data may have individual (group) effect, time effect, or both, which are analyzed
by fixed effect and/or random effect models. longitudinal data have more variability and allow to
explore more issues than do cross-sectional or time-series data alone (Kennedy, 2008).
Baltagi (2001) revealed that Panel data give more informative data, more variability, less
collinearity among the variables, more degrees of freedom and more efficiency. Green (1997)
further explained that if individual effects are significant then this is a sign that a significant
component of the model is accounted for by the individual effect parameter and so fixed effect
8
determine which is best between the fixed and random effect model. The layout of panel data is
given below:
The generalized linear model for panel data is specified as:
yit = α + βx it + Ɛit ………. (1)
Where
i: stands for the cross sectional variable i = 1,…..N
t: stands for the time series t = 1,…..T
yit: stands for the dependent variable (it will be denoted as number of cases resulting from
Tuberculosis)
9
X it: stands for the independent variable (it will denote explanatory variable which will include
time period and cases of HIV)
α: stands for the intercept
β: stands for the coefficient of the independent variable
Ɛit: stands for the error term
The Basic Linear Panel Models are
Pooled model (or population average)
yit = α + βx΄it + uit ………... (2)
Two-way effects model allows intercept to vary over i and t
yit = α + γt + βx΄it + Ɛit ………... (3)
Individual-specific effects model
yit = αi+ βx΄it + Ɛit ………... (4)
Where αi may be fixed or random effect.
Mixed model or random coefficients model allows slopes to vary over
The fixed effect (FE) model takes αi to be a group of specific constant term in the regression
equation.
Individual-specific effects model:
yit = αi + β1X1it + β2X2it +…..+ βkXkit + Ɛit …... (5)
αi is a random variable possibly correlated with x it
So regressor x it may be endogenous (wrt to αi but not Ɛit)
10
Within (FE) and first difference estimators are consistent.
or in the matrix notation
yit = αi+ βx΄it + Ɛit ………... (6)
where x΄it = [X1it, X2it, ……, Xkit ]
and β΄ = [β1, β2, β3 ……, βk ].
The “i” indexes cross-section realizations so that i = 1,2,3,…..N (countries) and “t” indexes
time-series realizations so that t = 1,2,3…..T (Time). While the individual effect αi is regarded as the
constant over time (t) and specific to the individual cross-sectional unit (i) denoted here as West
African countries. The αi is expected to capture the unobservable, and non-measurable
characteristics that differentiate individual units.
Fundamental assumption of the fixed effect model
E[Ɛit] = 0
Cov(Ɛit, Ɛjt) = 0,
Var (Ɛit) = E[Ɛ2it] = σ2e
E[Ɛit, X1it] = E[Ɛit, X2it] = E[Ɛit, X3it] = E[Ɛit, X4it] = …….. = E[Ɛit, Xkit] = 0 and the Xkit is not
invariant. It should be noted that under this assumptions, the OLS can be used to obtain the
11
Random effect (RE) or population-average (PA): this is also known as the error component
model, includes a non-measurable stochastic variable, which differentiates individuals. It is
written thus:
yit = αi + β1X1it + β2X2it +…..+ βkXkit + ui + Ɛit ... (7)
αi is a random variable possibly correlated with x it
So regressor x it may be exogenous (wrt to αi but not Ɛit)
Pooled OLS, pooled GLS and RE are inconsistence for β
Ui is a stochastic variable
or in the matrix notation
yit = αi+ βx΄it + ui + Ɛit ………...(8)
where x΄it = [X1it, X2it, ……, Xkit ]
and β΄ = [β1, β2, β3 ……, βk ].
The “i” indexes cross-section realizations so that i = 1,2,3,…..N (countries) and “t” indexes
time-series realizations so that t = 1,2,3…..T (Time). The term ui is stochastic variable that embodies
the unobservable or non-measurable distance that later account for individual distance.
Essentially, the effect is thought to be a random individual effect rather than a fixed parameter.
Fundamental assumption of the random effect model
E[ui, X1it] = E[ui, X2it] = E[ui, X3it] = E[ui, X4it] = …….. = E[ui, Xkit] = 0 ………(9)
12
Cov(ui, Ɛjt) = E[ui, Ɛit ] = σ2Ɛ, u’ ………(11)
Var (ui) = E[u2i] = σ2u ……….(12)
Assuming normality ui ~ N(0, σ2u ), Ɛit ~ N(0, σ2e ), where both “ui” and “Ɛit” are stochastic
variables but form a composite error term called omega (ui + Ɛit)= ωit
Since the research data are count in nature the panel count data model will be specifically used to
model the data thus:
(a). Poisson Regression Model: the Poisson regression model is used for modeling count data
and is usually the limiting form of binomial distribution. It is the probability of a random event X
occurring in an interval of time. It is denoted by, ; x = 0,1,2,3…….N. with
mean and variance as and the skewness and kurtosis of the distribution been and 3
respectively.
(b). Negative Binomial Regression Model. This is the probability distribution of the number of
failure X, before the Kth success in event that follows a binomial distribution where the
probability of success is denoted by P and failure q i.e (1-P). This distribution is given as.
13
Where
Mean is and Variance is 2
Skewness is and Kurtosis is 3+ +
5. Data Presentation and Analysis
This section focused on the interpretation of result from the analyses carried out on the data
collected from World Health Organization (WHO, 2018).
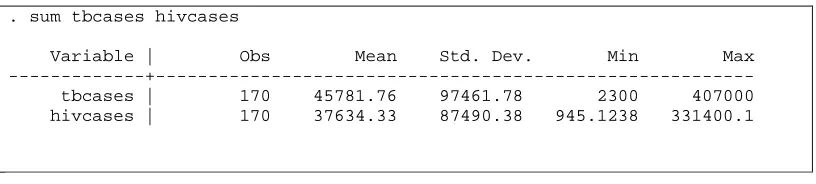
Table 1: Descriptive Statistics.
. sum tbcases hivcases
Variable | Obs Mean Std. Dev. Min Max ---+--- tbcases | 170 45781.76 97461.78 2300 407000 hivcases | 170 37634.33 87490.38 945.1238 331400.1
Table 1 above show Over dispersion i.e (Variance > Mean) in both cases of TB and HIV. TB
having a mean of 44781.76 with a variance of 9498798561, while HIV has a mean of 37634.33
with variance of 7640399712. This clearly showed that there is evidence of over dispersion of
the data set. It should be noted that this is happening because it is common with count data to
have a problem of over dispersion which implies that the observed variance is higher than the
variance of a theoretical model. This problem will affect the Poisson regression negatively and
14
Fig 1: Shows the prevalence rate of TB and HIV in Benin from 2000-2016.
Fig 1 above chat shows the prevalence rate of TB and HIV in Benin from 2000 to 2016, with the
highest rate of incidence cases in 2016 with a total of 6400 and 7931 cases recorded for TB and
HIV respectively. However between this 16years period TB and HIV were on the increase by
8.50% and 49.10% respectively. It should also be noted here that TB has been on oscillatory
trend as it have been oscillating between 5900 to 6400 within this period in the meantime HIV
been on a steady increment leading to 49.1% increment.
15
Fig 2 above chat shows the prevalence rate of TB and HIV in Burkina Faso from 2000 to 2016
with the highest rate of incidence cases of TB in 2016 totaling 9400 cases while HIV recorded its
highest count in 2000 with a total of 16040 and 36.22% decrease with the 16years period
however TB has being on the increase with 14.60% increase from 2000 to 2016. Leading to a
downward trend in HIV while there is an upward trend in TB over this period of time.
Fig 3:
Shows the prevalence rate of TB and HIV in Gambia from 2000-2016.
Fig 3 above shows the chat of prevalence rate of TB and HIV in Gambia with the highest rate of
incidence cases of both TB and HIV recorded in 2016 to be 3500 and 2084 respectively.
However from 2000 to 2016 there have being a steady increase of 4.3% and 120.53% for TB and
16
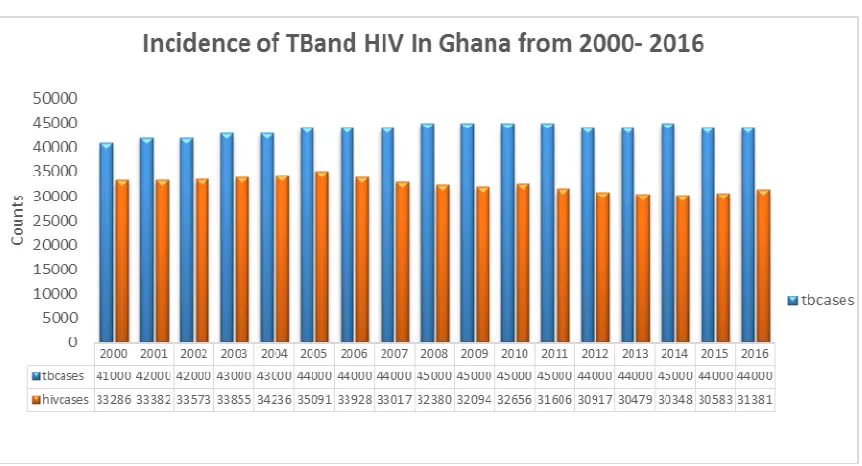
Fig 4: Shows the prevalence rate of TB and HIV in Ghana from 2000-2016.
Fig 4 above shows the chat of prevalence rate of TB and HIV in Ghana with the highest cases of
HIV recorded between 2000 and 2005 with an increasing rate of 5.42% after which there was a
decline in case of 12.85% in HIV between 2005-2015 but between 2015 and 2016 it rose with
about 2.6% cases. However incidence cases of TB has been on a steady increase of 9.76% from
2000 to and 2010 and later showed a 2.22% decrease from 2010-2016.
17
Fig 5 above chat shows the prevalence rate of TB and HIV in Guinea-Bussau with the highest
rate of incidence cases recorded in 2016 to be 6800 cases. There was a steady increase rate of
78.95% in TB incident cases between 2000 and 2016 it reveals and upward trend of the infection.
Similarly HIV followed the same trend of upward movement with the highest rate of incidence
cases recorded in 2016 to be 4150 cases. There was a steady increase rate of 144.69% in HIV
incident cases between 2000 and 2016.
Fig 6: Shows the prevalence rate of TB and HIV in Liberia from 2000-2016.
Fig 6 above chat shows the prevalence rate of TB and HIV in Liberia with the highest rate of
incidence cases recorded in 2014-2016 to be 14000 cases in each year. There was a steady
increase rate of 108.90% in TB incident cases between 2000 and 2016 it reveals and upward
trend of the infection. In the cases of HIV there was an upward trend between 2000-2005, with a
7.10% increase rate but later between 2005-2016 there downward rate of 5.27% in HIV incident
18
Fig 7:
Shows the prevalence rate of TB and HIV in Mali from 2000-2016.
Fig 7 above chat shows the prevalence rate of TB and HIV in Mali with the highest rate of
incidence cases recorded in 2016 to be 10000 cases. There was a steady increase rate of 17.65%
in TB incident cases between 2000 and 2016 it reveals and upward trend of the infection.
Similarly HIV followed the same trend of upward movement with the highest rate of incidence
cases recorded in 2016 to be 12120 cases. There was a steady increase rate of 40.73% in HIV
19
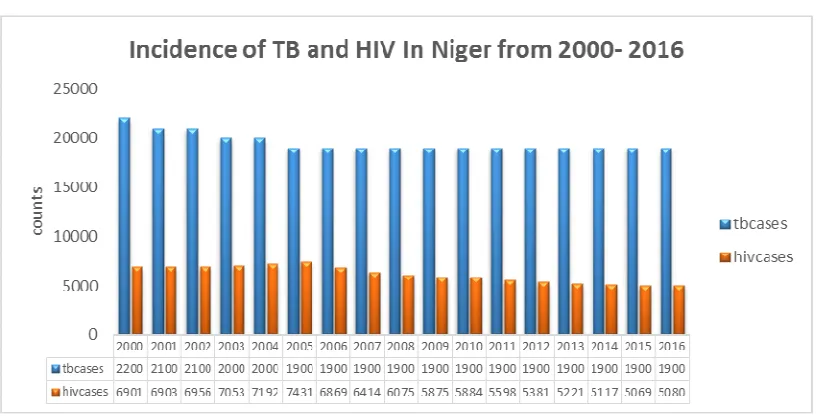
Fig 8: Shows the prevalence rate of TB and HIV in Niger from 2000-2016.
Fig 8 above shows the prevalence rate of TB in Niger with the highest rate of incidence cases
recorded in 2000 to be 22000 cases after which it maintained a steady 19000 from 2004-2016
with a 13.63% decrease in TB incident cases between 2000 and 2016. Similarly HIV has been on
the decrease of 22.35% between 2000 and 2016.
Fig 9: Shows the prevalence rate of TB and HIV in Nigeria from 2000-2016.
Fig 9 above chat shows the prevalence rate of TB and HIV in Nigeria from 2000 to 2016, with
the highest rate of incidence cases in 2016 with a total of 407000 and 331400 cases recorded for
TB and HIV respectively. However between this 16years period TB and HIV were on the
20
Fig 10: Shows the prevalence rate of TB and HIV in Sierra Leone .
Fig 10 above chat shows the prevalence rate of TB in Sierria leone from 2000 to 2016, with the
highest rate of incidence cases in 2013-2016 with a uniform total of 2200 cases recorded.
However between this 16years period TB and HIV were on the increase by 57.14% and 149.69%
respectively.
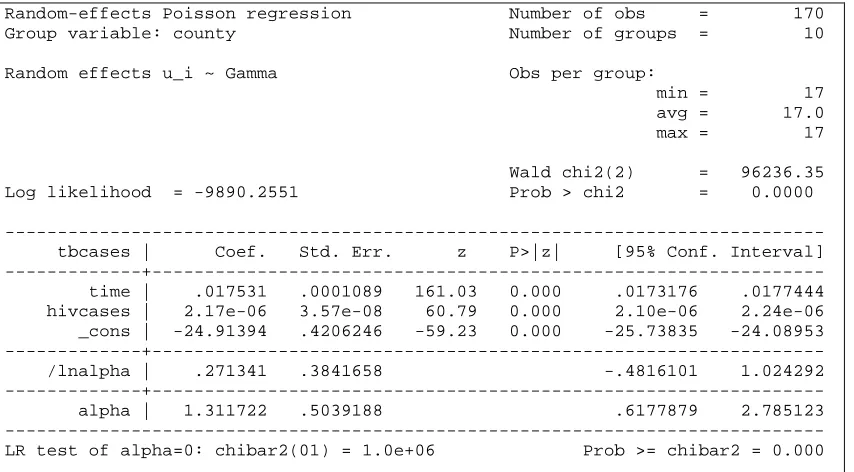
Table 2: Panel Poisson regression model with random effect
Random-effects Poisson regression Number of obs = 170 Group variable: county Number of groups = 10
Random effects u_i ~ Gamma Obs per group:
min = 17 avg = 17.0 max = 17
Wald chi2(2) = 96236.35 Log likelihood = -9890.2551 Prob > chi2 = 0.0000
21
Table 2 above random effect shows that there is a positive trend in TB cases in West African
countries (Time = 0.01753, P-value = 0.000) this implies that overtime as there is an increase in
the cases of TB and HIV. In addition HIV cases in West Africa react positively to TB cases in
West Africa (HIV cases = 2.17e-06 , P-value = 0.000) which also implies that as the number of
HIV cases increases so also the number of people living with TB increases. Having a negative
constant value (const = -24.91394, P-value = 0.000) simply shows that while there is no effect of
HIV case to TB case the expected number of cases tends towards negative meaning as the
number of HIV cases reduces the number of TB cases also will reduce or might likely tends
toward zero
Table 3: Panel Poisson regression model with conditional fixed effects
Conditional fixed-effects Poisson regression Number of obs = 170 Group variable: county Number of groups = 10
Obs per group:
min = 17 avg = 17.0 max = 17
Wald chi2(2) = 96232.19 Log likelihood = -9748.4505 Prob > chi2 = 0.0000
--- tbcases | Coef. Std. Err. z P>|z| [95% Conf. Interval] ---+--- time | .0175342 .0001089 161.06 0.000 .0173208 .0177475 hivcases | 2.17e-06 3.57e-08 60.75 0.000 2.10e-06 2.24e-06 ---
Table 3, above showing Poisson regression model with conditional fixed effects also show that
there is a positive trend in TB cases in West African countries (Time = 0.01753, P-value =
0.000) this implies that overtime as there is an increase in the cases of TB and HIV. In addition
P-22
value = 0.000) which also implies that as the number of HIV cases increases so also the number
of people living with TB increases.
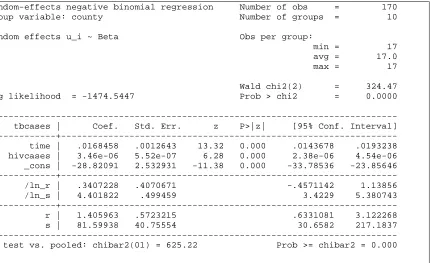
Table 4: Negative binomial panel regression with random effects.
Random-effects negative binomial regression Number of obs = 170 Group variable: county Number of groups = 10
Random effects u_i ~ Beta Obs per group:
min = 17 avg = 17.0 max = 17
Wald chi2(2) = 324.47 Log likelihood = -1474.5447 Prob > chi2 = 0.0000
--- tbcases | Coef. Std. Err. z P>|z| [95% Conf. Interval] ---+--- time | .0168458 .0012643 13.32 0.000 .0143678 .0193238 hivcases | 3.46e-06 5.52e-07 6.28 0.000 2.38e-06 4.54e-06 _cons | -28.82091 2.532931 -11.38 0.000 -33.78536 -23.85646 ---+--- /ln_r | .3407228 .4070671 -.4571142 1.13856 /ln_s | 4.401822 .499459 3.4229 5.380743 ---+--- r | 1.405963 .5723215 .6331081 3.122268 s | 81.59938 40.75554 30.6582 217.1837 --- LR test vs. pooled: chibar2(01) = 625.22 Prob >= chibar2 = 0.000
The above table 4: Negative binomial panel regression with random effects showed that there is
a positive trend in TB cases in West African countries (Time = .0168458, P-value = 0.000) this
implies that overtime as there is an increase in the cases of TB and HIV. In addition HIV cases in
West Africa react positively to TB cases in West Africa (HIV cases = 3.46-06 , P-value = 0.000)
which also implies that as the number of HIV cases increases so also the number of people living
with TB increases. Having a negative constant value (const = -28.82091, P-value = 0.000)
simply shows that while there is no effect of HIV case to TB case the expected number of cases
tends towards negative meaning as the number of HIV cases reduces the number of TB cases
23
Table 5: Negative binomial panel regression with Fixed effects.
.
Conditional FE negative binomial regression Number of obs = 170 Group variable: county Number of groups = 10
Obs per group: min = 17
avg = 17.0 max = 17
Wald chi2(2) = 314.37 Log likelihood = -1336.554 Prob > chi2 = 0.0000
--- tbcases | Coef. Std. Err. z P>|z| [95% Conf. Interval] ---+--- time | .0169554 .0012629 13.43 0.000 .0144802 .0194307 hivcases | 3.33e-06 5.67e-07 5.88 0.000 2.22e-06 4.44e-06 _cons | -29.03552 2.531087 -11.47 0.000 -33.99636 -24.07468 ---
Table 5, above showing Negative binomial panel regression model with fixed effects also show
that there is a positive trend in TB cases in West African countries (Time = .0169554, P-value =
0.000) this implies that overtime as there is increase in the cases of TB and HIV. In addition HIV
cases in West Africa react positively to TB cases in West Africa (HIV cases = 3.33e-06 , P-value
= 0.000) which also implies that as the number of HIV cases increases so also the number of
people living with TB increases. Having a negative constant value (const = -29.03552, P-value =
0.000) simply shows that while there is no effect of HIV case to TB case the expected number of
cases tends towards negative meaning as the number of HIV cases reduces the number of TB
cases also will reduce or might likely tends toward zero
Table 6: Log likelihood statistic for the Panel Models.
--- Panel Model | Log Likelihood
--- Poisson(Random Effect) | -9890.2551
24
Negative Binomial(Fixed Effect) | -1336.554
Table 6 above which is the log likelihood for Panel data with a Negative Binomial (fixed Effect)
of -1336.554 which is higher than the Negative Binomial (Random Effect) of -1474.5447.
Following that the Negative Binomial (fixed Effect) is higher we therefore conclude that Panel
Poisson regression model with fixed effect gave a better estimate.
6. Discussion of Findings
Over dispersion i.e (Variance > Mean) was found in both cases of TB and HIV. TB having a
mean of 44781.76 with a variance of 9498798561, while HIV has a mean of 37634.33 with
variance of 7640399712. This clearly showed that there is evidence of over dispersion of the data
set. It should be noted that this is happening because it is common with count data to have a
problem of over dispersion which implies that the observed variance is higher than the variance
of a theoretical model. This is common with count data (Famoye et al., 2004). This problem will
affect the Poisson regression negatively and will be corrected by the negative binomial
regression model. The prevalence rate of TB and HIV in Benin from 2000 to 2016, with the
highest rate of incidence cases in 2016 with a total of 6400 and 7931 cases recorded for TB and
HIV respectively. However between this 17years period TB and HIV were on the increase by
8.50% and 49.10% respectively. It should also be noted here that TB has been on oscillatory
trend as it have been oscillating between 5900 to 6400 within this period in the meantime HIV
been on a steady increment leading to 49.1% increment. The prevalence rate of TB and HIV in
Burkina Faso from 2000 to 2016 with the highest rate of incidence cases of TB in 2016 totaling
9400 cases while HIV recorded its highest count in 2000 with a total of 16040 and 36.22%
25
from 2000 to 2016. Leading to a downward trend in HIV while there is an upward trend in TB
over this period of time. The prevalence rate of TB and HIV in Gambia with the highest rate of
incidence cases of both TB and HIV recorded in 2016 to be 3500 and 2084 respectively.
However from 2000 to 2016 there have being a steady increase of 4.3% and 120.53% for TB and
HIV respectively. The prevalence rate of TB and HIV in Ghana with the highest cases of HIV
recorded between 2000 and 2005 with an increasing rate of 5.42% after which there was a
decline in case of 12.85% in HIV between 2005-2015 but between 2015 and 2016 it rose with
about 2.6% cases. However incidence cases of TB has been on a steady increase of 9.76% from
2000 to and 2010 and later showed a 2.22% decrease from 2010-2016. The prevalence rate of TB
and HIV in Guinea-Bussau with the highest rate of incidence cases recorded in 2016 to be 6800
cases. There was a steady increase rate of 78.95% in TB incident cases between 2000 and 2016 it
reveals and upward trend of the infection. Similarly HIV followed the same trend of upward
movement with the highest rate of incidence cases recorded in 2016 to be 4150 cases. There was
a steady increase rate of 144.69% in HIV incident cases between 2000 and 2016. The prevalence
rate of TB and HIV in Liberia with the highest rate of incidence cases recorded in 2014-2016 to
be 14000 cases in each year. There was a steady increase rate of 108.90% in TB incident cases
between 2000 and 2016 it reveals and upward trend of the infection. In the cases of HIV there
was an upward trend between 2000-2005, with a 7.10% increase rate but later between
2005-2016 there downward rate of 5.27% in HIV incident cases.The prevalence rate of TB and HIV in
Mali with the highest rate of incidence cases recorded in 2016 to be 10000 cases. There was a
steady increase rate of 17.65% in TB incident cases between 2000 and 2016 it reveals and
upward trend of the infection. Similarly HIV followed the same trend of upward movement with
26
increase rate of 40.73% in HIV incident cases between 2000 and 2016. TB in Niger has the
highest rate of incidence cases recorded in 2000 to be 22000 cases after which it maintained a
steady 19000 from 2004-2016 with a 13.63% decrease in TB incident cases between 2000 and
2016. Similarly HIV has been on the decrease of 22.35% between 2000 and 2016. The
prevalence rate of TB and HIV in Nigeria from 2000 to 2016, with the highest rate of incidence
cases in 2016 with a total of 407000 and 331400 cases recorded for TB and HIV respectively.
However between this 16years period TB and HIV were on the increase by 51.87% and 26.57%
respectively. The prevalence rate of TB in Sierria leone from 2000 to 2016, with the highest rate
of incidence cases in 2013-2016 with a uniform total of 2200 cases recorded. However between
this 16years period TB and HIV were on the increase by 57.14% and 149.69% respectively.
Table 2 above random effect shows that there is a positive trend in TB cases in West African
countries (Time = 0.01753, P-value = 0.000) this implies that overtime as there is an increase in
the cases of TB and HIV. In addition HIV cases in West Africa react positively to TB cases in
West Africa (HIV cases = 2.17e-06 , P-value = 0.000) which also implies that as the number of
HIV cases increases so also the number of people living with TB increases. Having a negative
constant value (const = -24.91394, P-value = 0.000) simply shows that while there is no effect of
HIV case to TB case the expected number of cases tends towards negative. This result is similar
to the findings of Askar (2008).
The analysis carried out using Poisson regression model with conditional fixed effects also show
that there is a positive trend in TB cases in West African countries (Time = 0.01753, P-value =
0.000) this implies that overtime as there is an increase in the cases of TB and HIV. In addition
P-27
value = 0.000) which also implies that as the number of HIV cases increases so also the number
of people living with TB increases (Njepuome and Odume, 2009).
The Negative binomial panel regression with random effects showed that there is a positive trend
in TB cases in West African countries (Time = .0168458, P-value = 0.000) this implies that
overtime as there is an increase in the cases of TB and HIV. In addition HIV cases in West
Africa react positively to TB cases in West Africa (HIV cases = 3.46-06 , P-value = 0.000)
which also implies that as the number of HIV cases increases so also the number of people living
with TB increases. Having a negative constant value (const = -28.82091, P-value = 0.000)
simply shows that while there is no effect of HIV case to TB case the expected number of cases
tends towards negative (Cajetan, et al., 2017).
Also Negative binomial panel regression model with fixed effects from the analysis also show
that there is a positive trend in TB cases in West African countries (Time = .0169554, P-value =
0.000) this implies that overtime as there is increase in the cases of TB and HIV. In addition HIV
cases in West Africa react positively to TB cases in West Africa (HIV cases = 3.33e-06 , P-value
= 0.000) which also implies that as the number of HIV cases increases so also the number of
people living with TB increases. Having a negative constant value (const = -29.03552, P-value =
0.000) simply shows that while there is no effect of HIV case to TB case the expected number of
cases tends towards negative (Cajetan et al., 2017).
In the overall, the Panel Negative Binomial regression Model (fixed) emerged as the superior
model for modeling TB and HIV cases in West African counties using the log likelihood statistic
28
7. Conclusion and Recommendations
This study concludes that trend of tuberculosis case in West Africa is increasing over time while
the increase in HIV cases leads to increase in Tuberculosis cases in West Africa. Lastly Panel
Negative Binomial Regression Model (Fixed effect) was superior in modeling TB and HIV cases
in West African countries. Based on the findings of this dissertation the following
recommendations are made
i. More efforts should be channeled toward Awareness campaign and education of patient
on the mode of transmission of TB and HIV across West Africa countries and
community particularly the rural areas.
ii. The medical sectors in West African countries should come up with a systematic
program aimed at maintaining and combating against the present situation of TB and
HIV in each of their respective countries.
iii. There should be a referral mechanism for patients suspected of having TB disease to be
investigated in the TB diagnostic centre and started on treatment, if indicated
iv. International organization and NGO’s should engage more in programmes geared to
TB/HIV collaboration
v. Environmental control programs should be put in place in most West African
communities by the government which will include the supply of Ultraviolet
germicidal irradiation.
29
References
Akinleye, O. M., Alo, O. G., Salami, O. O., Alaka – Coker, A. A., Idris M. G. and Onyeoghani N. (2015): Tuberculosis and HIV co-infection among patients attending directly observed treatment short course (DOTS) in Lagos, Nigeria. Archives of Applied Science Research, 2015, 7 (7):69-74
Andrzej, P., Marianne, J., Markus, S., Martins, E. R. and Gunilla, K. (2012): Tuberculosis and HIV co-infection. US National Library of Medicine National Institute of Health.
Askar, A. H. O. (2008): Tuberculosis and HIV Coinfection in two Districts in Sumaliland Academic Dissertation, University of Tampere.
Aweke, A. M., Zelalem, G. D., Essey, K. M. and Demeke, L. W. (2016): Prevalence and associated factors of TB/HIV co-infection among HIV Infected patients in Amhara region, Ethiopia, US National Library of Medicine National Institutes of Health16(2): 588–595.
Baltagi, B. (2011): Econometric analysis of panel data. New York, NY: Wiley.
Brosch, R., Gordon, S. V., Marmiesse, M., et al., (2002): “A new evolutionary scenario for the Mycobacterium tuberculosis complex,” Proceedings of the National Academy of Sciences of the United States of America, 99(6):3684–3689
Cajetan, C., Oyedumi, Issac, A., and Akwaja, K. (2017): Prevalence of Drug-Resistant Tuberculosis in Nigeria. A Systematic Review and Meta-analysis.
Cegielski, J. P., and McMurray, D. N. (2004): “The relationship between malnutrition and tuberculosis: evidence from studies in humans and experimental animals,” International Journal of Tuberculosis and Lung Disease, 8(3):286–298.
Chatterjee, D., Pramanik, A. K. (2015): Tuberculosis in the African continent: A comprehensive review: Pathophysiology. 2015 Mar;22(1):73-83. doi: 10.1016/j.pathophys.2014.12.005. Epub 2015 Jan 14.
De Cock, K. M., Soro, B., Coulibaly, I. M. and Lucas, S. B. (1992): “Tuberculosis and HIV infection in sub-Saharan Africa,” Journal of the American Medical Association, 268(12):1581–1587
Evans, D. B., and Etienne, C. (2010): “Health systems financing and the path to universal coverage,” Bulletin of the World Health Organization, 88(6):402
Gehre, F., Kumar, S., Kendall, L., et al (2016): A Mycobacterial Perspective on Tuberculosis in West Africa: Significant Geographical Variation of M. africanum and
30
Greene, W. (1997). Econometric analysis. Upper Saddle River, NJ: Prentice Hall.
Houben, R. M., and Dodd, P. J (2016): The Global Burden of Latent Tuberculosis Infection: A Re-estimation Using Mathematical Modelling. PLoS Med. 2016 Oct 25;13(10):e1002152. doi: 10.1371/journal.pmed.1002152. eCollection 2016 Oct.
Kennedy, P. (2008). A guide to econometrics. Malden, MA: Blackwell.
Laura, B. N., Kieran, R., Sally H. and Jon S. F. (2018): Multidrug-resistant tuberculosis adherence in migrants: a systematic review and meta-analysis. BMC Medicine201816:27
Matteelli, A., Centis, R., D’Ambrosio, L.and Migliori, G. B. (2012): Multidrug- resistant tuberculosis today: Bull World Health Organ. 2012 Feb 1; 90(2): 78.
doi: 10.2471/BLT.11.097360
Migliori, G. B., De Iaco, G., Besozzi, G., Centis, R. and Cirillo, D. M. (2007): “First tuberculosis cases in Italy resistant to all tested drugs,” Eurosurveillance, 12,(20):20,Article ID E070517.1.
Musa, B. M., Adamu, A. L., et al. (2017): Trends in prevalence of multi drug resistant tuberculosis in sub-Saharan Africa: A systematic review and meta-analysis: PLoS
One. 2017; 12(9): e0185105. Published online 2017 Sep
25. doi: 10.1371/journal.pone.0185105.
Njepuome, N. and Odume, B. (2009): The Impact of HIV Syndromes on the treatment of TB cases in Gombe State, Nigeria. Mera African Journal of Respiratory Medicine, 16-20
Parsons, L. M., Somoskövi, Á., Gutierrez, C., et al.,( 2011): “Laboratory diagnosis of tuberculosis in resource-poor Countries: challenges and opportunities,” Clinical Microbiology Reviews, 24(2): 314–350.
Paul, C., Claire. C., et al. (2010): The choice between Fixed and Random effect models: Some considerations for Educational Research.
Pimpin, L., Drumright, L. N., et al (2011): Tuberculosis and HIV Co-infection in European Union and European Economic Area Countries. European Respiratory Journal, 38: 1382-1392.
Pontali, E., Pasticci, M. B., Matteelli, A., Baldelli, F. and Migliori, G. B. (2011): Tuberculosis and HIV co-infection: Do we have a Surveillance System in Europe. European Journal 2011 38: 1258-1260 Do1:10.1183/09036.00413111.
31
Velayati, A. A., Masjedi, M. R., Farnia, P. et al., (2009): “Emergence of new forms of totally drug-resistant tuberculosis bacilli: super extensively drug-resistant tuberculosis or totally drug-resistant strains in Iran,” Chest, 136(2): 420–425.
Wiktor, S. Z., Sassan-Morokro, M., Grant, A. D., et al., (1999): “Efficacy of trimethoprim -sulphamethoxazole prophylaxis to decrease morbidity and mortality in HIV-1-infected patients with tuberculosis in Abidjan, te d'Ivoire: a randomised controlled trial,” The Lancet, 353(9163):1469–1475,.
World Health Organization, (2007): “The world health report 2007: a safer future: global public health security in the 21st century,” WHO Document WA 530. 1., WHO, Geneva, Switzerland, 2007
World Health Organization, “The global burden of disease: 2004 update,” WHO Document W 74, World Health Organization, Geneva, Switzerland, 2008.
World Health Organization, “Molecular line probe assays for rapid screening of patients at risk of multidrug-resistant tuberculosis (MDR-TB)," World Health Organization, Geneva, Switzerland,” 2008.
World Health Organization, “Guidelines for the programmatic management of drug-resistant tuberculosis: emergency update 2008,” Tech. Rep. WHO/HTM/TB/2008. 402, WHO, Geneva, Switzerland
World Health Organization, “The global burden of disease: 2004 update,” WHO Document 74, World Health Organization, Geneva, Switzerland, 2008.
World Health Organization,: “Strategie de cooperation de l’OMS avec les pays, 2009– 2013. République de Côte d’ivoire,” WHO Document WA 540 HC7, World Health
Organization, Brazzaville, Congo, 2009.
World Health Organization, “Global tuberculosis control: report 2009,” Tech. Rep. WHO/HTM/TB/2009. 411, WHO, Geneva, Switzerland, 2009.
World Health Organization, “Global tuberculosis control: report 2010,” Tech. Rep. WHO/HTM/TB/2010. 7, WHO, Geneva, Switzerland, 2010.
World Health Organization, “Global tuberculosis control: key findings from the December 2009 WHO report,” Weekly Epidemiological Record, 85(9): 69–80, 2010.
World Health Organization, “Global tuberculosis control: report 2011,” Tech. Rep. WHO/HTM/TB/2011. 16, WHO, Geneva, Switzerland, 2011.
32
World Health Organization, “Global Tuberculosis report” 2017. World Health Organization, “Who/regional office for Africa” (2017): https://www.afro.who.int/health
-topics/tuberculosis-tb
World Health Organization, Tuberculosis and HIV (2019),