103
Determinants of Electricity Consumers Satisfaction in Selected Electricity
Distribution Zones in Nigeria: Implications for Regulatory Activities
Abdullateef Usman
Department of Economics, University of Ilorin, Ilorin, Nigeria
Abstract
All over the world customers’ satisfaction has become a veritable tool for measuring organizational performance and relevance. This is the motivation for the investigation of determinant of consumers’ satisfaction in a service sector that has enjoyed state monopoly for a considerable length of time in Nigeria- the electricity sector. This paper therefore focused on the determinants of electricity consumers’ satisfaction in selected electricity distribution zone in Nigeria. To achieve the objective, the paper designs a scheme for evaluating customer’s satisfaction with a view to determine their level of satisfaction and in the process compute satisfaction index. The paper observed that consumers are at corner solution until the unbundling of the sector into DISCOs. It employed the Fussy Entropy to identify three classes of determinants of consumers’ satisfaction. The resulting indexes of consumers’ satisfaction shows that the consumers are not satisfied with the services of the DISCO. The paper concludes with policy recommendation to all stakeholders.
Keywords:Consumers, Electricity distribution, Index of satisfaction
Introduction
1There is little exaggeration in the statement that consumers are to the business firms, what the church square was to the medieval
1Corresponding author’s email:
Note: This paper is the product of the NERC 2012
Fellowship Project fully funded by the Nigeria
Electricity Regulatory Commission
civilization. In this era of alternative windows of opportunity, the customers’ satisfaction has become an important variable in service delivery. This explains why the psychology of the consumers carried a deep thrust in the behaviour of service providers; even those who enjoy state monopoly frequently make concerted efforts to see the consumer as the king. Although there is little or no competition in the provision of electricity, effective monitoring of customer satisfaction is a precondition for
Journal of Asian Business Strategy
104 winning market competition and gaining customers acceptance. Available evidence attests to the fact that the customers of the PHCN have not had it any better in spite of the enormous public investment in the power sector.
Industry players have attributed the dismal performance of the sector to bundling of the sector and have accordingly called for its unbundling. Others have attributed it to the enjoyment of state monopoly and have accordingly called for privatization. In response to the clarion calls the government not only unbundled but also privatized. There is therefore the need to identify the customers, their experiences with service satisfaction, evaluate the problems and use the result of the evaluation to assess the performance of service providers.
All over the world customers’ satisfaction has become a veritable tool for measuring organizational performance and relevance. This explains why many countries established customers’ satisfaction degree otherwise known as Customers Satisfaction Indexes (CSI). The customers’ satisfaction degree is established for trade, commerce and industry from the view point of consumers as different from the producers’ measure of consumer loyalty and acceptance. For instance in America, we’ve America Customers Satisfaction Index (ACSI) while in Sweden we’ve Swedish Customers Satisfaction Index (SCSI). In Europe we’ve European Customers Satisfaction Index (ECSI).
In Nigeria it is unlikely that such indexes exist and where it exists, it has not received adequate relevance and may be at firm marketing level to determine sale performance through customer re-purchase. Expectedly, government regulatory institution, such as Standard Organization of Nigeria (SON), Nigeria Communication Commission (NCC) and the Nigeria Electricity Regulatory Commission (NERC) similar public regulatory institutions are supposed to come up with such indexes. This is the driving force for this paper. The main focus of this paper is therefore to determine the indicators of electricity Consumers Satisfaction in selected electricity distribution zones in Nigeria. Other objectives will include: -
1). Develop a scheme for evaluating customer’s satisfaction with a view to determine their level of satisfaction with the services of Electricity Distribution Companies (DISCOs).
2). In light of the findings suggest measure that will enable the distribution companies to serve her customers in consonant with international best practice.
105 satisfaction index as means of benchmarking the performances of the service providers and discussed the results obtained. In Section V, the study presents the summary conclusion and the way forward.
Review of Literature
An Overview of Electricity Production and Distribution in Nigeria
The Nigerian economy is an energy driven one since the pre-colonial era unlike many other developing economies along the West African Coast. . This is because electricity has remained the driving force behind all the developmental activities which revolves around industrial, commercial and household purposes. Electricity generation in Nigeria began in 1896, fifteen years after its introduction in England. The Nigeria Electricity Supply Company (NESCO) commenced operations as an electric utility company in Nigeria in 1929 with the construction of hydroelectric power station at Kura near Jos. The Electricity Corporation of Nigeria (ECN) was established in 1951, while the first 132KV line was constructed in 1962, linking Ijora Power Station to Ibadan Power Station. But shortly after independent, in 1962 the scope of electricity production had expanded to include Kainji electricity dam. By 1988, the National
Electric Power Authority (NEPA) was partially commercialized, supported by an upward review in tariffs. As part of the restructuring effort of the power sector, the Electric Power Sector Reform Act 2005 was enacted. Consequently, the defunct National Electric Power Authority (NEPA) was renamed as the Power Holding Company of Nigeria (PHCN). The law paved the way for the unbundling of NEPA into the 18 companies – 6 power generation companies, 1 transmission company and 11 distribution companies.
Nigeria has approximately 6,861 megawatts (MW) of installed electric generating capacity but at present electricity generation ranges from between 2,500 megawatts to about 3,000 even with the inclusion of three gas-powered independent power projects in the Niger Delta region. Thus, making power outages to be frequent as the power sector operates well below its estimated capacity. At policy making level, successive governments in Nigerian have made tireless effort to encourage foreign private investment in the power sector by commissioning Independent Power Production (IPP) to generate electricity and sell it to PHCN. Table 2.1 below is a mirror of the dividends of such efforts.
Table 2.1 Independent Power Productions, Location and Installed Capacity
Name License Type Site Location Capacity
Aba Power Ltd Distribution Aba, Abia State
106
Name License Type Site Location Capacity
Alaoji Generation Co. Ltd
(NIPP) Generation on-grid Alaoji,Abia State 1074MW
Anita Energy Limited Generation on-grid Agbara, Lagos State 90MW Azura Power West Africa Ltd Generation on-grid Ihovbor Benin,Edo State 450MW Bresson Nigeria Ltd Generation on-grid Magboro, Ogun State 60MW
CET Power Projects Ltd. Generation off-grid WAPCO Ewekoro, Ogun
State 6MW
CET Power Projects Ltd. Generation off-grid Tinapa, Cross River State 20MW
CET Power Projects Ltd. Generation off-grid Nigerian Breweries Limited,
Iganmu, Lagos 5MW
CET Power Projects(Sagamu) Generation off-grid WAPCO Sagamu, Ogun
State 7MW
Contour Global Solutions (Nig)
Ltd Generation Off-Grid NBC Bottling Plant, Ikeja 10MW Contour Global Solutions (Nig)
Ltd Generation Off-Grid NBC Bottling plant, Apapa 4MW Coronation Power and Gas
Limited Generation off-grid Sango Otta 20MW
Delta Electric Power Limited Generation on-grid Oghareki ,Etiope West LGA 116MW DIL Power Limited Generation on-grid Obajana, Kogi State 135MW Eleme Petrochemical Company
Limited Generation On-grid Eleme Complex, P.H Rivers 135MW Energy Company of Nigeria
(NEGRIS) Generation on-grid Ikorodu, Lagos State 140MW Source: www.nercng.org
From the table above the IPPs can be classified into two, the on-grid and the off-grid generation. In all there are ten (10) on- grid generations, contributing two thousand, five hundred and seventy (2570) MW and there are seven (7) off-grids generation contributing eighty-five (85) MW, making a total of (2655) MW. The involvement of the IPP will not only increase the availability of electricity, it still stimulates efficiency in the electricity industry. However, the existing evidence does not support this expectation and this is because as at January 2013 the industry has just realized only about 4, 500mw of the target date.
Consumers Satisfaction: Conceptual and Theoretical Framework
107 Consumers’ satisfaction. This is because the concept is a function of space and time as well as the perspectives of the researcher’s discipline. One definition that aptly summarizes the concept was given by Yi (1990) and reported by Te-King Chien, et al (2002) as evaluation symbolizing a consuming experience resulting after a product or service has been used. More specifically is the reaction between expectation and actual perception before, during and after using the product or service. No one particular factor can affect this perception but the entire experience.
This explains why Wong (2000) believed that Consumers’ total satisfaction is an emotional perception, which is premised on the evaluation of customer’s reaction from using the product or service. In this connection CS then become a total satisfaction that leaves a good perception. More important is the view of Martesen et al (2000) that expectation is the key to CS. In summary, CS could be explained to mean a satisfying feeling towards expectation after the customer has accepted the entire quality or service. This definition as comprehensive as it may look like, it is not only limiting but also failed to take into consideration other aspects of the product or service that can serve as the drivers of consumers’ satisfaction.
In literature there are many measures of economic performance, but prominent among these measures are the objective measures and subjective measures. Since the enthronement of market economy, economists have become increasingly
interested in the evaluation of economic performance after the transition. The evaluation has been premised on two major requirements:
i. The goals of the economic system and
ii. The measurements of variables representing these goals,
To determine the extent to which these goals have been achieved, the first step is to know and get familiar economic indicators such as Gross National Product (GNP) and related concepts on the output side, or labor force participation and investment rates on the input side. Consumers' living costs are estimated with the aid of the Consumer Price Index. These economic indicators monitor economic processes at regular intervals. No doubt, these indicators provide valuable information about how well the economy performs.
108 the goods and services. With a given income distribution it is quite conceivable that a price structure results which provides essentials to the poor in far too small amounts, and luxuries to the rich in relative abundance. An increase in the output of luxuries may result in an upward movement of the objective economic indicators, suggesting an improvement in social welfare; while by many social norms, and in the perception of most people, the change would not necessarily be considered desirable.
Imperfections in the market are however, the rule rather than exception. This means that the "feedback action" of the market is considerably weakened. The prevailing price structure is influenced by differential power, special skills in bargaining, and a variety of factors extraneous to true demand. While the objective economic indicators are thus measurable at least in principle, they may not satisfy the first requirement of an evaluative theory of the welfare economy, since they fail to measure what the actual goals are. Therefore, considerable attention has to be given to the development of subjective measures which provide the basis for determination of an index for measuring the consumers’ satisfaction.
Empirical literatures have been detail enough to shed clear light on the determinants of consumers’ satisfaction. A number of approaches have been employed to unveil the dominant and recessive factors. The common approaches include the product-based by Garvin (1984); the user-product-based approach pioneered by Juran (1974); the
manufacturing approach by Crosby (1979) and the value-based approaches provide rationale.
109 product quality is been define as the relationship between quality with performance at an acceptable or affordable price. Always product quality is being thought to contribute to the expansion of competitive advantage whereas the product is to be designed and also manufactured to achieve customer requirements in enhancing the product performance (Benson et al., 1991; Flynn et al., 1994).
Product attributes has become products quality’s view where in operations management, multiple dimension of quality has been determine which has resulted in the fitness usage of the product. It is observable that no one approach is capable of bringing out all the relevant and possible drivers of consumers’ satisfaction (Shaharudin et al 2012) and no one study employed two approaches. This explains why we have
used the evidences provided by empirical literature to combine three of the approaches, namely the user-based; the value-based and the product-based come-up with drivers, which aptly measure the perception of consumers.
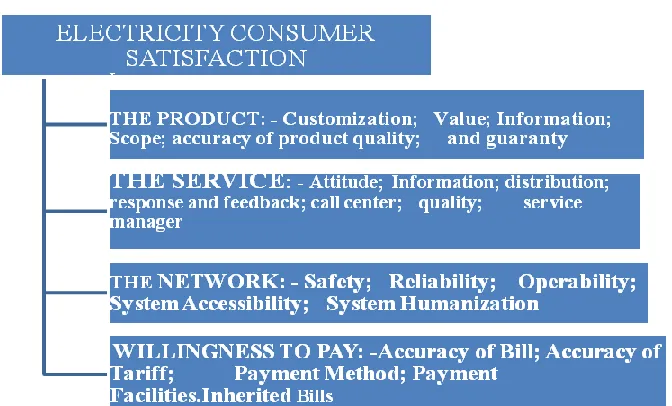
The main purpose of the study is to determine the indicators of electricity consumers’ satisfaction with a view to generate index of consumers’ satisfaction using modern psychometric techniques--particularly non-metric scaling techniques. These indicators may serve the needs of government charged with the task of providing the citizens the standard for gauging and regulating the market for enhanced performance. Figure 2 below is the flow chart of the drivers of consumers’ satisfaction.
110
Methodology
The basic model of the consumers’ satisfaction model presented above can be modified to reflect product specificity. In this study the model has been expanded to include some industry specific variables like Continuity of service, Professionalism, and Responsiveness. Other industry specific variable will include service breakdown, voltage fluctuation, notification of breakdown, restoration of breakdown, metering preference, identification of meter reader, timely reading of meter, administration, protection of the environment, disturbances to the environment, etc. The model adopted in this study has thirteen (13) variables and each of the variables was described by five drivers.
Nature, Sources and Instrument for Data Collection
A study of this nature requires identification and categorization of target respondents in cross sectional manner for the purpose of data collection. Cross sectional data were obtained from selected samples of customers of PHCN in the Abuja electricity distribution zone. This is essentially a micro-data for which only carefully designed instrument will be applicable. To this end a close-ended pre-coded questionnaire that is fashioned on the Likert Attitudinal Scale of 5 was designed. This is principally to ensure comparability. This method is objective for
the weight of index is larger when the value of the same index on different object varies significantly this is because such index is high in resolution and this reflect more information, which means it is more useful in distinguishing the objects.
The specific variables addressed under each of the satisfaction index include but not limited to continuity of service, service breakdown, voltage fluctuation, notification of breakdown, restoration of breakdown, information on power break, metering preference, consumption metering, identification of meter reader, number of times reading of meter, administration, protection of the environment, disturbances to the environment, Others include possibility of modifying the amount to be paid, complaint channels, personalized service, call center, customer service via the internet, email postal and fax, newsletter.
Sampling Technique and Sample Size A study of customer satisfaction is normally on a nation-wide scale unless otherwise indicated by way of restriction to only the serve-market. No doubt, this will not only be expensive but also too wooly for an effective coverage. A representative sample will however solve the problem. In this connection; this study employed multi stage sampling technique to ensure that the sample finally selected did not erode the facts of the study.
111
Table 3.1: Customer Base of Abuja Electricity Distribution Zone
Type Number of
Customers Percentage Distribution
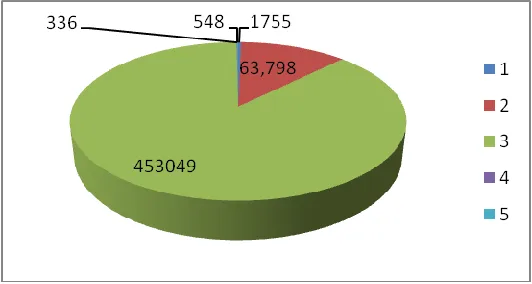
Industrial 1,755 0.338
Commercial 63,798 12.28
Residential 453,049 87.21
Government 336 0.064
Special 548 0.105
Total 519,486 100
Source: National Bureau of Statistics, 2012
Figure 3.1: Distribution of Registered Customers in Abuja Electricity Distribution Zone
There are 21 Business Units (BU) in Abuja Electricity Distribution Zone and has a total 519,486 registered consumers. This is the sample space for this study. The first stage is to select the BU and five BUs were selected to include Makurdi, Kubwa Suleja Minna, and Bida, The second stage is the selection of the sample size. According to the law of statistical regularity, and the law of inertial of large numbers, (Whitt Ward, 2002) a 0.05% (25,974) must be selected for the sample to be stable, but for logistics reasons, only 5,195 respondents, representing about 20 percent of the stable sample size using the Systematic First Seen First Captured (SFSFC) random sampling.
Method of Evaluation
112 Identification of Electricity Customers.
By description Consumers of electricity comprises of individuals/ households, business firms / industries, and producers of government goods / services who power their domestic and commercial activities with electricity supplied by the PHCN. This is in contrast to customers who have used and paid for the electricity services in the last twelve (12) months. The customers were identified in terms of space, scope and scale. When viewed in terms of space and location, two main groups were identified, i.e. urban consumers / rural consumers. In terms of scope, we can identify four main groups, i. e. residential users, commercial users, industrial users and Government. When viewed in term of scale of operation, we can identify four main groups, i. e. Large scale, Medium scale, Small scale, and Micro scale. Each of these groupings has implication for pricing discrimination and product distribution.
Measurement of Variables
For the purposes of the study, ‘a consumer’ is defined as “people (18+) who has used the service in the past 12 months”. No attempt was made to differentiate between a consumer and a customer because such an exercise is not likely going to cause a change in the perception of our respondents. ‘Satisfaction’ was defined as “the
consumer’s assessment of a product or service in terms of the extent to which that product or service has met his/her needs or expectations”. Consumer satisfaction was measured both directly (‘observed satisfaction’) and after the responses to specific questions were statistically processed (‘calculated satisfaction’). Satisfaction was measured on scale of 5 and this means that if a consumer assigns a variable a score of 5, it usually means that they are very satisfied with the variable. There are thirteen (13) principal variables, each of which is explained by five (5) drivers of consumer satisfaction, including common and specific items adapted for each sector variables. Respondents were asked to rank or tick as the case may be, to reveal their perception of each of the variables in relation to drivers of consumer satisfaction variables.
Data Analysis and Discussion
In this study there are two classes of variables, namely Customer related and product related. The customer related information is summarized in tables (3) while the product related data are summarized in fourteen tables 4-21. The Customer related information is put in place with the view of matching Customers with the product. These are presented in the tables below.
Table 4.1: Residential Respondents Biometrics Characteristics
Gender No % Household Head No %
Male 3,195 61.50 Male 2,285 71.51
Female 2,000 38.50 Female 1,910 95.4
113 Table 4.1 above is the biometrics of the sampled respondents. 5,195 responses were obtained from 3,195 males and 2000 from Female. Of the 3,195 male respondents 2, 285 (representing 71.51%) were household head while out of the 2000, respondents, 1,910 (representing 95.5 %) were household head. By definition a customer is one who backs up product demand with financial commitment. The household heads are the real customers of the electricity distribution companies, by their expression of preference and actual purchase of the products.
The Product
The product (P) was defined by five principal exogenous variables (factors). They are the quality (Q), value (V), information (N), guarantee (G), and scope
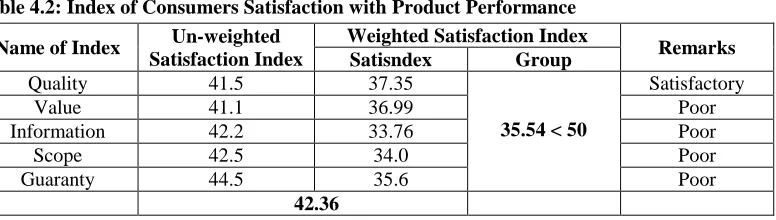
(S). The overall un-weighted satisfaction index is about 42.36, while the weighted index is 35.54 for the product (electricity as supplied by the DISCO). The implication of these statistics is that the product being presented to consumers is not in accordance with the international best practice. When compared with the similar institutions in the countries of equal rating with Nigeria, the results show a wide variation. For instance in Ghana, the product is rated in terms of quality as 79 % high, while in India, it is 73 %. Table 4 below is the computed index of consumers’ satisfaction with respect to all the attributes of the product. (See table 4 below)
Table 4.2: Index of Consumers Satisfaction with Product Performance Name of Index Un-weighted
Satisfaction Index
Weighted Satisfaction Index
Remarks Satisndex Group
Quality 41.5 37.35
35.54 < 50
Satisfactory
Value 41.1 36.99 Poor
Information 42.2 33.76 Poor
Scope 42.5 34.0 Poor
Guaranty 44.5 35.6 Poor
42.36
Source: Authors Estimation 2012
Service Delivery
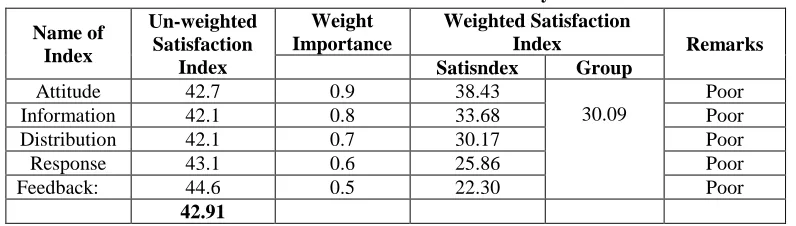
The drivers of service delivery are defined to include, Attitude (T), Response (R), Information (N), Distribution (D), and Feedback, (F). 4.5% ranked of valid respondents have rated the attitude of service provider as best,4.2% ranked it as better, 12.2% ranked it as good,18.5% ranked it as satisfactory and 60.7% ranked it as poor. With respect to information
114 providers,3.0% ranked their experience as best, 5.5% regarded it as better,10.7% regard as good,20.7% regard it as satisfactory while 60.1% regard it as poor.
With respect to feedback, 3.7% regard their experience as best,2.5% regard it as better, 7.4% regard it as good,15.5% regard it as satisfactory and 70.9% regard it as poor.
Table 4.3: Index of Consumers Satisfaction with Service Delivery Name of
Index
Un-weighted Satisfaction
Index
Weight Importance
Weighted Satisfaction
Index Remarks
Satisndex Group
Attitude 42.7 0.9 38.43
30.09
Poor
Information 42.1 0.8 33.68 Poor
Distribution 42.1 0.7 30.17 Poor
Response 43.1 0.6 25.86 Poor
Feedback: 44.6 0.5 22.30 Poor
42.91
The overall un-weighted satisfaction index is estimated to be 42.92 while the weighted index is 35.19. This is far below any known average. Table 4.3 shows the estimated index of consumers’ satisfaction.
The Network
The drivers of the electricity supply ‘network’ are safety, reliability, operability, system accountability and system friendliness. The respective un-weighted indexes are contained on table 6 above. The average un-weighted index is 41.14, while the weighted group average is 33.56. The
variable describing the network is safety, which is least index in both groups. There is therefore a strong indication that the network is not safe. This may be so as revealed by the respondents, the network of overhead cable presents a horrific picture over the landscape. This is accentuated by threat of other equipment (e.g. transformers) to the environment. Consumers’ expectation is far more that the current situation and when compared with the international best practice it is sub-optimal.
Table 4.4: Index of Network Characteristic: - Residential Customer
Name of Index Un-weighted Satisfaction Index
Weighted Satisfaction
Index Remarks
Satisndex Group
Safety 38.4 34.56
33.56 < 50
Satisfactory
Reliability 42.3 33.84 Poor
Operability 41.2 32.96 Poor
System Accountability
41.3 33.04 Poor
System Friendliness 42.5 34.00 Poor
41.14
115 Willingness to Pay
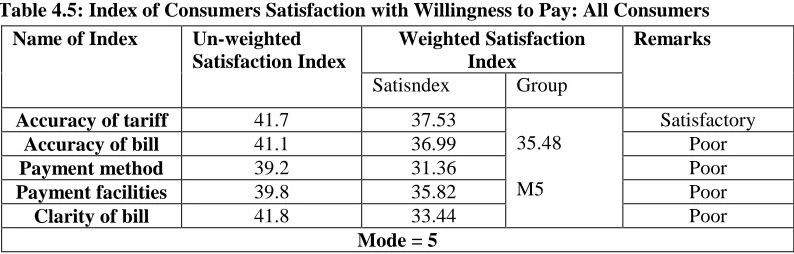
Unlike the earlier endogenous variables, the willingness to pay is here measured by six classes of exogenous variables. They are accuracy of tariff (AT), accuracy of the bill (AB), payment method (PM), payment facilities (PF) and clarity of bills (CB), and inherited bills (IB).The inclusion of the inherited bill was initially an error but it has made it possible for the study to isolate the inherited bill as special problems and concern to consumers, especially as it relates to liability. One of the major drivers of willingness to pay is the accuracy of the tariff. The index of consumers satisfaction with tariff is estimated at 41.7 while the accuracy of the bil1 41.1 on a scale of 100.
Respondents are generally not satisfied with the payment method, as indicated by index of 39.2.00 on a scale of 100. There are two known payment methods, namely payment after consumption (post paid), and payment before consumption (prepaid). These two have been affected by the Payment facility with an index of39.8. Respondents are also not satisfied with clarity of bill as indicated by the index of 41.8. The overall un-weighted satisfaction index is estimated to be 40.72 while the weighted is measured at 35.48. Neither the weighted nor the weighted is significant. This is another evidence of the inability of the Abuja electricity distribution zone to serve the customer better.
Table 4.5: Index of Consumers Satisfaction with Willingness to Pay: All Consumers Name of Index Un-weighted
Satisfaction Index
Weighted Satisfaction Index
Remarks Satisndex Group
Accuracy of tariff 41.7 37.53
35.48
M5
Satisfactory
Accuracy of bill 41.1 36.99 Poor
Payment method 39.2 31.36 Poor
Payment facilities 39.8 35.82 Poor
Clarity of bill 41.8 33.44 Poor
Mode = 5 Source:Author’s Estimation 2012
The general Index of Willingness to pay is very weak. This is shown from the group index (40.72) that is below 50 on a scale of 100. All other drivers of satisfaction, except accuracy of tariff were rated by respondents as being poor. The implication of this is that majority of consumers have good knowledge of the Multi Years Tariff Order (MYTO) and
since there is no dispute over tariff, the index should not be just barely satisfactory. Thus, in summary, from all indicators of quality of service, the respondents view the services as merely satisfactory while most consider it as unsatisfactory or poor quality of service delivery.
116 Table 4.6: Current Metering System: All consumers
Current Meter System Frequency Ranking Weighted Satisfaction
Index Group
Pre-paid 1,630 2 (4) 3 (M1) Less than
5 Pay as consumed (Credit) 1,820 1(5) 2.8 (M3)
Metered but Estimation 1,300 3 (3) 3.84 (M5)
No Meter but Estimation 440 4(1) 3.84 (M4)
M = Mode
This is a direct ranking exercise which will involve two classes of consumers, namely, the metered consumers, the unmetered consumers, With respect to this, 31.4% of the respondent uses prepaid meter. This is a sizeable proportion of the consuming
respondent. 35.06 % of the respondents are currently on credit meter, while 25.04 % of the metered respondents have been on the estimation since hooking up to the PHCN services. 8.4 % of the respondents are not metered
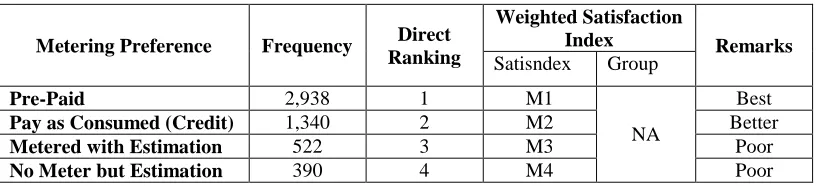
Table 9: Metering Preference: All Consumers
Metering Preference Frequency Direct Ranking
Weighted Satisfaction
Index Remarks
Satisndex Group
Pre-Paid 2,938 1 M1
NA
Best
Pay as Consumed (Credit) 1,340 2 M2 Better
Metered with Estimation 522 3 M3 Poor
No Meter but Estimation 390 4 M4 Poor
Source: Author’s Estimation 2012
Metering Preference
56.66 % Consumers revealed their preference for prepaid metering system. From this 67.1% rank it as best, 9.9% ranked it as better, and 6.1% ranked it as good, while 4.7% of this category of consumers ranked it as satisfactory and 11.7% ranked it as poor. If compared with those who
revealed their preference for credit meter, we have 34.7% of respondents preferred credit meter to pre-paid meter). From this 50.8% ranked it as best,12.3% ranked it as better,7.4% ranked it as good,9.8% ranked it as satisfactory and 19.7% ranked it as poor. The overall satisfaction index is 31.83.
Table 4.7: Index of Consumption Satisfaction with Credit Meter
Name of Index Un-weighted Index
Weighted Index
Remarks Satisndex Group
Identification of Meter Reader 35.8 17.9
17.21 < 50
Poor
Frequency of Meter Reading 38.0 19.0 Poor
Adequacy of reading 39.9 15.96 Very Poor
Adequacy of Classification 39.9 15.96 Very Poor
38.4
117 From table 4.7, only four drivers of satisfaction were identified, (identification of meter reader; frequency of meter reading; adequacy of reading and adequacy of classification). the index of identification of meter reader was computed to be 35.8 ; the index of frequency of meter reading was
38.0 while the index of adequacy of reading and index of adequacy of classification ,were estimated at 39.9 and 39.9 respectively The overall un-weighted satisfaction index is 38.4 and the weighted index is 17.21. The driving indexes are adequacy of reading and classification.
Table 4.8: Consumers Perception of Pre-paid Meter
Name of Index Un-weighted
Index Ranking
Weighted Ranking
Index Remarks
Satisndex Group Avoidance of
Large unpaid bill
Average 2.26 (
M1) 4 (1) 22.1
59.9 = 60
Not so important Easy resolution
of disputes
Average 2.42
(M1) 2 (3) 72.6 Better
Monitor their consumption
Average 2.47
(M1) 1 (4) 98.8 Best
Budget in advance to cater for surprise bill
Average 2.31
(M1) 3 (2) 46.2 Good
Source: Author’s Estimation 2012
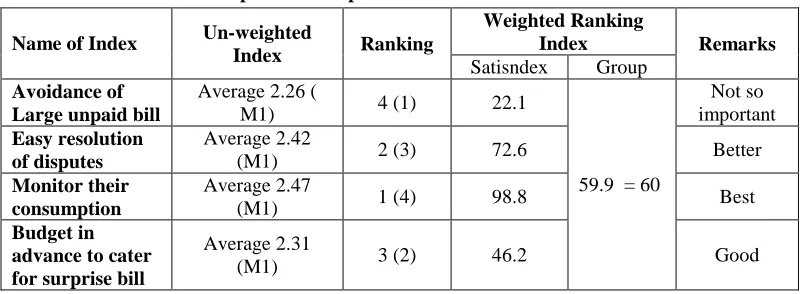
The most important reasons for the preference for the prepaid meter is the need to monitor consumption occasioned by the need to conserve energy. Where there is dispute respondents were of the view that prepaid meters makes easy to resolve such disputes. In any case there may be no disputes, as there may be no unpaid bill. This is shown by the weighted ranking index of 9.88/10 or 98.8/100. The overall index of consumers’ satisfaction with pre-paid meter is 60.00 on a scale of 100. This is an indication that consumers are better serve
with pre-paid as it not only eliminates estimation billing, but also prevents accumulation of debts by consumers.
Responsiveness
Table 4.9 presents the index of consumer satisfaction with respect to responsiveness of service provider to new customers, defined to be a function of five classes of variables namely: Registration (RE), Pre-connection (PC), Connection (CO), Post –connection (PO) and Supply interruption (SI). The index is here presented on table 4.9.
Table 4.9: Index of Consumers Satisfaction with Responsiveness
Name of Index
Un-weighted Index
Weighted Index
Remarks Satisndex Group
Registration 35.1 31.59
34.01 <
Barely Satisfactory Pre-connection
inspection 39.8 35.82
118
Connection 38.3 34.47 50 Poor
Post Connection Visit 42.2 33.73 Poor
Supply interruption 43.4 34.72 Poor
GROUP = 34.01
Source: Author’s Estimation 2012
The un-weighted indexes averaged 39.76 while the weighted index is estimated at 34.01. This is understandable in view of unwarranted agency intervention in the process of subscription to power supply. In
particular, the activities of Licensed Electrical Contractors Association of Nigeria (LECAN), who are involved in the registration process, create undue delay and extortion.
Professionalism
Table 4.10: Index of Consumers Satisfaction with Professionalism: New Customer Name of Index Un-weighted
Index
Weighted Index
Remarks Satisndex Group
Fault Detection 39.3 35.37
38.27
Mode is 5, Indicating poor service delivery.
Fault Reportage 38.0 43.2
Fault Clearance 42.5 38.25
Timing 43.7 39.33
Follow up service 44.0 35.20
Source: Author’s Estimation 2012
Five drivers of professionalism have been identified in literature. They are fault detection (FD), fault reportage (FR), fault clearance (FC), timing (TM), and follow-up services (FS). The index of satisfaction with fault detection is estimated at 39.3, while the index of fault reportage is 38.4. The index of fault clearance is 42.5, while the index of
timing is, 43.7. The index of follow up service is 44.0. This is about the highest for this group and yet not a satisfactory index of performance. The overall weighted index of consumers’ satisfaction is 37.36.while the un-weighted is 41.5, both of which are below the acceptable minimum. This is an index of technical capability of the service provider.
Table 4.11: Index of Continuity of Service: All Consumers
Name of Index Un-weighted Index
Weighted Index
Remarks Satisndex Group
Service Bre4akdown 41 36.90
35.34 (M5)
The Mode is 5 = Poor Service
Delivery Notification of
Breakdown 41 33.78
Restoration of
Breakdown 41 36.90
Voltage Fluctuation 41 33.78
119 Continuity Of Service
This index was defined by four drivers of satisfaction, namely, Service breakdown Voltage fluctuation, Notification of breakdown and Restoration of breakdown as shown on table 4.11. The overall un-weighted index of satisfaction is 41.00 while the weighted index is estimated at 35.34. The implication of this statistics is the
description of a service provider that is not efficient.
Consumers Environment
Protection 66.00as good, disturbance to the environment, 54.1 complaint channels, 44.6 safety of equipments, 45.1 responsibility for damages, 36.9. The overall un-weighted index of satisfaction is 49.35 while the weighted satisfaction stood at 33.9. The result is presented in table 4.12 below
Table 4.12: Index of Consumers’ Satisfaction with Consumers Environment
Name of index Un-weighted Index Weighted Index Remarks Satisndex Group
Protection 66.0 35.1
33.9 < 50 Poor Service Delivery
Disturbance 54.1 31.2
Complaint channel 44,6 31.2
Safety of equipment 45.1 35.1
Damages 36. 9 31.8
Source: Author’s Estimation 2012
*All these indicators averaged 3.9 – 4, which is barely satisfactory, but most say the service delivery in terms of its impact on consumer’s environment is poor, and ranked it 5
Inheritd Bills
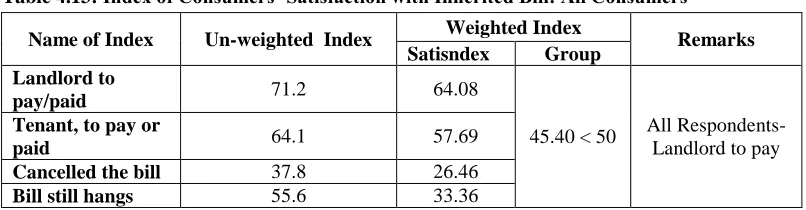
Inherited bill is another controversial issue in electricity supply especially with the use of credit meter. This problem is defined Landlord to pay/paid, Tenant, to pay or paid, Cancelled the bill, Bill still hangs. The
resolution of this problem remains intractable as many consumers do not agree with the methods. It is hope that the introduction of pre-paid meter will solve the problem permanently. The overall index of satisfaction is 45.40
Table 4.13: Index of Consumers’ Satisfaction with Inherited Bill: All Consumers Name of Index Un-weighted Index Weighted Index Remarks
Satisndex Group Landlord to
pay/paid 71.2 64.08
45.40 < 50 All Respondents- Landlord to pay Tenant, to pay or
paid 64.1 57.69
Cancelled the bill 37.8 26.46
Bill still hangs 55.6 33.36
120 Complaint Management
Five complaint management channels were identified for use by all the stakeholders in the demand and supply chain (telephone, postal mail, e-mail, fax, and customer forum). Only two of these namely telephone and customer forum were identified and used
by the responding customers. The overall index of consumers’ satisfaction (57.4), though above average does not indicate true consumers satisfaction, because of limited options. Table 4.14 presents the index of consumers’ satisfaction with complaints management outfit of the service providers.
Table 4.14: Index of Consumers’ Satisfaction with Complaints Management
Name of Index Un-weighted Index Weighted Index Remarks Satisndex Group
Telephone 33 52.8
57.4 Poor
Postal Mail NR NR
E-mail NR NR
Fax, NR NR
Customer forum
(Power Consumers 31 62.0 Good
Source: Author’s Estimation, 2012
Out of these indicators, customer forum appears to be the most desirable option for complaint management as it records 3.10; which is good, followed by telephone, e-mail, postal letter and lastly through fax. Thus, the most effective channel of complaint is customer forum.
Discussion and Summary of Major
Findings
From the results presented on tables above three classes of satisfaction index are deductible, namely: -
i. Consumers Expectation ii. Service Standard iii. Technical Competence
The consumers are not satisfied with the product- electricity - as supplied by the existing Abuja DISCO in general and in particular, the business units. This is occasioned by inadequate power supply,
accentuated by the ever increasing supply-demand gap in the power industry. Other indicators and drivers of consumer satisfaction attested to this result. The analysis above shows that in most cases the consumers do not regard the present condition with respect to electricity supply by the major stake holders as meeting consumers’ expectation. The extent of compliance to service standard is inadequate, while the technical competence, as shown by the indexes of professionalism and continuity of service, is also defective. This therefore calls for regulatory competence and enforcement of standard.
Six major indicators appear to be more significant in the scheme for satisfaction determination. These are the
121 v. Responsiveness and
vi. Professionalism vii. Continuity of service
The analyses showed that majority of the electricity consumers are not satisfied with the quality of service, attitude and the network. In addition most of the consumers are unwilling to pay, due to irresponsive nature of the service providers.
Regarding the metering system about 30.4% are currently using prepaid although about 60.5% of the respondents have preference for it. For the consumers using pay as consume, majority considers frequency of meter reading as poor and not satisfied with the meter readings and classification. This is because it has encouraged the use of billing by estimation. For those using prepaid, majority believe that it will help to ensure prompt payment, proper budgeting and prevent disputes amongst others.
Most of the respondents considers the responsiveness of service providers as inadequate and considers the level of professionalism as poor. Regarding continuity of service, most consumers considers the present situation as poor. A situation that guarantee disruption to power supply without prior notice can only be regarded as a clear demonstration of lack of respect for the consumers. Majority of the consumers are not comfortable with the treatment of issues regarding disturbance to environment and their equipment. The compliant channels are also not broad enough for customer-based organization. All of these observation put together had been
responsible for very weak index of consumers satisfaction.
Conclusions and Recommendation
For a sustained economic development to be achieved, adequate infrastructure must be put in place to complement the growth process. Electricity power supply is one of such critical infrastructure needed for rapid economic growth and development.
In addition to being one of the most convenient and cheapest sources of power, it attracts foreign investors as the cost of production would be much lower when production is carried out using public electricity source compared to generating set. The level of living is greatly improved if power supply is available as most see it as a must needed for all.
A large proportion of the respondents are highly dissatisfied with the various aspect of the power service from product quality, to the attitude of staff, the system network and this made them highly unwilling to pay.
Recommendations
From summary of findings so far the following recommendations are proposed for to guarantee satisfaction of electricity consumers in Nigeria:
122 ii. In the medium run the regulatory
agencies (e.g. NERC) conduct routine satisfaction survey to establish and enforce standard iii. In the long run, the energy
commission should bridge the supply gap by encouraging foreign direct investment in the power sector
iv. The DISCO should strive to meet service standard, especially in the area of service attitude, to be enhanced through worker education on corporate imaging. Currently the index of Consumer Satisfaction with service attitude (low) assumes that provision of service to consumers is a matter of favour, which runs counter to the status of consumer as king.
v. The prepaid metering system need to be generalized as this will make the billing system less arbitrary and the consumers will be less reluctant to pay. In particular it will make revenue collection easy and less expensive. In the medium run all consumers must be supplied with prepaid meters (at no cost) in consonant with principle of equity and fair play.
vi. In the interim, while the credit meter is still in use, the, DISCOs should ensure that meter readers are provided with un-ambiguous identification materials (ID card, Overall with inscription of DISCO). NERC must enforce the use of these and be ready to sanction any of the
erring DISCO.
vii. The DISCO should connect only when meter is available. As at present less than 40% of the consumers are metered –a situation that has given room for theft of electricity.
viii. Customer service centers should be established in identifiable clusters so that no additional cost is incurred in the process of either buying the kilowatt hours in respect of prepaid meters or paying the bill in the case of credit meters.
ix. The staff of the DISCO must be more responsive to calls and complaints by imbibing the enterprise culture. These will not only improve the relationship between the consumers and the service providers but discourage any form anti-DISCO activities and reduce the risk of further damage due to activities of quacks.
x. DISCO should be made to establish a customer complaints desk, fitted with modern communication equipment (fax, phone, internet service, etc)
xi. The DISCO must provide adequate logistics (alert system, vehicle for rapid response, to reach areas of service breakdown so that appropriate measures could be taken in time.
123 are carried on as planned and communicate same to the general public. In addition, composition of membership of such committee should be drawn from a variety of sectors like professionals in the field, academia, consumers, Standard Organization of Nigeria, students and many more.
xiii. This exercise must be conducted on a monthly basis, in local dialects,
References
Anita, B. Pfaff (1972). An Index Of Consumer Satisfaction, in Proceedings of the Third Annual Conference of the Association for Consumer Research: Association for Consumer Research, Pages: 713-737.
Benson, P. G., Saraph, J. V. and Schroeder, R. G. (1991). The Effects of Organizational Context on Quality Management: An Empirical investigation. Management Science, 37(9): 1107-24.
Crosby, P. B, (1979). Quality is Free: The Art of Making Quality Certain, New American Library, New York, NY. Barbara, B. Flynn, Schroeder, R. G. and
Sakakibara, S (1994). A framework for Quality Management Research and An Associated Measurement Instrument. .Journal of Operations Management, 11(4): 339-66.
Garvin, D. A. (1984). Managing Quality: The Strategic and Competitive Edge, The Free Press, New York.
James C. Lingoes, and Martin Pfaff, Wayne (1972). The Index of Consumer Satisfaction:Methodology. Proceedings of the Third Annual Conference of the Association for Consumer Research, Pages 689-712
Julian, C. C. and Ramaseshan, B. (1994). The Role of Customer-contact Personnel in Marketing of Retail Bank’s Services International. Journal of Retail and Distribution Management, 22(9): 29-34. Juran, J. M. and Gryna, Jr (Eds) (1998).
Juran’s Quality Control Handbook, 4th ed., McGraw-Hill, New York, NY. Leon-Garcia, Albert (1994). 'Probability and
Random Processes for Electrical Engineering (2nd edition), Prentice Hall Martesen, A. Grenholdt, L. and Kirstesen, K.. (2000) The Drivers of Consumers’ Satisfaction and Loyalty: Cross-Industry Findings from Denmark. Total Quality Management, 2(4-6): 544-555.
Naumann, E. Jackson, D. W. Jnr. and Rosembaum, M. (2001). How to Implement Customer Satisfaction Program. Business Horizon, 44(1): 37-48.
Scott M. Smith (2007). How to Measure Customer Satisfaction: Satisfaction Measurement and Theory May 9th, Shaharudin, J. Anita, J and Khin Than Myint
124 Te-King Chein, Chin-ho Su, and Chao-Tou
Su (2002) Implementation of a Customer Satisfaction Program: A case in Study
http://emeraldinsight.com/0263-5577.htm Whitt, Ward (2002). 'Stochastic-Process
Limits, An Introduction to Stochastic-Process Limits and their Application to Queues'', Chapter 1: Experiencing Statistical Regularity
http://www.columbia.edu/~ww2040/book.ht ml link to selected chapters
Wong, A. (2000). Integrating the Suppliers Satisfaction with the Consumers Satisfaction. Total Quality Management, 2(4-6) Critical Review of Customers Satisfaction in Zeithamil, V. A. (Ed) Review of Marketing. America Marketing Association Chicago II Sam Amadi (2011). Unbundling the Nigeria
Electricity Sector: Update on Economic Regulation Being the text of address Presented at the Africa Energy Forum Paris
Yi, Y. (1990). A Critical Review of Consumer Satisfaction. in Zeithaml, V.A. (Eds), Review of Marketing 1990, American Marketing Association, Chicago, IL, pp. 68–123.