APPLICATION OF SOLID DISPERSION TECHNIQUE IN SOLUBILITY AND DISSOLUTION RATE
ENHANCEMENT OF NATEGLINIDE
PRASANTHI BODDU
1*, VENKATA LAKSHMI CHERAKAPU
2, UMA DEVI PONUKUMATI
21Department of Pharmaceutical Technology, Vignan Institute of Pharmaceutical Technology, Visakhapatnam - 530049, Andhra Pradesh, India. 2Department of Pharmaceutical Technology, Viswanadha institute of Pharmaceutical Sciences, Visakhapatnam - 530017,
Andhra Pradesh, India. Email: [email protected] Received: 08 December 2017, Revised and Accepted: 28 July 2017 ABSTRACT
Objective: Nateglinide (NTG) is a potent short-acting biopharmaceutical classification system class II antidiabetic medication. The primary objective of the present investigation was to prepare and evaluate solid dispersions of NTG to enhance the component solubility and immediate release (IR) profile. The secondary objective was to formulate sustained release (SR) matrix layer of NTG for prolonging its effect in the body and to decrease oscillations in plasma concentration level.
Methods: NTG (270 mg) SR layer was formulated using release retardant polymers such as Carbopol, ethyl cellulose (EC), hydroxy EC, hydroxypropyl methylcellulose (HPMC), Kollidon, and locust bean gum at concentrations of 15% and 30%. IR layer of NTG (60 mg) was formulated using drug:
Polymer inclusion complexes (1:1 and 1:2) of β-cyclodextrin (CD), HP β-CD, polyvinylpyrrolidone (PVP) K-15, and PVP K-30 by physical mixing and
kneading methods (KMs).
Results: Among the all the carriers tested HP β-CD at 1:2 ratio prepared by KM (I3) gave highest enhancement of dissolution rate and dissolution
efficiency with acceptable f1 (10.5) and f2 (51.0) values in comparison to marketed IR tablets (Starlix-60®). The SR formulation S12 was able to show
a minimum amount of drug release (15%) within 1 hr comparatively, with a complete and sustained effect on drug release.
Conclusion: Thus, HPMC K-100M at a concentration of 30% in the SR layer in combination with HP β-CD (1:2) solid dispersions in the IR layer may
be used in the design of oral controlled drug delivery system for NTG.
Keywords:Controlled release, Diabetes mellitus, Dissolution, Meglitinides, Solid dispersion, Solubility.
INTRODUCTION
Diabetes is a chronic condition associated with abnormally high levels of sugar (glucose) in the blood. Diabetes was the 7th leading cause of
death in the United States listed on death certificates in 2007. The two types of diabetes are referred to as type 1 (juvenile-onset or insulin-dependent diabetes) and type 2 (adult-onset or non-insulin-insulin-dependent
diabetes mellitus [NIDDMs]). The major complications of diabetes
are both acute and chronic. The major goal in treating diabetes is to minimize any elevation of blood sugar (glucose) without causing abnormally low levels of blood sugar. Type 1 diabetes is treated with insulin, exercise, and diabetic diet. Type 2 diabetes is first treated
with weight reduction, a diabetic diet, and exercise [1]. When these
measures fail to control the elevated blood sugars, oral medications are used. If oral medications are still insufficient, insulin medications and other injectable medications are considered [2].
Insulin produced by the pancreas lowers blood glucose. The absence or insufficient production of insulin causes diabetes. The class of drugs known as meglitinides is relatively new, which act by binding
selectively to pancreatic β-cells to stimulate insulin release. Unlike the
sulfonylureas that bind to receptors on the insulin-producing cells, meglitinides work through separate potassium-based channel on the cell surface. Meglitinides may have a neutral effect on weight or cause
a slight increase in weight [3]. The average weight gain caused by
meglitinides appears to be lower than that caused by sulfonylureas and insulin appears to occur only in those native to oral antidiabetic drugs. Meglitinides are also relatively safe to use in people with impaired
kidney function. Due to their mechanism of action, meglitinides may
cause hypoglycemia, but the literature suggests that the risk is lower
than that caused by sulfonylureas and insulin since their action is
dependent on the presence of glucose [4]. Meglitinides appear to be
more effective at lowering post-prandial blood glucose than metformin,
sulfonylureas, and thiazolidinediones [5].
Nateglinide (NTG) is an oral antihyperglycemic agent used for the
treatment of NIDDM. NTG is an amino acid derivative belongs to the
meglitinides class of short-acting insulin secretagogues. It potentiates the effect of extracellular glucose on adenosine triphosphate-sensitive potassium channel and has little effect on insulin between meals
and overnight [6]. As such, NTG is more effective at reducing
post-prandial blood glucose levels and does not tend to lower fasting blood glucose levels to the same degree. Approximately one month of therapy is required before a decrease in fasting blood glucose is seen. The insulinotropic effects of NTG are highest at intermediate glucose levels (3-10 mmol/l) and it does not increase insulin release already stimulated by high glucose concentrations (>15 mmol/l). Unlike the sulfonylureas which last longer in the body, NTG (Starlix) is very short-acting (half-life~1.5 hr), with peak effects within one hour of
oral administration [7,8]. For this reason, the immediate release (IR)
tablets of NTG has been commercialized as an antidiabetic agent for the treatment of type 2 diabetics, and it is required to be administered at a dose of 60/120 mg twice or thrice a day just before meals. The major benefit of NTG is that the starting dose of 120 mg does not need to be adjusted upward, but rather remains constant. Therefore, to prolong its effect in the body and to decrease oscillations in concentration level in plasma. A modified drug delivery system is needed for NTG to improve solubility, dissolution rate, and patient compliance, and to decrease
the side effects [9,10]. NTG is practically insoluble in water and has an
absolute bioavailability of approximately 73%. Hence, it is desirable © 2017 The Authors. Published by Innovare Academic Sciences Pvt Ltd. This is an open access article under the CC BY license (http://creativecommons.
org/licenses/by/4. 0/) DOI: http://dx.doi.org/10.22159/ajpcr.2017.v10i11.14489
to enhance the solubility and dissolution profile of NTG using various
cyclodextrins (CD)/polyvinyl pyrrolidone (PVP) in combination with
release retardant polymers such as ethyl cellulose (EC), hydroxyl EC (HEC), hydroxypropyl methylcellulose (HPMC), Carbopol, Kollidon, and
various natural gums [11,12].
NTG undergoes extensive first-pass metabolism by hydroxylation followed by glucuronide conjugation. The major metabolites possess
less activity than the parent compound. One major metabolite, the
isoprene, has the same potency as its parent compound. NTG is approximately 98% bound to proteins (primarily albumin and to a lesser extent to alpha-L acid glycoprotein). Multiparticulate drug delivery systems have considerable potential for the treatment of
chronic diseases such as diabetes [13,14]. The important technological
advantages of solid dispersions used as drug carriers are high stability, high carrier capacity, feasibility of incorporation of both hydrophilic and hydrophobic substances, and feasibility of variable routes of administration including oral application and inhalation. These properties of solid dispersions enable improvement of drug solubility, dissolution rate, bioavailability, and may resolve the problem of patient
incompliance [15]. The proposed research studies were carried out
on the enhancement of dissolution rate of NTG by solid dispersion technology employing various water dispersible carriers.
For the improvement of compliance to patients, however, it is desired
to develop an SR oral dosage form instead of IR tablet. NTG belongs to biopharmaceutical classification system Class II, that is, why we can develop a solubility/dissolution enhanced form of it using various
techniques such as solid dispersion [16-21]. Because NTG is having
low t1/2, which is unable to reach the therapeutic concentration, CR
formulations are designed. The release of NTG should be sustained as its therapeutic absorption window is in the intestine. The value of hydrophilic, polymer-based matrix system as carriers for controlled drug delivery is well recognized and increasingly demonstrated by the numerous patents, research papers, and the US food and drug
administration approved matrix-based products [22]. In particular, water soluble cellulose ethers (e.g., HPMC, HPC, HEC, EC), PEO, Kollidon,
Carbopol, and polysaccharides such as locust bean gum (LBG) have
been extensively used [23].
When we are combining both the technologies, we can enhance the
efficacy of drug as well as we can maintain the drug concentration in plasma such that it maintains in therapeutic concentration for the
desired time [24]. The present research endeavor was thus directed
toward the development of safe and effective controlled-release dosage form of NTG to be taken once daily to maintain the optimum therapeutic levels over an extended period, reducing the price of drug, and making
the drug more affordable to the patients [25,26]. The prepared bilayer
tablets prepared using the optimized formula of the IR layer (60 mg of NTG) and optimized formula of sustained release (SR) (270 mg of NTG) matrix system were evaluated for pre-compression parameters, weight variation, hardness, friability, drug content, in vitro drug release, and kinetic studies in comparison with marketed product (Starlix®).
MATERIALS AND METHODS Materials
NTG was gift samples from Glenmark Pharmaceutical Ltd., Pune. EC,
hydroxypropyl cellulose (HPC), hydroxy EC (HEC), β-CD, and HP β-CD (HP β-CD) were obtained from Signet chemicals, Mumbai. HPMC K-100
was procured from Colorcon, Goa. Kollidon SR, polyvinylpyrrolidone
(PVP) K-17, and polyvinylpyrrolidone K-30, microcrystalline cellulose (MCC), sodium starch glycolate (SSG) were obtained from S.D. fine-chem. Ltd., Mumbai. LBG, Carbopol 971 P, Dicalcium phosphate (DCP),
magnesium stearate, and colloidal silica were procured from Lubrizol Pvt. Ltd., Mumbai. All other chemicals and solvents used were of analytical grade. The commercial brand of IR tablet: Starlix® containing
60 mg of NTG (batch No. A2026SU, Novartis) was used for comparison of optimized solid dispersion in the present study.
Pre-formulation studies Standard plot of NTG
NTG exhibits peak absorbance at 212 nm in 0.01 N hydrochloric acid (HCl) (pH 2) and pH 6.8 phosphate buffer containing 0.5% sodium lauryl sulfate (SLS). The concentration of NTG was found to be linear in range of 0-10 µg/ml with a correlation coefficient of r=0.999. The linear regression equation was found to be y=0.031x+0.002, which can be used for estimation of NTG drug concentration in 0.01 N HCl containing 0.5% SLS. NTG has shown linear relationship in the range of 0-10 µg/ml in pH 6.8 phosphate buffer containing 0.5% SLS, and the regression
equation was found to be y=0.024x−0.002 with a correlation coefficient
(r) of 0.998, which can be used for the estimation of drug concentration.
Solubility studies
The solubility of NTG was determined by adding excess but measured amount (20 mg) of drug in 25 ml volumetric flask containing 0.01 N HCl with 0.5% SLS and kept in rotary shaker for 24 hrs at room temperature.
The dispersions were filtered through Whatman filter paper (No.1) and
analyzed for the quantity of drug dissolved by taking the absorbance and was determined from their respective standard plots.
Drug-excipient compatibility studies
Fourier transform infrared (FTIR) spectroscopy analysis was performed to pure drug (NTG), physical mixtures of drug with β-CD (1:1), HP β-CD (1:1), PVP K-17 (1:1) physical mixing (PM), PVP K-30 (1:1) PM, PVP K-17 (1:1) kneading method (KM), PVP K-30 (1:1) KM, and final
optimized formulation. The IR absorption spectra of the pure drug with different excipients were taken in the range of 4000-450 cm−1 using
KBr disc method. Around 1-2 mg of the substance to be examined was triturated with 300-400 mg of finely powdered and dried potassium bromide. These quantities are usually sufficient to give a disc of 10-15 mm diameter and pellet of suitable intensity by a hydraulic press. Each spectrum was derived from 16 single average scans collected under identical conditions at a spectral resolution of 2cm−1.
Preparation of solid dispersions Solubility determination
Solubility studies were performed in triplicate according to the Higuchi and Connors method. To improve solubility and dissolution rate of
NTG, complexation with β-CD, HP β-CD, PVP K-17, and PVP K-30 were prepared at different concentrations [27]. Sixteen formulations of NTG
solid dispersions were prepared by two different methods, namely, PM and KM.
Analysis of prepared solid dispersions
The formulations prepared were subjected to pre-compression parameters and physicochemical properties evaluation. In vitro
dissolution studies were performed for two hours using USP dissolution rate test apparatus II in 0.01 N HCl containing 0.5% SLS at 50 rpm
and 37±0.5°C [28]. The amount of NTG released from the SR tablet
formulations was estimated at 212 nm using a UV spectrophotometer.
Preparation of IR layer
Formulation of IR layer was done by taking pure drug NTG 60 mg
(loading dose) labeled as formulation I1 of total weight 400 mg.
Formulations I2, I3, I4, and I5 were prepared by employing drug: Inclusion complexes in the ratio 1:2 β-CD and HP β-CD by PM and KMs
with SSG and MCC as superdisintegrant and diluent, respectively. All the formulated IR tablets employing solid dispersions exhibited rapid and higher drug dissolution when compared to tablets formulated with
pure drug (F1) and also commercial tablets of NTG (Starlix®).
Preparation of SR layer
Formulation trials were done using the six-stated polymers by wet
Kollidon to enhance the aqueous solubility of the drug; saccharide derivatives such as LBG; and acrylate derivatives such as Carbopol. In
the present SR matrix formulation, DCP was used as filler to impart
physical stability to the drug; colloidal silica and magnesium stearate were used as glidant and lubricant, respectively, to improve the flow properties; povidone was used as a binder and purified water as a solvent for the binder.
Twelve formulations were prepared by varying the concentration of six polymers at two levels of 15% and 30%. The formulations prepared were subjected to evaluation of pre-compression parameters and physicochemical properties. In vitro dissolution studies were conducted for 12 hrs using USP dissolution rate test apparatus II in 0.01 N HCl containing 0.5% SLS for 2 hrs followed by pH 6.8 phosphate buffer at 50 rpm and 37±0.5°C. The amount of NTG released from the SR tablet formulations was estimated at 212 nm using a UV
spectrophotometer.
Preparation of bilayer tablet
All the ingredients were passed through 100 mesh sieve separately.
Weighed quantity of NTG and all other excipients except lubricant
and glidant were taken in mortar and prepared the wet mass using
PVP K-30 binder solution in ethanol. This wet mass was passed
through 60 mesh sieve and dried in hot air oven at 50°C up to
optimum drying. Dried granules were passed through 100 mesh sieve. Magnesium stearate and AEROSIL were added to these dried
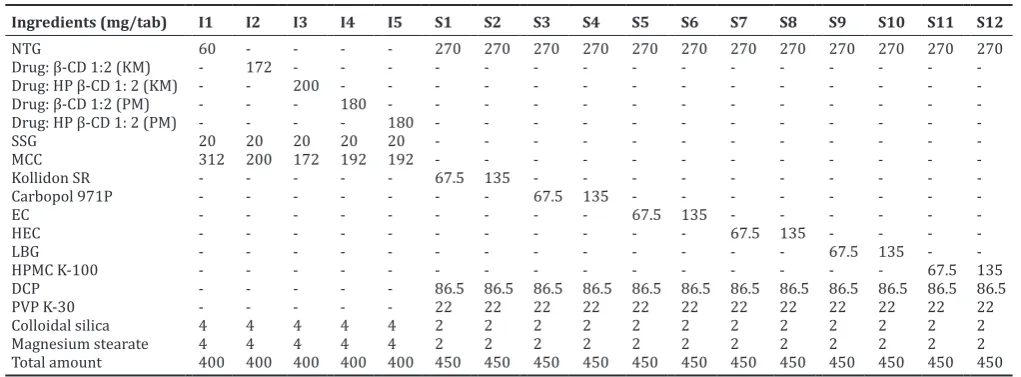
granules. Later, these were subjected for punching using RIMEK multi station tablet punching machine using round flat surface punches of 12 mm diameter. After compression of the SR layer, the upper punch was lifted, and the optimized blend of powder for IR layer (containing 60 mg NTG) was poured into the die cavity, containing initially compressed SR matrix tablet (containing 270 mg NTG). This bilayer tablet compression was performed by RIMEK multi station punching machine using flat punches. The details of the composition of the IR (I1-I5) and SR (S1-S12) layer of bilayer tablet are given in Table 1.
Analysis of IR and SR formulations of bilayer tablet
Evaluation of pre-compression parameters of prepared formulations
The blend of all the prepared formulations was evaluated for their flow properties before compression by characterization of bulk density, tapped density, compressibility index, Hausner’s ratio, and angle of repose.
Evaluation of post-compression parameters of prepared formulations
The weight variation, hardness, thickness, and friability of the tablets were measured in electronic balance (Shimadzu, Mumbai), hardness
tester (Pfizer, Mumbai), digital caliper (Vernier, Mumbai) and friabilator
(Electrolab, Mumbai), respectively.
Estimation of drug content in tablets
An accurately weighed quantity (10 mg and 45 mg) of powdered IR and SR tablet was transferred separately to a 100 mL volumetric flask, and the NTG was extracted into 50 mL of methanol. The volume is made up to 100 mL with 0.01 N HCl containing 0.05% SLS for
IR and pH 6.8 phosphate buffer for SR formulation [29]. The stock
solutions were filtered and suitably diluted with the corresponding
solvent. The drug content was assayed using double-beam UV-Visible
spectrophotometer (model SL210, Elico, Hyderabad), in a 1 cm quartz cell, at 212 nm in both IR and SR formulations. Each drug content estimation procedure was replicated six times.
In vitro dissolution rate studies
In vitro dissolution studies of IR formulations
Dissolution of the tablets was carried out on USP XXIII dissolution
type I apparatus (Model No. TDT-08L, Electrolab, Mumbai). The tablet was fixed to the paddle by hydration mechanism. The dissolution vessel was filled with 900 ml of 0.01 N HCl containing 0.5% SLS (pH 2.0) and the temperature of the dissolution medium was maintained at 37±0.5°C. The rotational speed of the paddle was set at 50 rpm. At suitable intervals, 5 ml of sample was withdrawn and same volume of fresh medium was replaced. The withdrawn samples were filtered, diluted when necessary with the dissolution medium, and analyzed spectrophotometrically at 212 nm using 0.01 N HCl containing 0.5% SLS as blank. The mean cumulative percentage drug release was calculated and plotted against time.
In vitro dissolution studies of bilayer tablets
Dissolution of the tablets was carried out on USP XXIII dissolution
type I apparatus (Model No. TDT-08L, Electrolab, Mumbai). The tablet was fixed to the paddle by hydration mechanism. The dissolution vessel was filled with 900 ml of 0.01 N HCl containing 0.5% SLS (pH 2.0) for first two hours and thereafter replaced with pH 6.8 phosphate buffer for the remaining 10 hrs. The temperature of the dissolution medium was maintained at 37±0.5°C with paddle rotational speed of 50 rpm. At suitable intervals, 5 ml of sample was withdrawn, and the same
Table 1: Formulation details of immediate and SR layer of bilayer tablet
Ingredients (mg/tab) I1 I2 I3 I4 I5 S1 S2 S3 S4 S5 S6 S7 S8 S9 S10 S11 S12 Total amount 400 400 400 400 400 450 450 450 450 450 450 450 450 450 450 450 450
NTG: Nateglinide, HP: Hydroxypropyl, SR: Sustained release, SSG: Sodium starch glycolate, MCC: Microcrystalline cellulose, β-CD: β-Cyclodextrin, EC: Ethyl cellulose, HEC: Hydroxylethyl cellulose, LBG: Locust bean gum, HPMC: Hydroxypropyl methylcellulose, DCP: Dicalcium phosphate, PVP: Polyvinylpyrrolidone, KM: Kneading
volume of fresh medium was replaced. The withdrawn samples were filtered, diluted when necessary with the dissolution medium, and analyzed spectrophotometrically at 212 nm for NTG content. The mean cumulative percentage drug release was calculated and plotted against
time. During the drug release studies, all the formulations were checked
at intervals for their physical integrity.
Drug release kinetics
The release rate kinetics and mechanism of drug release from the IR and SR formulations were analyzed by fitting the data obtained
into zero- and first-order models using PCPDISSO v2 software[30].
Based on the correlation coefficient (r) value, the best-fit model was selected.
The Korsmeyer-Peppas equation was used to analyze the data obtained from the in vitro release studies to evaluate the kinetic models and
release mechanism of NTG from the SR matrices [31].
Comparison of optimized IR formulation with marketed product Optimized IR formulation was compared with marketed IR tablets (Starlix®) containing 60 mg of NTG.The in vitro drug release profile of
the optimized formulations (test) was compared with the theoretical release profile (reference) of marketed tablets by determining the difference factor (f1) and similarity factor (f2) of the respective
drugs [32].
RESULTS AND DISCUSSION Pre-formulation studies Solubility studies
The drug NTG has shown highest solubility in pH 6.8 phosphate buffer (1.61 mg/ml), followed by 0.01 N HCl containing 0.5% SLS (0.61 mg/
ml) and the least in distilled water (0.36 mg/ml) [33]. NTG is an acidic
drug with one ionizable group (pKa=3.1)+ [34]. Hence, it requires
enhancement of solubility to increase the bioavailability of the drug in the management of type 2 diabetes mellitus.
Drug-excipient interaction studies
From the FTIR data observed in Fig. 1, it was concluded that there were no considerable changes even after the development of tablet with
references to the respective spectrums. The FTIR spectrum of NTG shown
a characteristic peak at 3424.41 cm−1 due to COOH–O–H stretching, peak
at 3315.91 cm−1 was observed due to N–H stretching of the secondary
amide. The peaks at wave numbers 2924.74 and 2854.45 cm−1 were
correspondence to CH3–C–H stretching, respectively. The COOH–C=O
stretch at 1713.72 cm−1 and the secondary amide C=O stretching at
1649.45 cm−1 were observed. All characteristic peaks obtained in the
pure drug spectra were observed in physical mixture with minor shifts indicating there is no significant interaction between the drug (NTG) and the excipients which were employed in the present study.
Fig. 1: Fourier transform infrared spectras of (a) NTG, (b) NTG: β-CD, (c) NTG: HP β-CD, (d) NTG: PVP K-17, (e) NTG: PVP K-30, and
(f) optimized formulation (F12), NTG: Nateglinide, CD: Cyclodextrin, HP: Hydroxypropyl, PVP: Polyvinylpyrrolidone
d
c b
f a
Solid dispersions Solubility determination
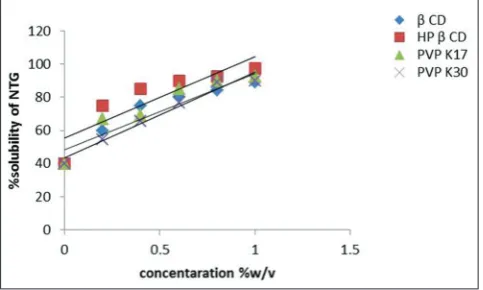
The effect of four different carriers, that is, β-CD, HP β-CD, PVP K-17, and PVP K-30 on the solubility and dissolution rate of NTG was studied at different concentrations [35]. At 1% w/v of HP β-CD, NTG had shown
the highest solubility of 97.5% as shown in Fig. 2.
The solubility of NTG was increased as the concentration of carrier was increased in the solid dispersions due to the formation of inclusion complexes. The solubility of NTG was 40% at zero percent carrier concentration and increases to around 90% at one percent carrier
concentration of β-CD, PVP K-17, and PVP K-30. The solubility of NTG was increased up to 98% at one percent concentration of HP β-CD,
indicating the formation of soluble inclusion complex between NTG and carrier.
Analysis of prepared solid dispersions
All the solid dispersions prepared were found to be fine free-flowing powders. The drug content was uniform in all the solid dispersion batches.The dissolution of NTG from all the solid dispersions was rapid and several times higher than the dissolution of the corresponding pure drug as shown in Table 2.
Drug dissolution from all solid dispersions followed first-order kinetics.
All the dissolution parameters estimated, that is, T50, T90, DE30%, and K1
values indicated rapid and higher dissolution of the drug (NTG) from solid dispersions than that of corresponding pure drug.The dissolution
rate of nateglinide with various carriers is in the order of: HPβ-CD>β-CD>PVPK17>PVP K30. In each case, the dissolution rate (K1) and
DE30% were increased as the concentration of carriers in the solid
dispersions was increased.
For solid dispersions prepared with β-CD, a 1.9- and 2.3-fold increase
in dissolution rate (K1) and DE30%, respectively, was observed with 1:1
ratio of physical mixture. A 2.85- and 3.36-fold increase in dissolution rate (K1) and DE30%, respectively, was observed with 1:1 ratio of KM.
A 2.38- and 2.52-fold increase in dissolution rate (K1) and DE30%,
respectively, was observed with 1:2 ratio of physical mixture. A 3.8- and 3.49-fold increase in dissolution rate (K1) and DE30%, respectively, was
observed with 1:2 ratio of KM. In case of solid dispersions prepared
with HP β-CD, a 2.38- and 2.61-fold increase in dissolution rate (K1) and
DE30%, respectively, was observed with 1:1 ratio of physical mixture.
A 4.76- and 3.42-fold increase in dissolution rate (K1) and DE30%,
respectively, was observed with 1:1 ratio of KM. A 3.36- and 2.77-fold increase in dissolution rate (K1) and DE30%, respectively, was observed
with 1:2 ratio of physical mixture. A 6.66- and 3.55-fold increase in dissolution rate (K1) and DE30%, respectively, was observed with 1:2
ratio of KM.
Whereas for solid dispersions prepared with PVP K-17, a 2.38- and
2.35-fold increase in dissolution rate (K1) and DE30%, respectively,
was observed with 1:1 ratio of physical mixture. A 2.85- and 2.82-fold increase in dissolution rate (K1) and DE30%, respectively, was observed
with 1:1 ratio of KM. A 2.85- and 2.43-fold increase in dissolution rate (K1) and DE30%, respectively, was observed with 1:2 ratio of physical
mixture. A 4.28- and 2.89-fold increase in dissolution rate (K1) and
DE30%, respectively, was observed with 1:2 ratio of KM. While that of solid dispersions prepared with PVP K-30, a 1.90- and 2.51-fold
increase in dissolution rate (K1) and DE30%, respectively, was observed
with 1:1 ratio of physical mixture. A 2.38- and 2.53-fold increase in dissolution rate (K1) and DE30%, respectively, was observed with 1:1
ratio of KM. A 1.90- and 2.66-fold increase in dissolution rate (K1) and
DE30%, respectively, was observed with 1:2 ratio of physical mixture.
A 2.85- and 2.84-fold increase in dissolution rate (K1) and DE30%,
respectively, was observed with 1:2 ratio of KM.
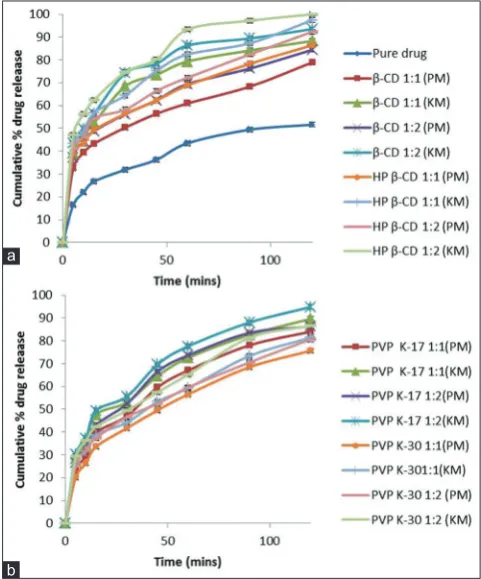
From Fig. 3, it is clear that when compared to pure drug NTG, drug
inclusion complexes prepared with different CDs (β-CD, HP β-CD) by
PM and KM gave the maximum solubility and dissolution rate of drug from prepared solid dispersions. Hence, inclusion complexes of NTG
with β CD and HP β CD in the ratio of 1:2 (drug:polymer) were further
optimized by preparing IR layer of NTG.
IR formulation
Analysis of prepared IR formulations
All the pre-compression parameters such as angle of repose (<25°), compressibility index (15.05-20.02%), and Hausner’s ratio (<1.25) were within the limits of official standards displaying good flow properties of the prepared granules (I1-I5).
All post-compression parameters such as weight variation, hardness, thickness, friability, disintegration time, and drug content were found to be within the limits of official standards. The weight variation for a tablet weighing around 400 mg was found to be with in official limits of NMT 5%. The measured hardness of the tablets of each batch of all formulations, that is, I1-I5 was between 3 and 3.5 kg/cm2 and
optimum for an IR formulation.The percent friability of formulated tablets was found to be <1% ensuring that IR layer was mechanically stable.The thickness of the tablets was found to be almost uniform
in all formulations I1-I5 in the range of 2.0-2.2 mm with less % RSD.
The drug content of each batch formulations (I1-I5) was evaluated as per the standard protocol, and the percentage of drug content was found to be 98.2-99.4%. The disintegration time of all the prepared IR formulations was <30 seconds, with a least disintegration time of 24 sec
from formulation I3 prepared with HP β-CD drug complex (1:2) by KM. Fig. 2: Solubility plot of nateglinide using different carriers (n=3,
mean±standard deviation)
Table 2: Estimated dissolution parameters of NTG solid dispersions
S. No. T50 (minutes) T90 (minutes) DE 30% K1
β-CD 1:1 (PM) 30 >120 53.73 0.008
β-CD 1:1 (KM) 13 >120 59.05 0.012
β-CD 1:2 (PM) 16 >120 78.55 0.010
β-CD 1:2 (KM) 10 90 81.51 0.016
HP β-CD 1:1 (PM) 15 >120 61.11 0.010
HP β-CD 1:1 (KM) 11 95 64.86 0.020
HP β-CD 1:2 (PM) 12 110 80.10 0.014
HP β-CD 1:2 (KM) 6 55 83.11 0.028
PVP K-17 1:1 (PM) 35 >120 55.20 0.010
PVP K-17 1:1 (KM) 22 >120 56.81 0.012
PVP K-17 1:2 (PM) 27 >120 65.87 0.012
PVP K-17 1:2 (KM) 15 98 67.71 0.018
PVP K-30 1:1 (PM) 45 >120 58.8 0.008
PVP K-30 1:1 (KM) 38 >120 62.23 0.010
PVP K-30 1:2 (PM) 40 >120 59.10 0.008
PVP K-30 1:2 (KM) 30 >120 57.73 0.012
In vitro dissolution studies
All the formulated IR tablets employing solid dispersions exhibited rapid and higher drug dissolution when compared to formulation prepared with pure drug (I1) and commercial tablets of NTG (Starlix®).
The dissolution rate of the five formulations were in the order of
F3>F5>F2>F4>F1 as shown in Fig. 4. Among all the carriers tested, HP
β-CD in the ratio of 1:2 prepared by KM gave the highest enhancement
of dissolution rate and dissolution efficiency of NTG. The predicted responses for the optimized model for NTG IR layer (I3) were found to
be 5 minutes, 100% drug release, and 43 minutes for T30, DR60, and
T90, respectively.
The prepared formulations I1-I5 followed first-order kinetics with a higher correlation coefficient (r) values for Higuchi plot indicating the drug release occurs through diffusion mechanism. This was further
confirmed by Korsmeyer-Peppas “n” values lying within 0.66-0.80,
exhibiting non-Fickian diffusion mechanism of drug release.
Comparison of optimized IR formulation with marketed product The dissolution rate and dissolution efficiency DE30% of I3 were
greater than marketed formulation of NTG (Starlix®) as shown in
Fig. 4. In the case of F2formulation, a 6.89- and 1.29-fold increase in dissolution rate (K1) and DE30%, respectively, was observed. For
F3 formulation, a 17.2- and 1.67-fold increase in dissolution rate
(K1) and DE30%, respectively, was observed. For F4 formulation,
a 5.51- and 1.35-fold increase in dissolution rate (K1) and DE30%,
respectively, was observed. For F5 formulation, a 9.31- and
1.45-fold increase in dissolution rate (K1) and DE30%, respectively, was
observed.
In the case of marketed formulation (Starlix®), an 11.7- and 1.45-fold
increase in dissolution rate (K1) and DE30%, respectively, was observed.
The observed responses for the NTG-marketed IR tablets (Starlix®)
were found to be 5 minutes, 92% drug release and 48 minutes for T30,
DR60, and T90, respectively. Similarity factor (f1) and dissimilarity
factor (f2) values of the matrix tablet were below 15 (10.5) and above 50 (51.0), respectively, indicated similarities between the optimized formulation (I3) and theoretical release profiles.
SR formulation
As NTG is having low t1/2, which is unable to reach the therapeutic
concentration, CR formulations are designed. The release of NTG should be sustained as its therapeutic absorption window is in the intestine.
Evaluation of pre-compression parameters
The prepared granules were evaluated for pre-compression parameters such as bulk density, tapped density, compressibility index, and Hausner’s ratio before being punched into tablets. The angle of repose of the formulations S1-S12 was found to be below 35° indicating excellent flow properties of the formulation. The compressibility index of formulations S1, S8, S11, and S12 were found to be in the range of 12.00-14.60%, indicating the free flow, while the formulations S2, S3, S4, S5, S6, S7, S9, and S10 compressibility index was in the range of 18.00-28%, indicating poor flow properties. The Hausner’s ratio of the formulations S1-S12, except S2 and S4 was <1.25 indicating good flowability.
Evaluation of post-compression parameters
The formulated tablets were evaluated for post-compression parameters such as weight variation, thickness, hardness, diameter, friability, and content uniformity. The weight variation for a tablet weighing around 450 mg was found to be with in official limits of NMT 5%.The measured hardness of the tablets of each batch of all formulations, that is, S1-S12 was between 5 and 6.5 kg/cm2, optimum for an SR formulation. The
percent friability of formulated tablets was found to be <1% ensuring that SR layer was mechanically stable.The thickness of the tablets was found to be almost uniform in all formulations S1-S12 in the range of
3.1-3.3 mm with less percentage RSD. The drug content of each batch
formulations (S1-S12) was evaluated as per the standard protocol, and the percentage of drug content was found to be 97.00-99.33%. Hence, it is concluded that all the formulations are following the official acceptable limits of NTG.
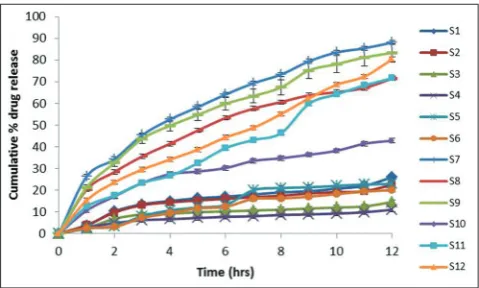
In vitro dissolution studies
From the results of the in vitro dissolution profiles of the SR matrix formulations (Fig. 5), it can be observed that the rate of release retardant power of the six polymers taken was in the order of Carbopol 971P>EC>Kollidon SR>LBG>HPMC>HEC. The formulations S7, S9, and S12 prepared with HEC (1:1), LBG (1:1), and HPMC K-100 (1:2) as release controlling polymer has shown a drug release of 88%, 83%, and 80%, respectively, at the end of 12 hrs. Among all formulations, S7, S9, and S12 exhibited the desired
Fig. 4: In vitro drug release profile of nateglinide from prepared immediate release formulations I1-I5 and marketed tablets
(Starlix®) (n=3, mean±standard deviation)
Fig. 3: In vitrodissolution profiles of nateglinide solid dispersions
prepared with (a) β-CD and HP β-CD and (b) PVP K-17 and
PVP K-30 (n=3, mean±standard deviation). CD: Cyclodextrin, HP: Hydroxypropyl, PVP: Polyvinylpyrrolidone
SR dissolution profiles with T50 values of 220 minutes, 240 minutes,
and 430 minutes, respectively.
Drug release kinetics
The orders of kinetics and release mechanisms of all the prepared twelve SR formulations were determined using different mathematical model fittings. S7, S9 obeyed first-order release kinetics, whereas S12 obeyed zero-order release kinetics following the anomalous release
mechanism or non-Fickian diffusion. In Korsmeyer-Peppas equation,
the “n” value of the formulations containing 15% and 30% of both the grades of HPMC was more than 0.5, whereas the “n” value was within 0.5 in case of formulations containing 15% of HEC and LBG.
The release rate of the formulations that showed a par with the theoretical release rate (i.e., 7.8%/hrs) meant for once daily administration was selected for the 24 hrs in vitro study. The formulations S11 and S12 containing HPMC K-100M at 15% (k=7.6%/hrs) and 30% (k=7.9%) could retard the release of drug up to 24 hrs. The formulation S12 was able to show a minimum amount of drug release (15%) within 1 hr comparatively, with a complete and sustained effect on drug release.
CONCLUSION
Nateglinide is a quick acting anti-diabetic medication whose potent activity lasts for a short duration. The present investigation was aimed at developing a safe and effective controlled release dosage form of nateglinide for maintaining the optimum therapeutic levels over an extended period of time. The present work involves the optimization of solid dispersions of NTG to enhance the activity by improving component solubility and dissolution profile by forming
inclusion complexes with CDs and comparing with marketed IR tablet (Starlix®-60 mg). SR matrix layer of NTG was formulated to prolong its
effect in the body and to decrease oscillations in concentration level in plasma, being beneficial over conventional IR formulations. The release rate of the formulations that showed a par with the theoretical release rate (i.e., 7.8%/hrs) meant for once daily administration was selected for the 24 hrs in vitro study. It can be concluded that the once a day controlled-release oral dosage form of NTG may be formulated with
1:2 ratio of drug: HP β-CD inclusion complex in the IR layer (containing
60 mg of NTG-loading dose) and 1:2 ratio of drug: HPMC K-100 in the
SR matrix layer (containing 270 mg of NTG – maintenance dose). This
optimized formulation improves patient compliance by providing as biphasic drug release pattern in a single dosage form and ensures better disease management when compared to conventional IR tablets.
ACKNOWLEDGMENTS
The authors would like to express their gratitude to Star Tech Labs Pvt., Ltd., for providing the gift sample of NTG and necessary facilities for carrying out this research work.
REFERENCES
1. Harris MI, Cowie CC, Reiber G, editors. Diabetes in America. 2nd ed.
Washington, DC: U.S. Government Printing Office; 1995.
2. Genuth S. Insulin use in NIDDM. Diabetes Care 1990;13(12):1240-64. 3. DeFronzo RA, Goodman AM. Efficacy of metformin in patients with
non-insulin-dependent diabetes mellitus. The multicenter metformin study group. N Engl J Med 1995;333:541-9.
4. Coniff RF, Shapiro JA, Seaton TB, Bray GA. Multicenter, placebo-controlled trial comparing acarbose (BAY g 5421) with placebo, tolbutamide, and tolbutamide-plus-acarbose in non-insulin-dependent diabetes mellitus. Am J Med 1995;98(5):443-51.
5. Jitendra RA, Mohan GK, Shrivastav GV, Yeole PG. Bilayer tablet formulation of metformin hydrochloride and gliclazide: A novel approach in the treatment of diabetes. Int J Pharm Res Dev 2009;1:1-11.
6. Gribble FM, Reimann F. Differential selectivity of insulin secretagogues: Mechanisms, clinical implications, and drug interactions. J Diabetes Complications 2003;17 2 Suppl:11-5.
7. Kalbag JB, Walter YH, Nedelman JR, McLeod JF. Mealtime glucose regulation with nateglinide in healthy volunteers: Comparison with repaglinide and placebo. Diabetes Care 2001;24(1):73-7.
8. Kimmel B, Inzucchi SE. Oral agents for Type 2 diabetes: An update clinical. Diabetes 2005;23:64-76.
9. Kumar KK, Reddy MN, Kishore RN. Formulation and evaluation of bilayer matrix tablet of pioglitazone HCl metformin HCl USP 15 mg and 500 mg. Asia J Pharm Clin Res 2013;6:13.
10. Patel JS, Divya T, Patel KN, Patel KJ. A review on bilayer tablets. J Drug Dis Ther 2013;1:40-8.
11. Liu M, Cao W, Sun Y, He Z. Preparation, characterization and
in vivo evaluation of formulation of repaglinide with hydroxypropyl-ß-cyclodextrin. Int J Pharm 2014;477(1-2):159-66.
12. Valizadeh H, Zakeri-Milani P, Barzegar-Jalali M, Mohammadi G, Danesh-Bahreini MA, Adibkia K, et al. Preparation and characterization of solid dispersions of piroxicam with hydrophilic carriers. Drug Dev Ind Pharm 2007;33(1):45-56.
13. Bailey CJ, Flatt PR. Development of antidiabetic drugs. In: Iaonnides C, Flatt PR, editors. Drugs, Diet and Disease, Mechanistic Approaches to Diabetes. Vol. 2. London: Ellis Horwood; 1995. p. 226-79.
14. Dey NS, Majumdar S, Rao ME. Multiparticulate drug delivery systems for controlled release. Trop J Pharm Res 2008;7(3):1067.
15. Nadia S, Riaz U, Naz HH, Kumar BS. Enhancement of oral bioavailability and solid dispersion: A review. J Appl Pharm Sci 2011;1:13-20.
16. Reddy JR, Chetty CM. Enhancement of solubility of nateglinide by solid dispersion technique. J Pharm Pharmacol 2010;62:1330-1. 17. Bhania SB. Preparation and evaluation of solid dispersions of
poorly soluble drug repaglinide. Asian J Biochem Pharm Res 2011;1:201-21.
18. Kavitha R, Sathali AA. Enhancement of solubility of repaglinide by solid dispersion technique. Int J Chem Sci 2012;1:377-90.
19. Modi VS, Thorat YS, Dhavale SC. Formulation and evaluation of controlled release delivery of tramadol hydrochloride. Int J Chemtech Res 2012;1:669-75.
20. Mohanachandran PN, Sidhumol PG, Kiran TS. Enhancement of solubility and dissolution rate: An overview. Int J Compr Pharm 2010;1:1-10.
21. Xiao DY, Wan SL, Yan JT, Cheng GL, Da HG, Hai LM. Dissolution rate enhancement of repaglinide by solid dispersion. Trop J Pharm Res 2016;15:1123-8.
22. Alderman DA. A review of cellulose ethers in hydrophilic matrices for oral controlled-release dosage forms. Int J Pharm Technol Prod Manuf 1984;5:1-9.
23. Reynolds TD, Gehrke SH, Hussain AS. Polymer erosion and drug release characterization of hydroxy propyl methyl cellulose matrices. J Pharm Sci 1998;87:1115-23.
24. Baveja SK, Hassan AU, Singh A. Zero-order release of pseudoephedrine hydrochloride from matrix tablets. Indian J Pharm Sci 1989;51:248-51.
25. Hemanth KG, Jaganathan K, Kumar RS, Perumal P. Formulation and
in vitro evaluation of bilayer floating tablets of metformin hydrochloride and sitagliptin phosphate. Int J Appl Pharm 2012;2:64-81.
26. Amit K, Ramendeep G, Peeyush S, Dinesh P, Anil B. Extended release system of hypoglycemic agent containing solid dispersions: Strategies and mechanisms. Int J Med Health Biomed Bioeng Pharm Eng 2014;8:162-6.
27. Marques HM, Hadgraft J, Kellaway IW. Studies of cyclodextrin Fig. 5: In vitrodissolution profiles of nateglinide from prepared
inclusion complexes. I. The salbutamol-cyclodextrin complex as studied by phase solubility and DSC. Int J Pharm 1990;63:259-66. 28. US Pharmacopeia. United States of Pharmacopoeia 34: National
Formulary 29 (USP34-NF29). Vol. 3. Washington, DC: US Pharmacopeia; 2011. p. 3611-4.
29. Indian Pharmacopoeia. Ministry of Health and Family Welfare. World wide Book Serivce. 7th ed., Vol. 3. New Delhi, India: The Controller of
Publication; 2014.
30. Sonar SG, Jain DK, More DM. Preparation and in vitro evaluation of bilayer and floating-bioadhesive tablets of rosiglitazone maleate. Asian J Pharm Sci 2007;2:161-9.
31. Peppas NA, Sahlin JJ. A simple equation for the description of solute release III. Coupling of diffusion and relaxation. In J Pharm 1989;57:169-72.
32. EMEA. Committee for Proprietary Products (CPMP). Note for Guidance on Quality of Modified Release Products: A Oral Dosage Forms. London, UK: EMEA. Available from: http://www.ema.europa. eu/pdfs/human/qwp/060496en.pdf. [Last accessed on 2009 Jun 12]. 33. Vinod M, Jitendra N, Komal P, Rahul C, Gokul K. Enhancement of
solubility with formulation and in-vitro evaluation of oral nateglinide compacts by liquisolid technique. Adv Diabetes Metab 2013;1:57-64. 34. Vaghani SS, Patel MM, Satish CS, Patel KM, Jivani NP. Synthesis
and characterization of carboxymethyl chitosan hydrogel: Application as pH-sensitive delivery for nateglinide. Curr Drug Deliv 2012;9(4):628-36.