R E S E A R C H
Open Access
Threshold optimization of a finite
sample-based cognitive radio network using
energy detector
Ajay Singh
1, Manav R Bhatnagar
2*and Ranjan K Mallik
2Abstract
In this paper, we consider a cognitive radio network containing two cognitive radios (CRs) and one primary user. The CRs utilizefinite number of received data samplesfor estimating the energy of the primary signals and forward these energy estimates to a fusion center (FC). The FC combines the energy estimates and utilizes a global threshold based on the exact knowledge of local thresholds of the CRs for determining the presence or absence of the primary signal. We propose selective and semi-selective soft combining schemes for this set-up. For the proposed schemes, we derive the total probability of error of detecting a spectrum hole. By minimizing thetotal probability of errorin sensing a spectrum hole, we find optimized local and global thresholds. Moreover, we also discuss the optimization of conventional non-selective soft and 1-bit hard combining schemes with multiple (equal to or more than two) collaborative CRs under the total probability of error minimization criterion. It is shown by simulations that the proposed selective soft combination-based scheme significantly outperforms the conventional non-selective schemes based on soft combination and 1-bit hard combination. Further, it is shown by simulation that the proposed selective soft combining scheme along with the total probability of error minimization criterion is able to properly utilize a spectrum hole with interference level less than the standard specified value.
Keywords: Cognitive radio; Collaborative networks; Energy detector; Probability of error; Spectrum hole detection
1 Introduction
Due to the utilization of the radio electromagnetic spec-trum up to saturation, there is scarcity of free radio spectrum [1,2]. However, it is seen in practice that even the dedicated radio spectrum is not used efficiently. For example, in television broadcasting, the spectrum allo-cated is idle for considerable time. This free spectrum can be utilized for some other applications using a cog-nitive radio network [1,2]. Hence, effective utilization of the spectrum plays an important role in today’s crowded spectrum environment. Whenever required, a licensed user (primary user) can use its licensed band, otherwise the spectrum can be used for secondary operations. A spectrum hole is said to exist when a particular band
*Correspondence: [email protected]
2Department of Electrical Engineering, Indian Institute of Technology - Delhi, Hauz Khas, New Delhi 110016, India
Full list of author information is available at the end of the article
of frequencies is not used by the primary user. Search-ing for spectrum holes is termed asspectrum sensing[1]. Sensing of the spectrum holes is done by the cognitive radios (CRs) which are unlicensed users or secondary users [1,2]. A CR is an intelligent wireless communication system that periodically monitors the radio spectrum and detects the occupancy of the different parts of the trum. The CR opportunistically communicates over spec-trum holes without interfering with the primary user’s signals [3].
There are many challenges in detecting a spectrum hole. Few of these are fading, noise uncertainty, and shadow-ing. These effects may lead to significant interference to a licensed user. It is shown in the literature [4-8] that cooperation among the CRs can be utilized in order to overcome the problems of fading, noise uncertainty, and shadowing. An optimal linear cooperation framework of spectrum sensing for detecting the primary signals is pro-posed in [4]. The cooperative spectrum sensing in [4] is based on linear combination of local statistics from
individual CRs. In [4], each CR uses an energy detector, which estimates the energy of the primary signal from the received data samples. These energy estimates are for-warded over noiseless channels to a fusion center (FC). The performance of the cognitive system is optimized using Neyman-Pearson (NP) criterion by assuming that large number of received data samples are used by each CR for energy estimation in [4]. In [7], a binary decision-based cooperative spectrum sensing scheme is discussed for cognitive networks. Each CR takes a binary decision using energy detector about the presence or absence of the primary signal. The binary decisions are forwarded to the FC which combines them for taking final deci-sion. The sum of probability of missed opportunity and probability of false alarm is minimized for obtaining an optimized threshold for the CRs. Since the hard deci-sion is taken at the CRs in [7], the performance of this scheme is poorer than a soft decision-based scheme [9]. In a soft decision-based scheme, the CRs forward the energy estimates to the FC and FC combines them in order to take the decision about the presence of the pri-mary signal. In [8], the set-up of [7] is generalized to the scenario when the CRs collect very large number of data samples to take binary decisions. The optimized value of the local threshold in the CRs is numeri-cally calculated by minimizing the total probability of error.
Energy detector is proposed for cognitive spectrum sensing because it needs no information about the pri-mary signal and has lower complexity in real-time detec-tion of spectrum hole. For the detecdetec-tion of unknown deterministic signals corrupted by the additive white Gaussian noise (AWGN), an energy detector is derived in [10]. Performance analysis of the energy detector for ran-dom signals is studied in [11]. The performance of the energy detector for unknown transmit signal in AWGN and fading environment is discussed in [12]. In [13], optimal soft combination scheme for received energy data is explained. The detail study regarding the perfor-mance of spectrum sensing in different scenario is done in [14-24].
In this paper, we consider a collaborative cognitive radio network which utilizes a finite number of sam-ples for deciding the presence or absence of the primary signals. The cognitive network contains two secondary users and one FC. We consider a cognitive set-up, where the CRs do not take decision about the spectrum hole based on their local thresholds. Nevertheless, they can update the local thresholds as per the channel between the primary user and the CRs. These local thresholds are conveyed to the FC and the FC updates its global threshold accordingly. The CRs forward their energy esti-mates to the FC over noiseless reporting channels and the FC takes decision about the spectrum hole based on
the normalized global and local thresholds. In selective soft combining, the FC combines the energy estimates of both CRs for making a decision of the primary sig-nal only if their energy estimates are above the local threshold.
Expressions of the probability of false alarm and the probability of missed opportunity for this collaborative system are derived for the proposed selective combing scheme. The global and local thresholds are optimized by minimizing the total probability of error in detection of a spectrum hole. The proposed scheme of selective soft combination significantly outperforms the conventional soft and 1-bit hard combining schemes. It is also shown that the total probability of error minimization criterion is able to utilize a spectrum hole more efficiently as com-pared to the NP criterion while keeping the interference to the primary user (PU) within the desired limits for the signal-to-noise ratio (SNR) of the PU-CR link considered in simulations.
The rest of the paper is organized as follows. In Section 2, the system model of the cognitive radio net-work is explained. Performance analysis of the proposed scheme of selective soft combining and semi-selective soft combining is discussed in Section 3. Optimization of the normalized global and local thresholds is also performed in this section.
Section 4 discusses optimization of non-selective soft combining and 1-bit hard combining schemes for arbi-trary number of CRs under the total probability of error minimization criterion. Numerical results are discussed in Section 5. In Section 6, some conclusions are drawn.
2 System model
We consider a cognitive network consisting of two sec-ondary users S1 and S2, one primary user and a fusion center FC, as shown in Figure 1. In this cognitive radio net-work, it is possible that the spectrum allocated for the PU is not utilized at some time; therefore, the secondary users monitor the spectrum continuously in order to make sure that detection of signals transmitted by the PU cannot be ignored at any instance of time. To enhance the reliability of spectrum usage, interference to the PU from secondary users should be kept very low [3]. In our analysis, we will
focus on how to minimize the interference to the PU while minimizing the probability of error in detecting the spec-trum hole such that the free specspec-trum can be efficiently utilized. It is assumed that only one PU is in operation with highest priority to use its allocated spectrum as com-pared to each secondary user. In the cognitive network considered in Figure 1, there exists two hypotheses at the k-th time instant
H0: yi(k)=vi(k), if PU is absent,
H1: yi(k)=shi(k)+vi(k), if PU is present,
(1)
whereyiis the received signal ini-th CR,iis the secondary
user index (i = 1, 2),sdenotes the signal transmitted by the primary user with energy Es, vi(k) ∼ CN(0,σn2) is
circularly symmetrical complex additive white Gaussian noise (AWGN), and hi(k) ∼ CN(0,σh2) is the
com-plex normal circularly symmetrical channel gain between the PU andi-th CR, implying Rayleigh fading. The vari-ance of the signal received at each secondary user under hypothesisH0isσn2, while that underH1is given by
σhn2 =σh2Es+σn2. (2)
We assume that the local threshold of detection for each secondary user is the same and is given asλ. This assumption is valid when both CRs exist at the same dis-tance from the PU. CRs can update λaccording to the SNR ratio of the links between the PU and the CRs. It is assumed that the value ofλis also known in the FC. We callλas local threshold because of local spectrum sens-ing is performed at individual CR. As decision is taken globally in the FC, we refer λ0 by global threshold of detection in the FC. Energy estimates of each CR nor-malized with number of samples is termed assummary statisticsin this paper. Each secondary user calculates a summary statisticsuiover a finite detection interval ofL
samples as
ui=
1 L
L−1
k=0
|yi(k)|2. (3)
The summary statistics are transmitted to the FC through a lossless control channel using orthogonal time slots or orthogonal frequency bands. The FC computes a global test statistics as
U=u1+u2. (4)
The characteristic function (c.f.) of U obtained from Eq. (3) in the case of hypothesisH0is given as [25]
ψU|H0(jω)=
1
1−jωσn2 L
2L, (5)
Similarly, from Eq. (3), the c.f. ofUunder hypothesisH1 will be [25]
ψU|H1(jω)=
1
1−jωσhn2 L
2L. (6)
By taking the inverse Fourier transform of Eqs. (5) and (6), the probability density functions (p.d.f.s) ofUunder hypothesesH0andH1can be obtained as
fU|H0(x)=
L2Lexp−σxL2
n
x2L−1
σ4L n (2L)
(7)
and
fU|H1(x)=
L2Lexp
−xL
σ2
hn
x2L−1
σhn4L(2L) , (8)
respectively, where (a) is the Gamma function [26, Eq. (6.1.1)].
3 Performance analysis of the combining schemes In binary hypothesis problem, we are interested in finding the hypothesis which is true. It may beH1orH0 depend-ing upon the decision region. Here, we will focus our attention to the Bayes criterion for decision based on the received data. The expression of the Bayesian riskRcan be written using [27, Eq. (5), Chapter (2)] as follows:
R=C00P0
Z0
fU|H0(x)dx+C10P0
Z1
fU|H0(x)dx
+C11P1
Z1
fU|H1(x)dx+C01P1
Z0
fU|H1(x)dx, (9)
whereP0andP1denotea prioriprobabilities of hypothe-ses H0 andH1, respectively,Z1 andZ0 are the decision regions corresponding to hypothesesH1andH0, respec-tively, while C00, C10, C11, C01 denote cost assigned as follows [27]:
1. C00corresponds to the cost of deciding hypothesis H0when hypothesisH0is true,
2. C10corresponds to the cost of deciding hypothesis H1when hypothesisH0is true,
3. C11corresponds to the cost of deciding hypothesis H1when hypothesisH1is true,
4. C01corresponds to the cost of deciding hypothesis H0when hypothesisH1is true.
In CR spectrum sensing, when the primary signal is present and the CR decides that it is not present, then it causes interference to the PU and leads to overuti-lization of the spectrum. Similarly, when the CR decides a the PU signal is present and actually it is not, then spectrum hole is underutilized. Therefore, we consider that cost assigned in both types of error is set as unity.
For designing a minimum total probability of error-based receiver, we also assume that two hypotheses H0 andH1are equally likely [27] such thatP0 = P1 = 0.5. With these assumptions, Eq. (9) can be written as
R= 1
It can be deduced that Eq. (10) refers to the total probabil-ity of error or average probabilprobabil-ity of error in deciding the presence or absence of the primary signal. In our analy-sis, we have chosen this type of error criterion specifically in order to minimize the total probability error. It will be shown in Section 5 that the total probability of error crite-rion enables the cognitive system to utilize free spectrum more efficiently than the NP criterion, for certain SNR values considered in simulations.
The probability of false alarm Pf and probability of
missed detectionPmare defined as [27]
Pf
Therefore, substituting Eqs. (11) and (12) in Eq. (10), we get
R= 1 2Pf +
1
2Pm. (13)
For the two-CR-based cognitive set-up considered in Section 2, decision regionsZ1corresponding to the detec-tion of the PU are given as
1. u1> λ,u2> λ, andu1+u2> λ0, 2. u1> λ,u2< λ, andu1+u2> λ0, 3. u1< λ,u2> λ, andu1+u2> λ0, 4. u1< λ,u2< λ, andu1+u2> λ0.
The decision regions corresponding to non-detection of the PU, i.e.,Z0will be complimentary to the decision regions ofZ1in all above conditions. The detection region corresponding to u1 < λ, u2< λ, and u1+u2 > λ0is non-zero forλ0<2λonly.
3.1 Proposed selective combining scheme
It is beneficial to check the received signal at each CR and include those signals, which are above a local thresh-old λ, in making the final decision in the FC. Let us
consider a soft combining-based scheme, where the FC takes decision of the presence or absence of the spec-trum hole when u1 > λ, u2 > λ, and u1 + u2 > 2λ. Hence, selective combining in the FC concerns with the fact that both CRs contribute in the decision about the presence or absence of the primary signal provided that energy estimates of both CRs are above the local threshold λ. Intuitively, the selective combining scheme guarantees the minimum total probability of error in the detection of spectrum hole. Motivated by this fact, we consider a proposed scheme for soft combination of received data in which decision region isu1 > λ,u2 > λ, andu1+u2 > λ0. We will evaluate the performance of the proposed selective combining scheme by deriving the expressions of the probability of false alarm and the probability of missed opportunity for this collaborative system.
3.2 Total probability of error of the selective combining scheme
For finding performance analysis of the proposed soft combining scheme, we split our analysis into three parts
λ0>2λ,λ0=2λ, andλ0<2λ.
3.2.1 Total probability of error of the selective combining
scheme forλ0>2λ
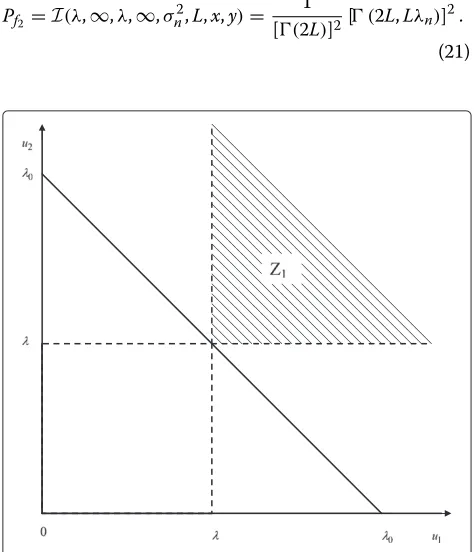
From Figure 2, it is found that the detection region for primary signal is shaded region labeled asZ1.The proba-bility of false alarmPf1 can be obtained from Eq. (11) and
Figure 2 as follows:
Pf1 =I(λ,∞,λ,∞,σ
Further simplifying Eq. (14), we get
Figure 2Decision regions for detection and non-detection of the primary signal forλ0>2λ.Shaded regionZ1corresponds to the detection region of the primary signal and unshaded region corresponds toZ0which denotes the region of non-detection of the primary signal.
where (a,x)is the upper incomplete Gamma function given as (a,x)=x∞ta−1exp(−t)dt [26, Eq. (6.5.3)]. By using series expansion of the incomplete Gamma function
(a,x)=(a−1)!e−xak−=10xkk! in Eq. (16) and after some algebraic simplification of the integral, we have
Pf1 = 1
(2L)exp(−Lλ0n) 2L−1
l=0 l
i=0
l i
× (−1)l−i(Lλ0n)i[(Lλ0n−Lλn)l+2L−i−(Lλn)l+2L−i] l!(l+2L−i)
+ 1
[(2L)]2 (2L,Lλn) (2L,Lλ0n−Lλn), (17)
whereλ0n=λ0/σn2denotes thenormalized global
thresh-old, λn = λ/σn2 denotes the normalized local
thresh-old, and li = i!(ll−!i)!. The expression of probability of missed detectionPm1 for the proposed selective
combin-ing scheme can be obtained uscombin-ing Eq. (12) and Figure 2 as
Pm1=I(0,∞, 0,∞,σ
2
hn,L,x,y)−I(λ,∞,λ,∞,σhn2,L,x,y)
+I(λ,λ0−λ,λ,λ0−x,σhn2,L,x,y).
(18)
After simplification of Eq. (18), we get
Pm1=1−
1
(2L)exp
− Lλ0n
1+γ
2L−1
l=0 l
i=0
l i
×
(−1)l−i
Lλ0n 1+γ
iL
λ0n−Lλn
1+γ
l+2L−i
−Lλn 1+γ
l+2L−i
l!(l+2L−i)
− 1
[(2L)]2
2L, Lλn 1+γ
2L,Lλ0n−Lλn 1+γ
,
(19)
where γ = Esσh2/σn2 is theaverage signal-to-noise ratio
(SNR) of the PU-CR link.
Total probability of error forλ0 > 2λcan be obtained using Eq. (13) as
Pe1 =
Pf1+Pm1
2 . (20)
3.2.2 Total probability of error of the selective combining
scheme forλ0=2λ
The expression of probability of false alarmPf2for the
pro-posed scheme can be obtained using Eq. (11) and Figure 3 as
Pf2 =I(λ,∞,λ,∞,σ
2
n,L,x,y)=
1
[(2L)]2[ (2L,Lλn)] 2.
(21)
From Figure 3 and Eq. (12), the probability of missed detectionPm2of the proposed scheme will be
Pm2=I(0,∞, 0,∞,σ
We can obtain the expression of the total probability of error forλ0=2λusing Eq. (13) as
Pe2 =
Pf2+Pm2
2 . (24)
3.2.3 Total probability of error for proposed scheme when
λ0<2λ
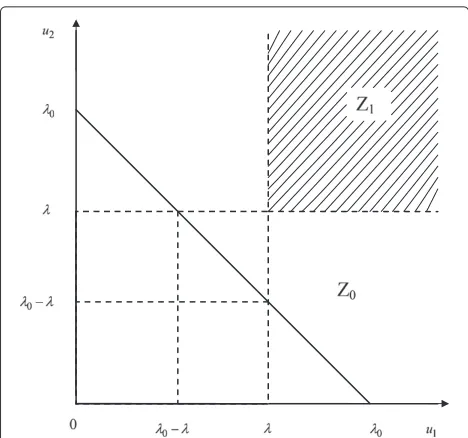
It can be seen from Figures 3 and 4 that the detection region of the primary signalZ1forλ0<2λis the same as that ofλ0 = 2λ; therefore, the probability of false alarm Pf3 for λ0 < 2λ is given by Eq. (21). Similarly, it can
be observed from Figures 3 and 4 that the probability of missed detection forλ0<2λwill be given using Eq. (23). Hence, the total probability of errorPe3ofλ0<2λis equal
toPe2.
Figure 4Decision regions for detection and non-detection of the primary signal forλ0<2λ.Shaded regionZ1corresponds to the detection region of the primary signal and unshaded region corresponds toZ0which denotes the region of non-detection of the primary signal.
3.3 Optimization of the proposed selective soft
combining scheme
In this subsection, we will discuss the optimization of the local and global thresholds of the proposed soft com-bining scheme. The optimization is divided into three different parts, i.e.,λ0>2λ,λ0=2λ, andλ0<2λ.
3.3.1 Optimization of thresholds forλ0>2λ
By partially differentiating Eq. (20) with respect to (w.r.t.) the normalized global thresholdλ0n, we get
We can solve Eq. (25) numerically to find the optimum value ofλ0n. In order to obtain optimal value of local
nor-malized thresholdλn, partially differentiate Eq. (20) w.r.t. λn, to get
For finding an optimal value ofλn, we need to numeri-cally solve Eq. (28). We can also numerinumeri-cally find the joint values ofλ0nandλnsuch that total probability of error is minimized [28].
Let us find the optimum value of the global thresh-oldλ0n with a single received data sample and the local
threshold in each CR set to zero, i.e.,λn =0. On partially
differentiating Eq. (20) w.r.t.λ0nwhenλn =0 and setting
the result to zero, we get
λ∗0n=4
where λ∗0n denotes the optimal value of the normalized global threshold in the proposed scheme. It will be shown by simulations in Section 5 that the minimum probabil-ity of error in detection of a spectrum hole is achieved for
λn=0.
3.3.2 Optimization of thresholds forλ0≤2λ
Since the total probability of error forλ0 = 2λandλ0 <
2λis the same, we can consider them together as λ0 ≤
2λfor optimization of the thresholds. In order to obtain
the optimal value ofλn, we need to partially differentiate
Eq. (24) w.r.t.λn, to get
We can numerically solve Eq. (32) to find the optimized value ofλn.
3.4 Performance analysis of semi-selective combining
scheme
In the semi-selective combining scheme, the FC combines the energy estimates of the CRs corresponding to detec-tion region Z1 for the condition thatu1 > λ, u2 < λ, andu1+u2 > λ0,u1 < λ,u2 > λ, andu1+u2 > λ0, andu1 < λ, u2 < λ, andu1+u2 > λ0 also in addi-tion tou1 > λ,u2 > λ, andu1+u2 > λ0considered in previous subsections. By following the procedure given in Section 3.1, we can split the analysis into three parts
λ0 > 2λ,λ0 = 2λ, andλ0 < 2λand obtain the proba-bility of false alarm and missed detection for these three conditions as followsa.
3.4.1 Probability of false alarm and missed detection for
λ0>2λ
Whenu1 > λ,u2 < λ,u1+u2 > λ0, andλ0 > 2λ, the probability of false alarm and missed detection will be
P(f1) and missed detection probabilities will be found as
In case ofu1 < λ,u2< λ,u1+u2> λ0, andλ0 >2λ, the detection region will be zero and probability of miss will be one.
3.4.2 Probability of false alarm and missed detection for
λ0=2λ
The probability of false alarm and missed detection for u1> λ,u2< λ,u1+u2> λ0, andλ0=2λwill be and missed detection probabilities will be as follows:
Pf(2) detection region will be zero and probability of miss will be one.
3.4.3 Probability of false alarm and missed detection for
λ0<2λ
The probability of false alarm and missed detection for u1> λ,u2< λ,u1+u2> λ0, andλ0=2λare
The false and missed detection probabilities foru1< λ, u2> λ,u1+u2> λ0, andλ0>2λcan be obtained as the false and missed detection probabilities will be
P(f3)
The semi-selective soft combining scheme can be mized by the procedure given in Section 3.2, and opti-mized values of the local and global thresholds can be obtained by the total probability of error minimization criterion.
4 Soft and hard combination schemes for more than two CRs
4.1 Non-selective soft combination scheme for more than two CRs
In the non-selective soft combining scheme for more than two users, the FC always combines the energy estimates of all CRs for taking a decision. When the FC does not use the local threshold for decision making, the non-selective soft combining scheme is similar to the scheme discussed in [4,13] for arbitrary number of CRs. However, in [4,13], the NP criterion is used for finding the opti-mized value of the global threshold. Moreover, the existing schemes [4,13] consider a slowly varying Rayleigh fading channel for analysis. It can be seen from Eq. (1) that we consider a fast fading Rayleigh channel between the PU and CRs in our analysis. In addition, it can be seen from Section 3.3 that we use the total probability of error for finding the optimized value of the threshold. Therefore, we need to derive the expression of the total probability of error for the conventional non-selective soft combin-ing scheme of [4,13], and based on that, we can find a closed form expression of the optimal value of the global threshold.
In the non-selective soft combining scheme, each CR forwards the energy estimate over noiseless channel to the FC, and the FC takes the decision about the spectrum hole based on the global thresholdλ0.
Let the number of secondary users or CRs be denoted byK. Each secondary user calculates a summary statistics uiover a finite detection interval ofLsamples as
ui= mitted to the FC through a lossless control channel using orthogonal time slots or orthogonal frequency bands. The FC computes a global test statistics as
U=
K
i=1
ui, (48)
which is compared with a predefined thresholdλ0to make a decision about the presence of the PU. It can be noted from Eq. (48) that the process of combining summary statistics is similar to equal-gain combining.
From Eq. (48), the c.f. ofUin the case of hypothesesH0
respectively. By taking the inverse Fourier transform of Eqs. (49) and (50), the p.d.f.s ofU under hypothesesH0 andH1can be obtained as
respectively. The decision rule in the FC is
U=
From Eqs. (51) and (52), we can obtain theprobability of false alarm Pf in FC as
and theprobability of missed detection Pmin the FC as
Pm=
The total error probability for equiprobable hypotheses is expressed from Eqs. (54) and (55) by
Pe=
Next, the optimal value ofλ0ncan be found by partially
differentiating Eq. (56) w.r.t.λ0nand setting the result to
zero. The partial derivative of Eq. (56) w.r.t.λ0nwill be
∂Pe
By equating Eq. (57) to zero and after some manipula-tions, we get the closed form expression of the optimized normalized global threshold as
λ∗0n=K
4.2 One-bit hard combination scheme
error analysis of a non-selective 1-bit hard combination scheme over slowly fading Rayleigh channels is performed in [7], we will find the total probability of error and opti-mized value of the local threshold for fast fading Rayleigh channels for comparison with the proposed selective com-bining schemes. In hard comcom-bining scheme, each CR takes a binary decision about the presence or absence of the pri-mary signal using energy detector. The FC combines these binary decisions to find the presence or absence of the PU as follows [7]:
D=
K
i=1
di, (59)
where D is the sum of the all 1-bit decisions from the CRs. Letn,n≤Kcorresponds to a number of cooperating CRs out ofK CRs. The FC uses a majority rule for deciding the presence or absence of the PU. As per the majority decision rule if Dis greater than n, then hypothesisH1 holds otherwise the hypothesisH0is true. The hypotheses H0andH1can be written as [7]
H0: D<n, if PU is absent, (60)
H1: D≥n, if PU is present. (61)
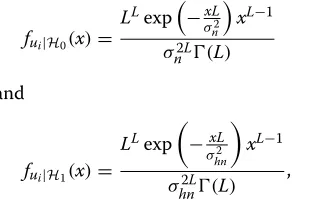
The p.d.f.s ofui under hypothesesH0andH1 can be obtained after some algebra as
fui|H0(x)=
LLexp
−xL
σ2
n
xL−1
σ2L n (L)
(62)
and
fui|H1(x)=
LLexp
−xL
σhn2
xL−1
σhn2L(L) , (63)
respectively. The decision rule in thei-th,i=1, ...,K, CR is
ui
PU present ≷ PU absent
λ. (64)
From Eqs. (62), (63), and (64), we get the probability of false alarmPf and probability of missed detectionPm in
each CR as
Pf =
(L,Lλn)
(L) , (65)
Pm=1−
L, Lλn
1+γ
(L) . (66)
The probability of false alarmPFin the FC for cooperative
sensing will be [7]
PF =Pr(H1|H0)= K
l=n
K
l
Plf(1−Pf)K−l, (67)
and the probability of missed detectionPMin FC will be
[7]
PM=Pr(H0|H1)=1− K
l=n
K
l
(1−Pm)l(Pm)K−l.
(68)
The total error rate of the hard combining-based coop-erative scheme will be the sum ofPFandPM. The optimal
number of CRs and optimized value of the local thresh-old can be calculated by minimizing the total error rate as shown in [7].
5 Numerical results
We consider a cognitive system with one PU, two CRs, and a FC for simulations. Moreover, we use local and global thresholds normalized with noise variance σn2 in simulations. In Figure 5, the total probability of error ver-sus normalized global thresholdλ0nplots of the proposed
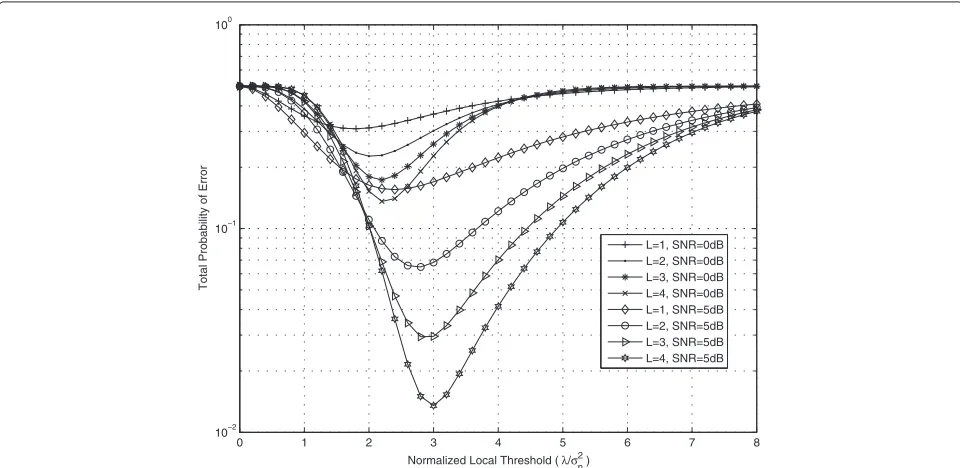
selective soft combining scheme with different number of received samplesL = 1, 2, 3, 4 and PU-CR link SNR=0, 5 dB are shown. It can be seen from Figure 5 that the total probability of error is a convex function of the normalized global threshold in the proposed selective soft combining scheme. The total probability of error is calculated from Eq. (20). It can be observed from Figure 5 that by increas-ing the number of samples and SNR, very low value of the total probability of error can be achieved.
Figure 6 shows that the total probability of error obtained from Eq. (24) is a convex function of normalized local threshold in the proposed selective soft combining scheme when λ0 < 2λ. Moreover, it can be seen from Figure 6 that the total probability of error reduces by increasing number of data samples and SNR of the PU-CR link. It can be observed from Figures 7, 8, and 9 that for a singlereceived data sample, it is possible to minimize the total probability of error at a given SNR of the PU-CR link by an optimized global threshold in the proposed selective soft combining scheme.
0 2 4 6 8 10 12 14 16 18 20 10−3
10−2 10−1 100
Normalized Global Threshold ( λ0/σ 2 n )
Total Probability of Error
L=1, SNR=0dB L=2, SNR=0dB L=3, SNR=0dB L=4, SNR=0dB L=1, SNR=5dB L=2, SNR=5dB L=3, SNR=5dB L=4, SNR=5dB
Figure 5Total probability of error versus normalized global threshold plots of the proposed selective soft combining scheme.With two CRs;λn=0; different number of samplesL=1, 2, 3, 4; and SNR = 0, 5 dB.
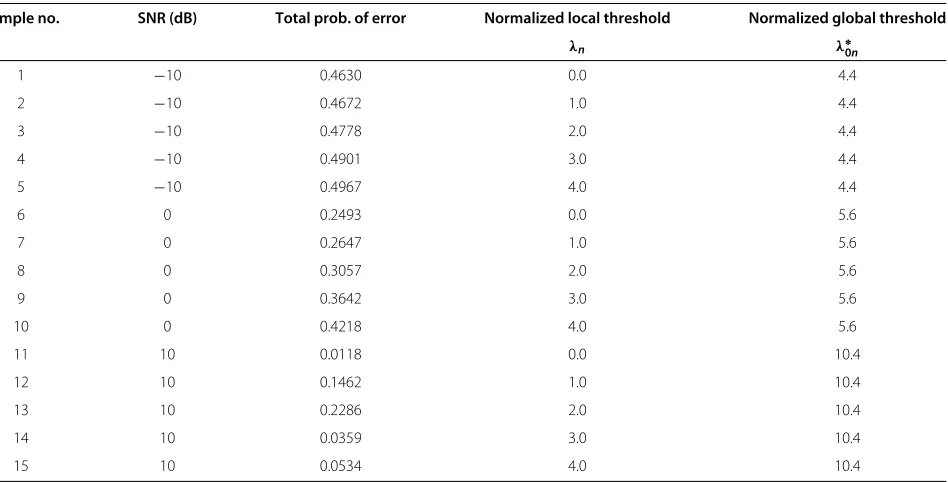
minimum value of total probability of error at optimal value of the normalized global threshold of the proposed selective soft combining scheme with two CRs,L=1, and SNR =−10, 0, 10 dB for different numbers of normalized local threshold. It can be concluded from Table 1 that as
theλnis increased to 4.0, a given SNR total probability of error also increases.
In Figure 10, we have plotted the total probability of error versus SNR of the PU-CR link plots for the proposed selective soft combining scheme, non-selective
0 1 2 3 4 5 6 7 8
10−2 10−1 100
Normalized Local Threshold ( λ/σ2 n)
Total Probability of Error
L=1, SNR=0dB L=2, SNR=0dB L=3, SNR=0dB L=4, SNR=0dB L=1, SNR=5dB L=2, SNR=5dB L=3, SNR=5dB L=4, SNR=5dB
0 5 10 15 20 25 30 10−2
10−1 100
Normalized Global Threshold ( λ0/σ2 n )
Total Probability of Error
SNR = 10dB, L=1
λ/σ2 n=0 and λ0/σ
2 n > 2λ/σ
2 n λ/σ2
n=1and λ0/σ 2 n≤ 2λ/σ
2 n λ/σ2
n=1 and λ0/σ 2 n > 2λ/σ
2 n λ/σ2
n=2 and λ0/σ 2 n≤ 2λ/σ
2 n λ/σ2
n=2 and λ0/σ 2 n > 2λ/σ
2 n λ/σ2
n=3 and λ0/σ 2 n≤ 2λ/σ
2 n λ/σ2
n=3 and λ0/σ 2 n > 2λ/σ
2 n λ/σ2
n=4 and λ0/σ 2 n≤ 2λ/σ
2 n λ/σ2
n=4 and λ0/σ 2 n > 2λ/σ
2 n
Figure 7Total probability of error versus normalized global threshold plots of the proposed selective soft combining scheme.With two CRs,L=1, and SNR = 10 dB.
soft combining scheme, and 1-bit hard combining scheme for two CRs, one received data sample, and λn = 0. It can observed from Figure 10 that the proposed selec-tive soft combining scheme significantly outperforms the non-selective soft and hard combining schemes. In
order to compare the proposed selective and non-selective soft combining schemes under NP and total error minimization criterion, plots of the probabil-ity of detection of spectrum hole and probabilprobabil-ity of false alarm versus SNR of PU-CR link are shown in
0 5 10 15 20 25 30
10−0.6 10−0.5 10−0.4
Normalized Global Threshold ( λ0/σ 2 n )
Total Probability of Error
SNR = 0 dB, L=1
λ/σ2 n=0 and λ0/σ
2 n > 2λ/σ
2 n λ/σ2
n=1 and λ0/σ 2 n≤ 2λ/σ
2 n λ/σ2
n=1 and λ0/σ 2 n > 2λ/σ
2 n λ/σ2
n=2 and λ0/σ 2 n≤ 2λ/σ
2 n λ/σ2
n=2 and λ0/σ 2 n > 2λ/σ
2 n λ/σ2
n=3 and λ0/σ 2 n≤ 2λ/σ
2 n λ/σ2
n=3 and λ0/σ 2 n > 2λ/σ
2 n λ/σ2
n=4 and λ0/σ 2 n≤ 2λ/σ
2 n λ/σ2
n=4 and λ0/σ 2 n > 2λ/σ
2 n
λ σ
λ σ λ σ λ σ
λ σ λ σ ≤ λ σ
λ σ λ σ λ σ
λ σ λ σ ≤ λ σ
λ σ λ σ λ σ
λ σ λ σ ≤ λ σ
λ σ λ σ λ σ
λ σ λ σ ≤ λ σ
λ σ λ σ λ σ
Figure 9Total probability of error versus normalized global threshold plots of the proposed selective soft combining scheme.With two CRs,L=1, and SNR =−10 dB.
Figures 2 and 11, respectively, for a single received data sample.
Under the NP criterion, the non-selective soft com-bining scheme explained in Section 4.1 is optimized as discussed in [4,13]. It can be seen from Figure 11 that the probability of detection underthe total probability of error minimizationcriterion is better than that obtained
using the NP criterion for the selective and non-selective soft combining schemes for the considered SNR val-ues. Moreover, under the total probability of error mini-mization criterion, the proposed selective soft combining scheme significantly outperforms the non-selective soft combining scheme over the range of SNR values used in Figure 11. For example, an SNR gain of approximately
Table 1 Optimal values of normalized global threshold for varying values of normalized local threshold
Sample no. SNR (dB) Total prob. of error Normalized local threshold Normalized global threshold
λn λ∗0n
1 −10 0.4630 0.0 4.4
2 −10 0.4672 1.0 4.4
3 −10 0.4778 2.0 4.4
4 −10 0.4901 3.0 4.4
5 −10 0.4967 4.0 4.4
6 0 0.2493 0.0 5.6
7 0 0.2647 1.0 5.6
8 0 0.3057 2.0 5.6
9 0 0.3642 3.0 5.6
10 0 0.4218 4.0 5.6
11 10 0.0118 0.0 10.4
12 10 0.1462 1.0 10.4
13 10 0.2286 2.0 10.4
14 10 0.0359 3.0 10.4
−10 −8 −6 −4 −2 0 2 4 6 8 10 10−2
10−1 100
SNR (dB)
Total Probability of Error
One−Bit Hard Combination Scheme Non−Selective Soft Combination Scheme Proposed Selective Soft Combination Scheme
Figure 10Total probability of error versus SNR plots.Of the 1-bit hard combination scheme, non-selective soft combination scheme, and proposed selective soft combination scheme for two cognitive radios.
3 dB is achieved at the probability of detection = 0.7 by the proposed selective scheme as compared to the non-selective scheme under the total probability of error criterion. Figure 11 shows that the proposed selective soft combining scheme under the total error probability minimization criterion provides better probability detec-tion than the non-selective soft combining scheme using the proposed total error probability minimization and
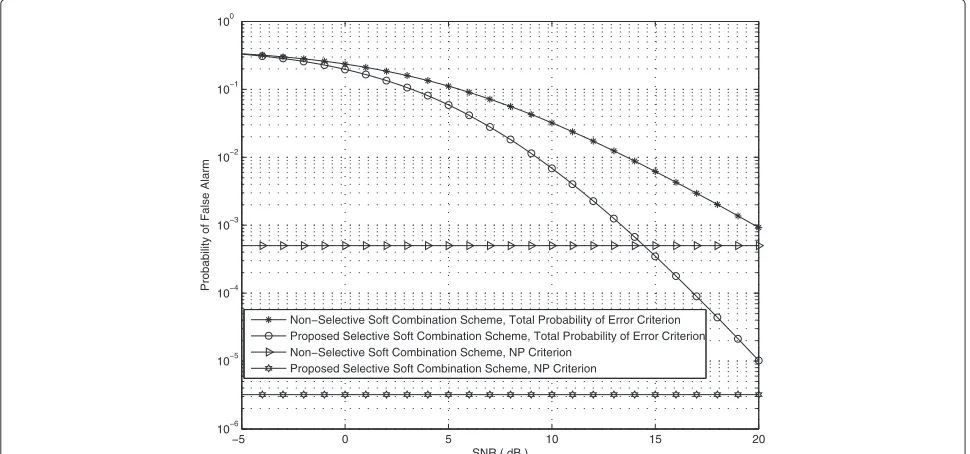
NP criteria for the considered SNR values. The proba-bility of false alarm versus SNR plots of the proposed selective and non-selective soft combining schemes are shown in Figure 12. It can be seen from Figure 12 that the probability of false alarm of the selective and non-selective schemes under the NP criterion is much less than 0.1, which corresponds to the tolerable value of inter-ference at the PU as specified by IEEE 802.22 cognitive
−50 0 5 10 15
0.1 0.2 0.3 0.4 0.5 0.6 0.7 0.8 0.9 1
SNR ( dB )
Probability of Detection
Proposed Selective Soft Combination Scheme, Total Probability of Error Criterion Non−Selective Soft Combination Scheme, Total Probability of Error Criterion Proposed Selective Soft Combination Scheme, NP Criterion
Non−Selective Soft Combination Scheme, NP Criterion
−5 0 5 10 15 20 10−6
10−5 10−4 10−3 10−2 10−1 100
SNR ( dB )
Probability of False Alarm
Non−Selective Soft Combination Scheme, Total Probability of Error Criterion Proposed Selective Soft Combination Scheme, Total Probability of Error Criterion Non−Selective Soft Combination Scheme, NP Criterion
Proposed Selective Soft Combination Scheme, NP Criterion
Figure 12Probability of false alarm versus SNR plots.Of the proposed selective and non-selective soft combination scheme under the NP and total probability of error minimization criteria withL=1.
wireless regional area network (WRAN) standard [29]. Under the NP criterion, this very low (much lower than the tolerance level) value of the probability of false alarm is achieved at the cost of very poor probability of detection, as shown in Figure 11, which leads to significant under-utilization of the available spectrum hole. Whereas, it can be seen from Figures 2 and 11 that the proposed selec-tive combining scheme under the total error minimization criterion provides better probability of detection than the non-selective scheme using the NP criterion while keep-ing the probability of false alarm lower than the specified value, i.e., 0.1 for 3 ≤ SNR ≤ 20. Therefore, the pro-posed selective soft combining scheme along with the total probability of error minimization criterion is able to properly utilize a spectrum hole with interference level less than the specified value. It can be seen from Table 2
that with increasing value ofLof the proposed selective combining scheme, the probabilities of false alarm and missed detection decreases at given SNR =−20,−2 dB. Table 2 shows that requirements proposed in IEEE 802.22 WRAN is not achieved for the proposed selective com-bining scheme when L is varied from 1 to 8 at SNR = −20 dB. However, at SNR = −2 dB, the requirements can be achieved when L = 8 with tCDT = 0.000128 s, wheretCDTdenotes the channel detection time, while no other processing delays are assumed. It can be noted that with increasing number of samples, the time to detect the primary signal will also increase for a given sampling fre-quency. In order to detect a spectrum hole quickly while satisfying IEEE 802.22 WRAN standards, we have con-sidered finite small number of samples in our numerical results.
Table 2 Effect ofLon the performance of cooperative spectrum sensing
L Pfat SNR=−20 dB Pfat SNR=−2 dB Pmat SNR= −20 dB Pmat SNR=-2 dB
1 0.4532 0.2513 0.5390 0.3812
2 0.4812 0.2027 0.5077 0.2917
3 0.4963 0.1657 0.4901 0.2354
4 0.5069 0.1369 0.4775 0.1946
5 0.5151 0.1140 0.4673 0.1631
6 0.5220 0.0956 0.4588 0.1380
7 0.5280 0.0805 0.4513 0.1176
−20 −15 −10 −5 0 5 10 15 20 10−16
10−14 10−12 10−10 10−8 10−6 10−4 10−2 100
SNR (dB)
Probability of False Alarm and Probability of Missed Detection
K=15, NP Criterion, Pf K=10, NP Criterion, P f K=5, NP Criterion, Pf
K=5, Total Probability of Error Criterion, Pm K=5, Total Probability of Error Criterion, P
f K=5, NP Criterion, Pm
K=10, Total Probability of Error Criterion, Pm K=10, Total Probability of Error Criterion, P
f K=15, Total Probability of Error Criterion, P m K=15, Total Probability of Error Criterion, Pf K=10, NP Criterion, P
m K=15, NP Criterion, Pm
Figure 13Probability of false alarm (Pf) and probability of miss (Pm) versus SNR plots.Of the non-selective soft combination scheme under the NP and total probability of error minimization criteria withL=1.
It can be seen from Figure 13 and Table 3 that as the number of CRs is increased from K = 5 toK = 15, the probability of false alarm also increases under NP cri-terion at SNR = 10 dB. However, probability of missed detection reduces with increasing number of CRs from K=5 toK=15 under NP criterion. It can also observed from Figure 13 and Table 3 that at SNR=10 dB, the probability of missed detection decreases with increas-ing number of CRs under total error probability criterion and NP criterion. Table 3 also shows that the probabil-ity of false alarm under total error probabilprobabil-ity criterion is much less than that under the NP criterion; hence, it indi-cates that the total error probability criterion performs better than NP criterion. On the other hand, this improve-ment in the probability of false alarm is achieved at the cost of much higher probability of missed detection. It can also be observed from Figure 13 that at a very low SNR (say−20 dB), there is almost negligible difference in the probabilities of false alarm and missed detection under NP and the total error probability criterion. As the number
of CRs are increased to 15 for single sample of received signal, the values of probability of false alarm and missed detection is almost same. Figure 13 shows that at SNR = 0 dB, the probability of missed detection ≤ 0.1 and probability of false alarm ≤ 0.1 under the total error probability criterion, and hence, the requirement pro-posed in IEEE 802.22 WRAN can be satisfied in this low SNR which is very difficult to achieve in the case of NP criterion.
6 Conclusions
In this paper, we have demonstrated that it is possible for a collaborative cognitive radio network to detect the spectrum hole in an optimal manner by minimizing the total probability of error in decision making with a finite number of the received data samples. It is shown by sim-ulations that the proposed selective scheme for soft com-bination significantly outperforms the non-selective soft and hard combining schemes. Moreover, the total proba-bility of error minimization criterion performs better than
Table 3 Non-selective soft combination scheme with total error probability criterion and NP criterion at SNR=10 dBand
L=1
Number of CRs (K) Pf Pf Pm Pm
(NP criteria) (Total probability of error) (NP criteria) (Total probability of error)
5 0.02925 0.003265 0.002447 0.007718
10 0.4579 8.833e-005 4.663e-008 0.0002002
the NP criterion while keeping the probability of false alarm within the desired limits for specified values of SNR of the PU-CR link.
Endnote
aWe are skipping analytical details here and writing the
final expressions to avoid repetition.
Competing interests
The authors declare that they have no competing interests.
Acknowledgements
This work was partially supported by the IDRC Research Grant RP02253.
Author details
1Department of Electronics and Telecommunication Engineering, National
Institute of Technology - Raipur, Chhattisgarh 492010, India.2Department of Electrical Engineering, Indian Institute of Technology - Delhi, Hauz Khas, New Delhi 110016, India.
Received: 6 August 2011 Accepted: 22 May 2013 Published: 14 June 2013
References
1. S Haykin, Cognitive radio: brain-empowered wireless communications, IEEE J. Sel. Areas Commun.23, 201–220 (2005)
2. RW Broderson, A Wolisz, D Cabric, SM Mishra, D Willkomm,CORVUS: A Cognitive Radio Approach for Usage of Virtual Unlicensed Spectrum. (Univ. California Berkeley Whitepaper, Berkeley, CA, 2004)
3. A Goldsmith, SA Jafar, I Maric, S Srinivasa, Breaking spectrum gridlock with cognitive radios: An information theoretic perspective,Proc. IEEE.97(5), 894–914 (2009)
4. Z Quan, S Cui, AH Sayed, Optimal linear cooperation for spectrum sensing in cognitive radio networks, IEEE J. Sel. Topics in Sig. Proc.2(1), 28–40 (2008)
5. J Unnikrishnan, VV Veeravalli, Cooperative sensing for primary detection in cognitive radio, IEEE J. Sel. Topics in Sig. Proc.2, 18–27 (2008) 6. E Peh, Y-C Liang, inProceedings of the IEEE Wireless Communications and
Networking Conference (WCNC). Optimization for cooperative sensing in cognitive radio networks (March 2007, pp. 27–32. Hong Kong 7. W Zhang, RK Mallik, KB Letaief, Optimization of cooperative spectrum
sensing with energy detection in cognitive radio networks, IEEE Trans. Wireless Commun.8(12), 5761–5766 (2009)
8. Y Liu, C Zeng, H Wang, G Wei, inProceedings of the 2nd International Conference on Advanced Computer Control (ICACC). Energy detection threshold optimization for cooperative spectrum sensing Shenyang, March 2010), pp. pp.566–570
9. JG Proakis, M Salehi,Digital Communications, 5th edn. (McGraw-Hill, New York, 2008)
10. H Urkowitz, Energy detection of unknown deterministic signals, Proc. IEEE.55(4), 523–531 (1967)
11. VI Kostylev, inProceedings of the IEEE Int. Conf. on Communications (ICC’02),
Energy detection of a signal with random amplitude (New York, 28 April–2 May 2002)
12. FF Digham, M-S Alouini, MK Simon, On the energy detection of unknown signals over fading channels, IEEE Trans. Commun.55(1), 3575–3579 (2007)
13. J Ma, G Zhao, Soft combination and detection for cooperative spectrum sensing in cognitive radio networks. IEEE Trans. Wireless Commun.7(11), 4502–4507 (2008)
14. G Ganesan, Y Li, Cooperative spectrum sensing in cognitive radio, part I: two user networks, IEEE Trans. Wireless Commun.6(6), pp.2204–2213 (2007)
15. YC Liang, Y Zeng, Peh ECY, AT Hoang, Sensing-throughput tradeoff for cognitive radio networks, IEEE Trans. Wireless Commun.7(4), pp.1326–1337 (2008)
16. S Atapattu, C Tellambura, H Jiang, inProceedings of the IEEE Int. Conf. on Industrial and Information Systems (ICIIS). Energy detection of primary
signals overη-μfading channels (Sri Lanka, December 2009), pp. pp.118–122
17. S Atapattu, C Tellambura, H Jiang, Energy detection based cooperative spectrum sensing in cognitive radio networks, IEEE Trans. Wireless Commun.10(4), 1232–1241 (2011)
18. SP Herath, N Rajatheva, C Tellambura, Energy detection of unknown signals in fading and diversity reception, IEEE Trans. Commun .59(9), 2443–2453 (2011)
19. S Atapattu, C Tellambura, H Jiang, Performance of an energy detector overcChannels with both multipath fading and shadowing, IEEE Trans. Wireless Commun.9(12), 3662–3670 (2010)
20. EH Gismalla, E Alsusa, Performance analysis of the periodogram-based energy detector in fading channels, IEEE Trans. Sig. Proc.59(8), 3712–3721 (2011)
21. AW Min, X Zhang, KG Shin, Detection of small-scale primary users in cognitive radio networks, IEEE J. Sel. Areas Commun.29(2), 349–361 (2011) 22. S Atapattu, C Tellambura, H Jiang, inProceedings of the IEEE Int. Conf. on
Communications (ICC’11). Spectrum sensing via energy detector in low SNR (Kyoto, June 2011), pp. 5–9
23. S Atapattu, C Tellambura, H Jiang, inProceedings of the IEEE Int. Conf. on Industrial and Information Systems (ICIIS). Spectrum sensing in low SNR: diversity combining and cooperative communications (Kandy, 16–19 August 2011), pp. 13–17
24. P Jia, M Vu, T Le-Ngoc, SC Hong, V Tarokh, "Detection of small-scale primary users in cognitive radio networks," IEEE J. Sel. Areas Commun. 29(2), 276–289 (2011)
25. A Papoulis, SU Pillai,Probability, random variables and stochastic processes, 4th edn. (McGraw-Hill, New York, 2002)
26. M Abramowitz, IA Stegun,Handbook of mathematical functions with formulas, graphs, and mathematical tables, 9th edn. (Dover, New York, 1970)
27. HL Van Trees,Detection, estimation, and modulation theory,(Wiley, New York, 1968). Part 1
28. MR Bhatnagar, A Hjørungnes, M Debbah, Delay-tolerant
decode-and-forward based cooperative communication over Ricean channels,IEEE Trans. Wireless Commun.9(4), 1277–1282 (2010) 29. IEEE P802.22/D0.5, Draft Standard for Wireless Regional Area Networks
Part 22: Cognitive Wireless RAN Medium Access Control (MAC) and Physical Layer (PHY) specifications: Policies and procedures for operation in the TV Bands. (IEEE, Piscataway, 2008)
doi:10.1186/1687-1499-2013-165
Cite this article as:Singhet al.:Threshold optimization of a finite sample-based cognitive radio network using energy detector.EURASIP Journal on Wireless Communications and Networking20132013:165.
Submit your manuscript to a
journal and benefi t from:
7Convenient online submission 7 Rigorous peer review
7Immediate publication on acceptance 7 Open access: articles freely available online 7High visibility within the fi eld
7 Retaining the copyright to your article