ISSN (Print) : 2320 – 3765 ISSN (Online): 2278 – 8875
I
nternational
J
ournal of
A
dvanced
R
esearch in
E
lectrical,
E
lectronics and
I
nstrumentation
E
ngineering
(An ISO 3297: 2007 Certified Organization)
Vol. 5, Issue 6, June 2016
QRS Detection & Its Compression in
Wearable Sensor for Arrhythmia Detection
Nithin John1, Sneha Rachel Philip2
PG Student [Signal Processing], Dept. of ECE, College of Engineering, Kallooppara, Kerala, India1
Assistant Professor, Dept. of ECE, College of Engineering, Kallooppara, Kerala, India2
ABSTRACT: This paper presents a combined technique for the detection of QRS complex and its compression in a wireless wearable ECG monitoring device with minimum complexity using which different Arrhythmias are detected. Linear Predictive coding is the common technique used for QRS detection and compression scheme. Arrhythmia detection is done using wavelet transform and SVM classifier. Detection of QRS waveforms in wearable device helps in the analysis of cardiac health of the patient. Lossless data compression of detected waveforms helps in saving the bandwidth of the channel when it needs to be send to other end. Heart rate is calculated from QRS detection section and a compression ratio of 2.27x is obtained when tested with MIT/BIH Arrhythmia database. 84.14% of Arrhythmia detection accuracy is obtained. Reduced overall complexity and good performance makes the proposed technique suitable for the wearable ECG devices.
KEYWORDS: ECG monitoring, Linear Predictive coding, Lossless data compression,Wearable devices, Compression ratio, MIT/BIH Arrhythmia database
I.INTRODUCTION
Healthcare expenditure is increasing day by day and one of the common diseases in this modern world is the cardiovascular diseases. Cardiovascular diseases are found in all age groups nowadays due to the unhealthy food habits. It is seen that the more number of cardiac deaths happens outside the hospital and only very few people among them are aware of their cardiac health. If we could provide early warnings, it would help them to be alert and take necessary treatments. Many patients with cardiac arrhythmia or silent myocardial ischemia remain undiagnosed and untreated because the abnormalities in ECG occur for small amount of time and usually they are missed. Therefore, we need a 24-H monitoring of cardiac health i.e., we need a wearable wireless ECG monitor.
ISSN (Print) : 2320 – 3765 ISSN (Online): 2278 – 8875
I
nternational
J
ournal of
A
dvanced
R
esearch in
E
lectrical,
E
lectronics and
I
nstrumentation
E
ngineering
(An ISO 3297: 2007 Certified Organization)
Vol. 5, Issue 6, June 2016
II.LITERATURE SURVEY
B.-U. Kohler, C. Hennig, and R. Orglmeister proposed “The principles of software QRS detection,”. In this paper there are approaches based on signal derivatives and digital filters, wavelet based approaches, adaptive filters etc. Frequency range of QRS wave ranges from 10 Hz to 25 Hz. A filter stage prior to detection is employed in most of the approaches to attenuate P wave and other baseline variations so that a well highlighted QRS complex is available at the detection stage .Usually the detection of QRS complex is accomplished by comparing against a threshold. Wavelet Transform (WT) yields a time-scale representation similar to the time-frequency representation of the short-time Fourier transform (STFT). In contrast to the STFT, the WT uses a set of analyzing functions tha tallows a variable time and frequency resolution for different frequency bands. The DyWT(Dyadic Wavelet Transform) is usually implemented using a dyadic filter bank where the filter coefficients are directly derived from the wavelet function used in the analysis The input signal to the filter bank is the sampled ECG signal.[2]
E. Chua and W. Fang proposed “Mixed bio-signal lossless data compressor for portable brain-heart monitoring systems,”. There are many algorithms for biomedical compression in ECG and EEG which are classified as lossy and lossless. In medical fields we mainly use lossless compression techniques. There are also many approaches for compression such as Huffman coding, Arithmetic coding.In Huffman coding, most frequently occurring symbols are associated with short code words and less occurring with long code words whereas in selective Huffman coding only most frequently used symbols are replaced with short code words and the rest are kept as such. But the complexity is more in both approaches since we need a look up table at transmitter and receiver. Most of the algorithms are variable length coding and hence packaging techniques needs to be used.[3]
Can Ye, Miguel Tavares Coimbra and B.V.K. Vijaya Kumar proposed “Arrhythmia Detection and Classification using Morphological and Dynamic Features of ECG Signals”. It presents a method for the recognition of various categories of cardiac arrhythmias based on the morphological and dynamic features extracted from ECG. signals. Wavelet transform and independent component analysis are applied to obtain the morphological information, while RR interval features are computed to obtain a characterization of the dynamic information. The motivation comes from that arrhythmias could be discriminated from the normal heartbeats in terms of both of morphology and dynamics. A support vector machine (SVM) is developed to classify 15 classes of heartbeats. The decisions from the two ECG leads are fused to make the final decision so as to improve the classification confidence.[4]
III.PROPOSED METHOD
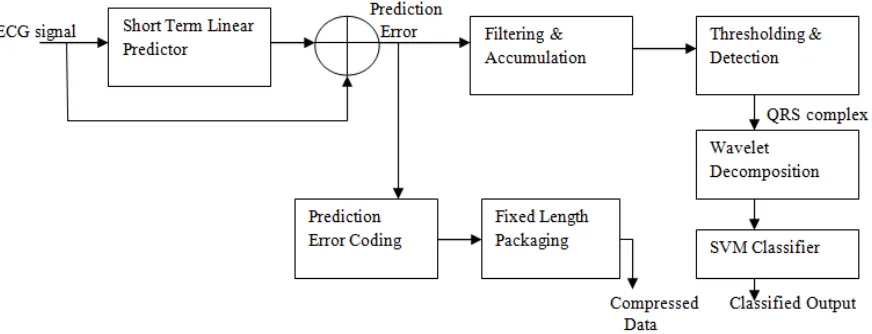
The overall block diagram of the scheme is given in Figure 1. It mainly consist of three sections :QRS detection ,compression and Arrhythmia detection.
ISSN (Print) : 2320 – 3765 ISSN (Online): 2278 – 8875
I
nternational
J
ournal of
A
dvanced
R
esearch in
E
lectrical,
E
lectronics and
I
nstrumentation
E
ngineering
(An ISO 3297: 2007 Certified Organization)
Vol. 5, Issue 6, June 2016
A forward predictor is used to estimate current sample from previous samples and is given by the equation[1]
m k k k n x h n x 1 ^ ) ( )( (1)
Where is the estimated value, is the predictor coefficient. Short term linear predictor is closely able to predict P and T wave and other baseline variations. But QRS complex part is not exactly predicted due to its structure i.e., the steep variations in amplitudes. Error in estimated value is obtained as follows[1]
) ( ) ( ) ( ^ n x n x n
e (2)
QRS wave will have a large value of e(n) comparing to the other parts of ECG. With further processing on e(n), QRS complex can be extracted . Also linear predictive coding is a main part of lossless compression techniques. Hence predictors can be jointly used to detect and compress the ECG signal thereby reducing the complexity. The devices complexity would have been more if we had used two different methods for detection and compression. The overall block diagram of the model is given in figure (1) . Adaptive predictor uses a SSLMS (Sign Sign Least Mean Square ) algorithm as it has less complexity compared to other algorithms .It is defined as follows[1]
SSLMS h(n+1)=h(n)+μ.sgn((e(n) ).sgn(x(n)) (3)
Here μ represents step size, h(n+1) and h(n) are updated and present coefficients respectively. Linear predictor order
also has importance since it affects the performance and compression ratio as explained in [1]. It has been chosen as 4 and the step sizes needs to be updated. Initially the step size is taken large in order to adapt faster. Once the predictor coefficients are updated based on incoming signal , a smaller step size of 0.00001 is used.
a) QRS DETECTION
The prediction error not only contains information about QRS wave but it also has high frequency impulse noise. In order to filter it out, we use S.G. filters[5]. Filtering action is same as discrete convolution with impulse noise. Once the noise is filtered out, prediction error is enhanced by squaring and moving sum operation given by
2 2 2 ) ( _ ) ( m m n n sg e neno (4)
As signal amplitudes vary across patients and based on external conditions an adaptive thresholding mechanism is used. Initial threshold set is changed to a new threshold based on maximum value of signal during training period .Every time the signal exceeds the threshold ,the peak detection algorithm searches and locates the presence of the peak. Average threshold is computed as 25% of average of last four detected peaks. The peak amplitude is limited to 2 times the previously detected peaks. To prevent lock up condition threshold reduction mechanism is also employed[1]
4 1 4 1* i i avg RRRR (5)
If a new peak is not detected during this period ,the new threshold is set as 75% of original value. Precautions are taken such that algorithm does not take noise signals Peak detection algorithm starts when filtered signal exceeds the threshold. The algorithm finds a continuously rising edge and then a falling edge within a specific period of time. Once a rising edge is detected ,it looks for a falling edge with 100ms.If there is a rising edge ,previously detected peaks are discarded and timer restarts. The maximum signal amplitude within this search window when there is a detection is considered as new threshold. If a falling edge is present , algorithm looks for presence of previous peaks within 35% duration of interval failing which a detection is immediately declared
ISSN (Print) : 2320 – 3765 ISSN (Online): 2278 – 8875
I
nternational
J
ournal of
A
dvanced
R
esearch in
E
lectrical,
E
lectronics and
I
nstrumentation
E
ngineering
(An ISO 3297: 2007 Certified Organization)
Vol. 5, Issue 6, June 2016
ISSN (Print) : 2320 – 3765 ISSN (Online): 2278 – 8875
I
nternational
J
ournal of
A
dvanced
R
esearch in
E
lectrical,
E
lectronics and
I
nstrumentation
E
ngineering
(An ISO 3297: 2007 Certified Organization)
Vol. 5, Issue 6, June 2016
b) COMPRESSION
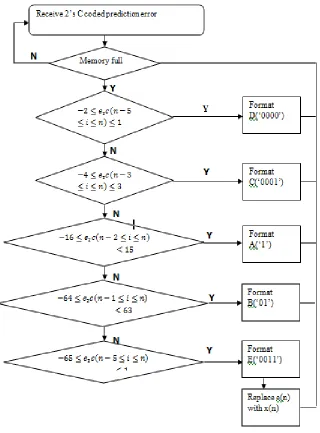
Firstly, prediction error obtained in previous section is 2’s compliment encoded and then the compression steps. We have seen that dynamic range of prediction error lies around zero and hence can be represented in a few LSB’s. The compression process is done in such a way that unwanted MSB’s are discarded. The number of bits to be used for each sample is based on amplitude comparison. If the amplitude lies within a specific range we use specified number of bits to represent it. Since we use a variable length encoding, headers are used to identify them at the decoding section. For example, if the amplitude level is between -2 and 1, we use 2 bits to represent the sample and framing format used is D(‘0000’). Figure 3 shows the entire coding packaging scheme used here. It’s a simple bit packaging scheme which can pack data samples of varying bit widths dynamically to produce a fixed-length data output of 16 bits.
ISSN (Print) : 2320 – 3765 ISSN (Online): 2278 – 8875
I
nternational
J
ournal of
A
dvanced
R
esearch in
E
lectrical,
E
lectronics and
I
nstrumentation
E
ngineering
(An ISO 3297: 2007 Certified Organization)
Vol. 5, Issue 6, June 2016
c) ARRHYTHMIA DETECTION
The QRS complexes from QRS detection stage are directly used here for feature extraction using wavelet transform. Here we use a 8 level wavelet decomposition from which detail coefficients from D3 to D7 are taken in coefficient selection part and it is used as a feature for training as well as testing part. Features of different arrhythmias to be classified are extracted in training phase and models are generated accordingly by the SVM classifier. In the testing phase features of corresponding arrhythmias are extracted and they are checked with the models from training phase and are classified accordingly. The type of arrhythmia occurring can be thus detected
Fig 4: Arrhythmia detection block diagram
The block diagram of detection is given in Figure 4. We approximate the width of individual beat to 300 sample data and the extracted beat is centered on detected QRS peaks[6]. For each QRS peak, we cut off the continuous signal for each beat start at R-99 pos until R+200 pos, therefore we will get a beat with 300 sample data in width.
IV. RESULT AND DISCUSSION
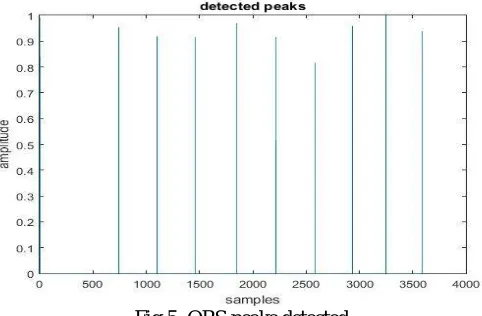
The performance of the proposed algorithm is evaluated using the MIT/BIH Arrhythmia database. The MIT/BIH database is a benchmark database with 48 half-hour two-channel ambulatory ECG recordings. These recordings have 11-bit resolution over10 mV and are sampled at 360 Hz[7].Heart rate of the patient can be calculated by the information obtained by QRS detection section. Heart rate is the number of heartbeats per unit of time, usually per minute. The heart rate is based on the number of contractions of the ventricles. The figure5 shows QRS detection output at the last stage.
ISSN (Print) : 2320 – 3765 ISSN (Online): 2278 – 8875
I
nternational
J
ournal of
A
dvanced
R
esearch in
E
lectrical,
E
lectronics and
I
nstrumentation
E
ngineering
(An ISO 3297: 2007 Certified Organization)
Vol. 5, Issue 6, June 2016
The obtained signal is compressed using proposed compression algorithm and bit compression ratio(BCR) of 2.276x is obtained. BCR is calculated as
(6)
Where and refers to the bit widths of uncompressed and compressed samples, respectively. Data from the MIT-BIH arrhythmia database were used in this study, which includes many recordings of both common and life-threatening arrhythmias like Left Bundle Branch Block beat(LBBB),normal beat (N), right bundle branch block beat (RBBB), premature ventricular contraction (PVC) etc. The classification is shown in table 1
Table 1:Arrhythmia detection output
The accuracy of Arrhythmia detection is 84.14 on an average for different sets of Arrhythmias used for testing purpose.
V. CONCLUSION
ISSN (Print) : 2320 – 3765 ISSN (Online): 2278 – 8875
I
nternational
J
ournal of
A
dvanced
R
esearch in
E
lectrical,
E
lectronics and
I
nstrumentation
E
ngineering
(An ISO 3297: 2007 Certified Organization)
Vol. 5, Issue 6, June 2016
REFERENCES
[1] C. J. Deepu, Yong Lian, “A Joint QRS Detection and Data Compression Scheme for Wearable Sensors ”,IEEE Transactions Biomed. Eng., vol. 62, no. 1, january 2015.
[2] B.-U. Kohler, C. Hennig and R. Orglmeister,“The principles of software QRS detection,” IEEE Eng. Med. Biol. Mag., vol. 21, no. 1. pp. 42–57, Jan./Feb. 2002.
[3] E. Chua and W. Fang, “Mixed bio-signal lossless data compressor for portable brain-heartmonitoring systems,” IEEE Trans. Consum. Electron.,vol. 57, no. 1, pp. 267–273, Feb. 2011.
[4] Can Ye, Miguel Tavares Coimbra and B.V.K. Vijaya Kumar, “Arrhythmia Detection and Classification using Morphological and Dynamic
Features of ECG Signals,”32nd Annual International Conference of the IEEE EMBS Buenos Aires, Argentina, August 31 - September 4, 2010. [5] R. W. Schafer, “What Is a Savitzky-Golay filter?” IEEE Signal Process. Mag., vol. 28, no. 4. pp. 111–117, Jul. 2011.
[6] Ayman Rabee and Imad Barhumi, “ECG Signal Classification Using Support Vector Machine Based On Wavelet Multi resolution Analysis,” The 11th International conference on Information Sciences,Signal Processing and their Applications 2012.
[7] G. B. Moody and R. G. Mark, “The impact of the MIT-BIH Arrhythmia database,” IEEE Eng. Med. Biol.Mag., vol. 20, no. 3. pp. 45–50, May/Jun. 2001.
[8] E. S. Winokur, M. K. Delano, and C. G. Sodini, “A wearable cardiac monitor for long-term data acquisition and analysis,” IEEE Trans. Biomed. Eng., vol. 60, no. 1, pp. 189–192, Jan. 2013.
[9] D. R. Zhang, C. J. Deepu, X. Y. Xu, and Y. Lian, “A wireless ECG plaster for real-time cardiac health monitoring in body sensor networks,” in Proc. IEEE Biomed. Circuits Syst. Conf., 2011, pp. 205–208.
[10] G. Nallathambi and J. Principe, “Integrate and fire pulse train automaton for QRS detection,” IEEE Trans. Biomed. Eng., vol. 61, no. 2, pp. 317– 326, Sep. 2013.
[11] E. Chua and W. Fang, “Mixed bio-signal lossless data compressor for portable brain-heart monitoring systems,” IEEE Trans. Consum. Electron., vol. 57, no. 1, pp. 267–273, Feb. 2011.
[12] A. Jas, J. Ghosh-Dastidar,M.-E. Ng, and N. a. A. Touba, “An efficient test vector compression scheme using selective Huffman coding,” IEEE Trans. Comput.-Aided Des. Integr. Circuits Syst., vol. 22, no. 6, pp. 797–806, Jun. 2003.
[13] G.S.Kumari, S.Kuswanth Kumar, J.Anusha and M.P.Rao , “Electrocardiographic Signal Analysis Using Wavelet Transforms,” International Conference on Electrical, Electronics, Signals, Communication and Optimization (EESCO) – 2015.
[14] Can Ye, Miguel Tavares Coimbra and B.V.K. Vijaya Kumar, “Arrhythmia Detection and Classification using Morphological and Dynamic
Features of ECG Signals,”32nd Annual International Conference of the IEEE EMBS Buenos Aires, Argentina, August 31 - September 4, 2010. [15] S. Rigler, W. Bishop, and A. Kennings, “FPGA-based lossless data compression using Huffman and LZ77 algorithms,” in Proc. Can. Conf.
Electron. Comput. Eng., 2007, pp. 1235–1238.
BIOGRAPHY
Nithin John is currently pursuing M.Tech in electronics with specialization in Signal Processing from College Of Engineering, Kallooppara (CUSAT University), Kerala, India. He received his B.Tech degree in Applied Electronics and Instrumentation from Saintgits College of Engineering, Kottayam (MG University), Kerala, India. His areas of interest are Biomedical Signal Processing, Digital Signal Processing, Digital Communication, Wavelet etc.
Sneha Rachel Philip is currently working as Assistant Professor in College Of Engineering,