International Journal of Research (IJR)
e-ISSN: 2348-6848, p- ISSN: 2348-795X Volume 2, Issue 06, June 2015Available at http://internationaljournalofresearch.org
Astronomically immense using data sets & Treasure Hunt on
Web-predicated Distributed computing
Ramesh Gorantla; Pantham S S Pranathi Devi & Harivenkatesh
B.Tech, Amrita school of engineering, Bangalore, Karnataka, India
[email protected]; [email protected]; [email protected]
Abstract
Analytics play a crucial role in the information age. The projected demand for highly valued analytical aptitude dictates that certain measures must be taken to meet the requisite. Albeit there are numerous sources to learn analytics, they do not provide immersive, hands on experience to work with astronomically immense data sets. Treasure Hunt is a product developed by Analyttica DataLabs Pvt Ltd., for learning analytics. It is a web-predicated Java application that is utilized to process data and derive information and in this process withal edify the utilizer the approach to analyze data.
Currently the platform runs on a single node fortifying only flat file as data with circumscribed visualizations. We are implementing distributed computing to fortify millions of users. We are integrating database connectivity to handle more sizably voluminous data sets. Once the required data is extracted, it can be visualized as any desired chart utilizing R graph so as to summarize and exhibit information in a manner that is facile to comprehend.
Keywords: Astronomically immense data sets; Treasure Hunt; Web-predicated; Distributed computing
Introduction
Treasure Hunt, a product that avails to train people in the field of analytics. Treasure Hunt is built on Java, but Java does not provide any API or package for analytics, hence integrating the application with analytics language such as R or SAS is very consequential part. R is a gratuitous software programming language and software environment for statistical computing and graphics. The R language is widely used among statisticians and data miners for developing statistical software and data analysis. The SAS language is a computer programming language utilized for statistical analyses, originated by a project at the North Carolina State University. It can read in data from mundane spreadsheets and databases and output the results of statistical analyses in tables, graphs, and as RTF, HTML, and PDF documents. The SAS language runs under compilers that can be utilized on Microsoft Windows, Linux, and sundry other UNIX and mainframe computers.SAS was integrated into the current application which was currently working with R.
If a utilizer needs to utilize the product, he/she has to register with a valid e-mail id. Registration module avails the application to keep track of who all utilize the application and if the credentials provided by them is valid. Registration additionally avails in keeping out bots and malware.
International Journal of Research (IJR)
e-ISSN: 2348-6848, p- ISSN: 2348-795X Volume 2, Issue 06, June 2015Available at http://internationaljournalofresearch.org
check the cognizance of the utilizer for that operation or check the subject cognizance of the utilizer, multiple cull questions will be exhibited. Endeavoring these questions are optional but if done so bonus points will be given, erroneous answers will have negative points.
As a data scientist, visualization is key in making felicitous interpretations, when the data set is profoundly and astronomically immense. To avail the utilizer understand the data set better an interactive chats are very paramount. R graph avails in achieving this, interacting R graph into the application proved to very valuable in enhancing the utilizer experience. Quality control and platform assessment is crucial for further development. The company should ken if the product is genuinely utilizable and if the customer has relished the product. Feedback of the application, feedback of individual challenge and error or bug reporting avails the company understand the product preponderant.
1.
Related Work
2.1 Existing System:
Analytics is at the heart of a multitude of financial enterprises such as banks, investment firms, indemnification companies, pension funds etc. The type of data that is handles by these institutions varies across organizations. The consequences of this is that analysts must be edified how to deal with company categorical data and more importantly what patterns and trends to look out for. A general course in analytics will typically not suffice, Training employees requires paramount duration and investment and as a result more minute firms shun away from this and outsource the whole process. Outsourcing however, has its drawbacks, the most sizably voluminous one being exposing the data. Cutting down on training cost without compromising on quality suggest a novel solution to this quandary.
2.2 Proposed System:
Minimizing cost on training, translates to reducing the number of human trainers and additionally minimizing the time spent on training and evaluation. The solution involves the utilization of an automated system that trains the learner by guiding him or her through the process of analyzing a sample data set utilized in the organization.
Treasure Hunt is a comprehensive platform for analytics training.
2.
Implementation
3.1 Database Connectivity:
One of the core functionality of Treasure Hunt is clients/users can upload their data and analyze it. Current platform fortifies upload of data from a flat file, but as in authentic time data is entirely stored in databases. It is a tedious process converting the entire data in database into flat file, it’s not efficient in terms of time and security. So to facilitate the accomodation of users/clients we have developed this module. Utilizing this module clients/users can upload their data directly from their database to our application.
2.1.1 Normal query
3.1.1.1 Add Datasource:
First the utilizer needs to enter his datasource by giving the credentials, credentials include hostname, port number, authenticate id, and password. Now utilizer can test the connectivity and preserve the credentials for future use, then the module checks for the connection establishment with the remote datasource, once the connection is established the credentials are stored in our local database.
3.1.1.2 View Datasource:
International Journal of Research (IJR)
e-ISSN: 2348-6848, p- ISSN: 2348-795X Volume 2, Issue 06, June 2015Available at http://internationaljournalofresearch.org
databases present in it. Utilizer can further view the contents of the database by clicking on it, the tables along with their columns will be exhibited in a tree structure in the UI.
3.1.1.3 View Credentials
Once the datasource is integrated the utilizer can view the credentials of the datasource by clicking on the info icon to the right of datasource designation. On click of this icon utilizer optically discerns the credentials of the culled datasource.
3.1.1.4 Execute Query
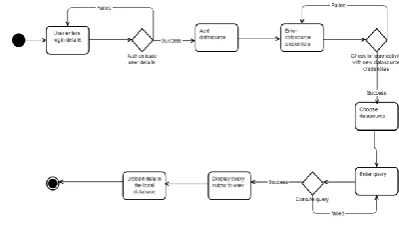
Fig (1) shows how users can execute query by culling the datasource and database from which they optate to query, they require to enter the query in the text box provided, and they can withal cull the tables/columns from the tree structure shown in the left plane. Once utilizer clicks on run the query the application validates the query by getting the credentials of the remote datasource from the local database. After validation the application execute the query as sends the result back to the UI.
3.1.1.5 View Results
After query gets executed users can view the records returned in a table format in the UI.
3.1.1.6 Download as CSV
Once results are displayed the user can download the entire content as a CSV (comma separated value) file.
3.1.1.7 Upload Content
If user wants to analyze the data generated he can upload the data, once data is uploaded its gets assigned to a project.
Fig (1): Flowchart for normal query execution
3.1.2 Parameterized Query
Parameterized query means users can pass the value to specified fields at run time i.e., while executing the query.
FORMAT:This is the format in which the user has to enter the query
SELECT * FROM TABLE WHERE COLUMN_NAME = $COLUMN_VALUE
DEFAULT $COLUMN_VALUE =
DEFAULT_VALUE
E.g.: select * from user_details where user_name = $user_id_value default $user_id_value = 9364
All the components are same as above mentioned for normal query except the execute query part.
3.1.3 Dynamic Dataset:
International Journal of Research (IJR)
e-ISSN: 2348-6848, p- ISSN: 2348-795X Volume 2, Issue 06, June 2015Available at http://internationaljournalofresearch.org
database, executes the query against the credentials and gets the result of that query and assigns it to a project.
3.2 Distributed r Execution
The R language is widely used among statisticians and data miners for developing statistical software
R and its libraries implement a wide variety of statistical and graphical techniques, including linear and nonlinear modeling, classical statistical tests, time-series analysis, relegation, clustering, and others. R is facilely extensible through functions and extensions, and the R community is noted for its active contributions in terms of packages. Many of R's standard functions are indited in R itself, which makes it facile for users to follow the algorithmic culls made
In R Programming Language X, Y, Z are macrocosmic notations which denotes
X<- input
Y<-options
Z<-Function(X, Y)
Java application prepares the information needed as an input by R.
R will execute the request and give the replication to the utilizer
Java application and R runs on same system .So the request and replication has one to one correspondence.
Multiple requests can’t be handled at the same time
Requests has to wait in a queue until the execution of the proceeding request is consummated.
If the requests are coming perpetually the load on the server increases
Fig(2): Parallel R System Architecture
Fig(2) shows the execution of requests by R in single machine. Currently it has one to one correspondence of requests and response.
3.2.1 Distributed r Systems:
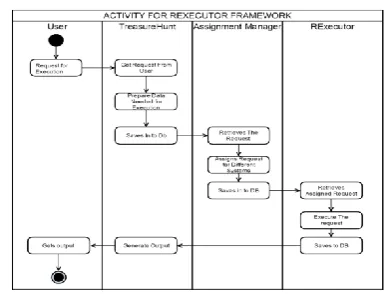
Fig(3): Activity diagram of distributed R systems
Fig (3) shows the execution of requests by R in distributed machines. Currently it has n to n correspondence of requests and response.
User Interface User Interface
International Journal of Research (IJR)
e-ISSN: 2348-6848, p- ISSN: 2348-795X Volume 2, Issue 06, June 2015Available at http://internationaljournalofresearch.org
3.
Experimental Results
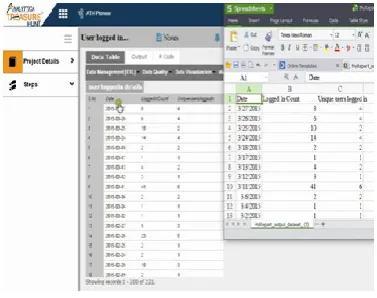
Fig 1: Dashboard page of the platform Page.
Fig 2: Project main page
Fig 3:Upload data page
Fig 4: Add datasource credentials page
Fig 5:Selecting a data source for query execution page
Fig 6: Assigning dataset to project page
Fig 7: Final data set assigned to a project and the downloaded csv file.
4.
Conclusion
International Journal of Research (IJR)
e-ISSN: 2348-6848, p- ISSN: 2348-795X Volume 2, Issue 06, June 2015Available at http://internationaljournalofresearch.org
consummate platform for analytics. This translates to incremented flexibility in culling the statistics package, support for inditing custom functions or macros to perform analysis.
Engendering challenges that do not have data available. SQL language capability to fetch data from the database which is required for the analysis. Incrementing level of gamification techniques for enhancing utilizer experience. Unstructured data analysis will withal be given more focus. The product is presently targeted towards businesses, however it may be expanded to suite a wider utilizer base.
5.
References
[1] Kohavi, Rothleder and Simoudis. "Emerging Trends in Business Analytics". Communications of the ACM 45 (8): 45–48, 2002.
[2] Gosling, James; Joy, Bill; Steele, Guy L., Jr.;Bracha, Gilad (2005).
The Java Language
Specification(3rded.).
Addison-Wesley
[3] www.tutorialspoint.com
[4] www.hibernate.org