Peaksover Threshold Analysis to Describe the
Rain Attenuation: a Based to Design Adaptive
Fade Mitigation Techniques
D. Villena-Rivera
1, A.D. Garcia-Garcia
2and F.J. Ortiz-Cerecedo
2PhD Student, Dept. of Mechatronics, Instituto Tecnologico y de Estudios Superiores de Monterrey, Mexico, Mexico1 Professor, Dept. of Mechatronics, Instituto Tecnologico y de Estudios Superiores de Monterrey, Mexico, Mexico 2
ABSTRACT: Satellite communication systems that work at frequency above 10 GHz can be severely affected by atmospheric phenomena being the most important the attenuation due to rain. In order to satisfy availability and quality of service specifications, fade mitigation techniques are designed and tested using experimental time series of rain attenuation. These time series are synthesized from the estimated attenuation of rain to be exceeded for some percentages of an average year. This paper presents a statistical model prediction based on peaks over threshold to describe the rain attenuation exceeded for 0.01% of an average year for broadcast satellite services at Ku band. Then, the predict attenuation is described by Pareto distribution and the time between fades by a nonhomogeneous Poisson process in monthly periods. This model is valid for elevation angles from 18º to 42º degrees and reflects the climate change over the years.
KEYWORDS: Rain Attenuation Exceeded, Peaks over Threshold, Pareto Distribution, Satellite Communication, Fade Mitigation Techniques, Statistical Prediction Model.
I.INTRODUCTION
Satellite communication may endure channel impairments originated in the ionosphere and the troposphere that cause variable duration fades. Ionospheric effects influence systems operating below 3 GHz while tropospheric effects affect systems operating above 3 GHz. The most important phenomenon that affect satellite communications in Ku band is the rain precipitation causing absorption and signal scattering that increase with the frequency [1].
Fade mitigation techniques (FMTs) are designed and tested using experimental time series of rain attenuation in order to satisfy availability and quality of service (QoS) specifications. These time series are synthesized form the long-term distribution of rain attenuation, for this reason, many prediction model of rain attenuation have been proposed in order to calculate the attenuation exceed for some percentage (%) of an average year (A%) as: ITU-R model [2] which is a
modification of the DAH model [3], XCELL [4], SAM [5], among others.
Rain precipitation causes attenuation events that vary randomly in time and intensity, forthis reason, prediction models are based on average attenuations at specific time periods. However,in order to guarantee availability and QoS specifications it is necessary to analyze the time periods when the atmospheric attenuations exceed the average of predictions. Peaks over threshold(POT) analysisallows to study the frequency and intensity of extreme events which cause service loss.
II
.
BACKGROUNDRain attenuation depends on the rain rate, elevation angle and frequency. The ITU-R recommendation [2] defines the predicted attenuation exceed for 0.01% of an average exceed as:
𝐴0.01 = 𝛾𝑅𝐿𝐸 (1)
where𝐿𝐸 is the effective path length. The specific attenuation 𝛾𝑅 is defined in [6] as 𝛾𝑅= 𝑘(𝑅0.01)𝛼 with rain rate 𝑅
absence of measured data, the ITU-R P.837 presents a map of rainfall [7], however, this map does not describe the extreme events of rain fall.
Peaks over threshold analysisallows to study theextreme events and is used in several fields as a tool of risk analysis [8].In satellite communication systems that are affected by atmospheric phenomena, the risks are connected to parameters such as availability and QoS. Then, this analysis can be used in order to design adaptive fade mitigation techniques. Many atmospheric phenomena have been modeled by POT analysis in order to estimate the climate change [9] and the intensity of precipitation events [10-13].
The peaks over threshold (POT) analysis involves: choosing some threshold level, collecting into a sample the extreme values which are above the threshold, and drawing conclusions based on the sample. Given a data set𝑥1, 𝑥2, … , 𝑥𝑛, the
excess𝑦𝑖over a threshold 𝑢are those 𝑥𝑖with 𝑥 > 𝑢. The values 𝑦𝑖− 𝑢are the excesses over 𝑢. Then, the probability
distribution of the excessover the threshold can be modeled by the generalized Pareto distribution. Excess are rare events that follow a Poisson law and can be described by a nonhomogeneous Poisson process [14].
III. RAIN ATTENUATION BASED ON PEAKS OVER THRESHOLD
In this paper we proposed a statistical model based on peaks over threshold to describe the rain attenuation exceeded for 0.01% of an average year for broadcast satellite communication at Ku band. This analysis is based on meteorological data from 120 automatic weather station located in Mexican territory, this stations provide information with 10 minute period of rain rate. Measurements were performed in a period of eleven years (January 2002 to December 2012) in order to analyze the rainy season in the link to the geostationary satellite Intelsat 9 (-58º latitude). This model is tested for elevation angles from 18º to 42º degrees.
The annual model is defined as:
𝐺𝑃𝐷𝑎𝑛𝑛𝑢𝑎𝑙 = 𝐴0.01; 𝜆 𝜏 , 𝛿 𝜏 , 𝜅 𝜏 (2)
wherethe generalized Pareto distribution (GPD) is composed for Pareto distributions that change its parameters in monthly periods 𝜏. The Pareto distribution is defined as:
𝑓 𝐴0.01; 𝜆, 𝛿, 𝜅 = 1
𝛿 1 + 𝜅(𝑥−𝜆)
𝛿 −1𝑘−1
(3)
where 𝜆, 𝛿 and 𝜅 are parameters of location, scale and shape respectively [14, 15].
Peaks over threshold represents a based to design adaptive mitigation techniques because it allows to analyze the signal behavior when this is affect for rain attenuation that are under or over the threshold 𝑢. Then, it is possible design an FMT in order to compensate the attenuation when the rain is under the threshold 𝑢; and another that compensates the attenuation when the rain is above the threshold.
IV.METHODOLOGY
Let 𝐴0.01 {𝑖}
be the attenuation exceed for 0.01% of an average year with a 10 minute period for the 𝑖th automatic weather station with 1 ≤ 𝑖 ≤ 120. These attenuations are calculated following the ITU-R P-618 [2] with the rain rate data collected for each automatic weather station.
In order to guarantee broadcast communication service in the Mexican territory, we must analyze the maximum attenuation that occurs in each 10 minute period. Then, the attenuation 𝐴0.01 is defined for a 10 minute period 𝑡 as:
𝐴0.01(𝑡) = 𝑚𝑎𝑥 𝐴0.01 {1}
(𝑡), 𝐴0.01 {2}
(𝑡), … , 𝐴0.01 𝑖
(𝑡), … , 𝐴0.01 {120 }
(𝑡) (4)
In order to select the optimum threshold, we follow a method based on mean residual life plot that was proposed by Coles [15]: Let 𝐴0.01 1 , 𝐴0.01 2 , … , 𝐴0.01(𝑛) a sequence of measurements and 𝐴0.01 1 , 𝐴0.01 2 , … , 𝐴0.01(𝑘) the
𝑃𝑙𝑜𝑡 𝑢, 1
𝑛𝑢 𝑥0.01 𝑖 − 𝑢 𝑛𝑢
𝑖=1 ∶ 𝑢 < 𝑥0.01 𝑚𝑎𝑥 (5)
where𝑛𝑢 is the number of observation that exceed the threshold 𝑢. The resulting plot allows to select an optimum
threshold which is a point where the plot is virtually linear. In order to design and adaptive FMT, the point to be selected will be the highest.
Finally, the probability density function of Pareto distribution is defined in equation (3) [14, 15]. And the annual model is described in the equation (2).
V. RESULTS AND DISCUSSION
Rainy season in Mexico covers from June to October [16], for this reason, POT analysis is applied only in these months for the eleven years of measurements. August 2012 is selected in order to detail step by step the peaks over threshold analysis. Fig. 1 shows the 120 automatic weather stations located in all Mexican territory.
Fig. 1: Automatic weather stations
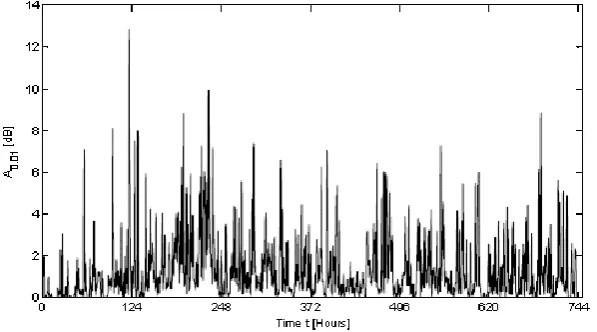
Using equations (1) and (4), we obtain the attenuation exceed for 0.01% of an average year with a 10 minute period. Fig. 2 shows 𝐴0.01(𝑡) for August 2012.
Fig. 2: Rain attenuation exceed for 0.01% of an average year (August 2012)
Fig. 3: Mean residual life plot (August 2012)
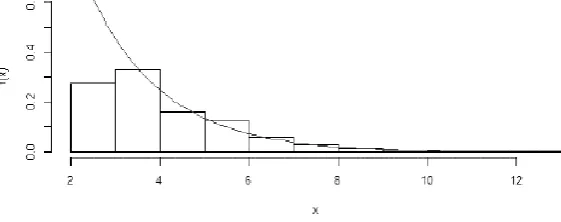
We select the maximum value for the threshold: 𝑢 = 3.5. Then, the Pareto probability density function for 𝐴0.01 is
shown in the fig.4 with the following parameters: 𝑢 = 3.5, 𝜆 = 0, 𝛿 = 1.81 and 𝐿𝑜𝑔 𝜅 = −13.06.
Fig. 4: Pareto probability density function (August 2012)
The complete analysis for the 2012 is shown in the table I. This table contains all parameters of Pareto distribution for the remaining months of the rainy season.
Table I: Pareto distribution for 2012 with 𝑢 = 3.5 and 𝜆 = 0
𝝉 Month 𝜹 𝑳𝒐𝒈 (𝜿) Time over threshold
1 June 1.9654 -1.8167 31.3 (h)
2 July 1.7976 -12.0709 39.2 (h)
3 August 1.8127 -13.0638 39.5 (h)
4 September 1.5996 -13.0987 23.2 (h)
5 October 1.5679 -14.1191 11.7 (h)
Then, the annual model for 2012 is defined using the equation (2) and the parameters of the table I.
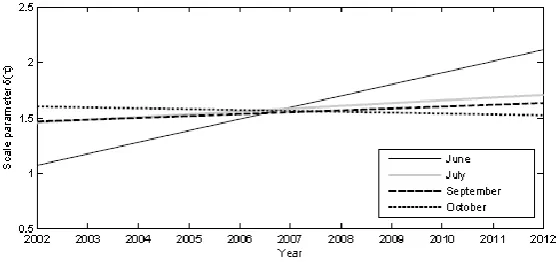
Fig. 5: Scale parameter of Pareto distribution for August (Eleven years analysis)
Linear fit for the scale parameter 𝛿presents a correlation coefficient of 0.77 and standard error of 0.19.August 2010 presents outlines for the scale parameter because it exceeds by 199% the average. For this reason, it is not considered in the linear fit analysis.
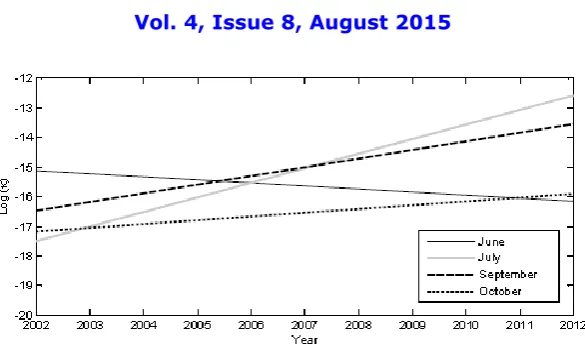
Fig. 6: Shape parameter of Pareto distribution for August (Eleven years analysis)
For the linear trend of the shape parameter 𝜅: the correlation coefficient is 0.51 and the standard error is 1.31.
Finally, the linear fit is applied in all months. Then, the rainy season in Mexico is described by Pareto distribution were their scale and shape parameters vary each year. This variations follow a linear trend. Fig.7 and 8 show the eleven years analysis of the rainy season.
Fig. 7: Scale parameter 𝛿 for rainy season (eleven years analysis)
Fig. 8: Shape parameter 𝐿𝑜𝑔(𝜅) for rainy season (eleven years analysis)
Fig. 8 shows the linear trend of the shape parameter. This statistical prediction model allow to calculate the parameters of Pareto distribution for future years, this predictions reflect the climate change, for this reason, this approximation is more accurate that the ITU-R recommendations.
As seen in table I:the service loos, without fade mitigation techniques that compensate the extreme rain events, is equal to 39.5 hours for August 2012. Then, it is necessary to design an FMT to compensate this extreme rain phenomena, but work all the time with a robust FMT is not efficient. For this reason, we propose the peaks over threshold analysis like a based to design adaptive fade mitigation techniques. Then, a robust FMT just will work in presence of extreme rain events.
VI.CONCLUSION
In broadcast satellite communication at Ku band for elevation angles form 18º to 42º, the rain attenuation exceeded for 0.01% of an average year can be described using peaks over threshold analysis. Then, the predict attenuation is described by Pareto distribution and the time between fades by a nonhomogeneous Poisson process in monthly periods.
The Pareto distribution parameters (scale and shape) vary over the years following a linear trend. Then, this statistical prediction model allows to calculate future Pareto distributions. These predictions reflect the climate change over the years, for this reason, POT analysis allows to synthesizer future rain events with more accurate than static models.
Defining a threshold allows to design an adaptive fade mitigation technique. For this reason, POT analysis is an attractive option to design: a robust FMT to compensate the attenuation when occurs extreme rain events and another less robust FMT that compensate the attenuation when the rain attenuation is under the threshold.
REFERENCES
[1] R. Crane, “Prediction of attenuation by rain,” Communications, IEEE Transactions on, vol. 28, no. 9, pp. 1717–1733, Sep 1980.
[2] ITU-R, “Propagation data and prediction methods required for the design of earth-space telecommunication systems,” Recommendation P.618-10, 2009.
[3] A. Dissanayake, J. Allnutt, and F. Haidara, “A prediction model that combines rain attenuation and other propagation impairments along earth-satellite paths,” Antennas and Propagation, IEEE Transactions on, vol. 45, no. 10, pp. 1546–1558, Oct 1997.
[4] C. Capsoni, F. Fedi, C. Magistroni, A. Paraboni, and A. Pawlina, “Data and theory for a new model of the horizontal structure of rain cells for propagation applications,” Radio Science, vol. 22, no. 3, pp. 395–404, 1987.
[5] W. L. Stutzman and K. M. Yon, “A simple rain attenuation model for earth-space radio links operating at 10?35ghz,” Radio Science, vol. 21, no. 1, pp. 65–72, 1986.
[6] ITU-R, “Specific attenuation model for rain for use in prediction methods,” Recommendation P.838-3, 2005. [7] ITU-R, “Characteristics of precipitation for propagation modelling,” Recommendation P.837-6, 2012.
[8] R. Reiss and M. Thomas, “Statistical Analysis of Extreme Values: with Applications to Insurance, Finance, Hydrology and Other Fields.” BirkhauserVerlag GmbH, 2007.
[9] J. Kysely, J. Picek, and R. Beranova, “Estimating extremes in climate change simulations using the peaks-over-threshold method with a non-stationary threshold,” Global and Planetary Change, vol. 72, pp. 55–68, 2010.
[10] S. Begueria and S. Vicente-Serrano, “Mapping the hazard of extremerainfall by peaks over threshold extreme value analysis and spatialregression techniques,” Journal of applied meteorology and climatology,vol. 45, no. 1, pp. 108–124, 2006.
[12] F. Acero, J. Garcia, and M. Gallego, “Peaks-over-threshold study oftrends in extreme rainfall over the iberian peninsula,” Journal of Climate,vol. 24, no. 4, pp. 1089–1105, 2011.
[13] D. Ceresetti, E. Ursu, J. Carreau, S. Anquetin, J. Creutin, L. Gardes, S. Girard, and G. Molini´e, “Evaluation of classical spatial-analysis schemes of extreme rainfall,” Natural Hazards and Earth System Science, vol. 12, no. 11, pp. 3229–3240, 2012.
[14] E. Castillo, A. S. Hadi, N. Balakrishnan, and J. M. Sarabia, “Extreme value and related models with applications in engineering and science.” Wiley-Interscience, 2005.
[15] S. Coles, “An introduction to statistical modeling of extreme values.” Springer-Verlag, 2001.