25 | P a g e
EXPERIMENTAL INVESTIGATION AND
OPTIMIZATION OF SPOT WELDING PROCESS
PARAMETERS FOR MAXIMUM TENSILE
STRENGTH
S.V.Fanse
1, D.D.Deshmukh
2, D.V.Niphade31,2
Department of Mechanical Engineering, MET’s, Nasik, India
3
Department of Mechanical Engineering, K.K.Wagh polytechnic, Nasik, India
ABSTRACT
This experimental study is based on an investigation of the effect and optimization of welding parameters on the
tensile shear strength in the Resistance Spot Welding (RSW) process. The experimental studies were conducted
under varying forces, currents, and times. The settings of welding parameters were determined by using the
Taguchi experimental design of L9 Orthogonal array method. The combination of the optimum welding
parameters have determined by using the analysis of Signal-to-Noise (S/N) ratio. The confirmation test
performed clearly shows that it is possible to increase the tensile shear strength of the joint by the combination
of the suitable welding parameters. Hence, the experimental results confirmed the validity of the used Taguchi
method for enhancing the welding performance and optimizing the welding parameters in resistance spot
welding operations.
Keywords: Resistance Spot Welding (RSW), Tensile strength, Taguchi method, S/N ratio,
Optimization.
I. INTRODUCTION
Resistance spot welding (RSW) is a process in which metal surfaces are joined in one or more spots by
resistance to the flow of electric current through work pieces that are held together under force by electrodes.
The process is used for joining cold rolled carbon sheet materials and uses shaped copper electrodes to apply
pressure and convey the electrical current through the work piece. Heat is developed mainly at the interface
between two cold rolled carbon sheets, eventually causing the two material being welded to melt, forming a
molten pool, the weld nugget. The resistance spot welding has the advantage which is great speed and suitable
for automation. Resistance spot welding is getting significant importance in car, bus and railway bodies etc. due
to automation and high speed process. The major factors controlling this process are current time, electrode
26 | P a g e
judged by nugget size and joint strength. This study presents a systematic approach to determine effect of
process parameters (electrode force, weld time and current) on tensile shear strength of resistance weld joint of
mild steel using Taguchi method. A general introduction for principle, working and parameters of spot welding
is given below. Resistance Spot Welding (RSW) is among the oldest of the electric welding method that used in
the industry and it is useful and accepted method in joining metal.
II.
LITERATURE REVIEW
Optimization for the austenitic stainless steel AISI 301L in RSW (Mr. Niranjan Kumar Singh , 2012) [1]. A
two-dimensional model is utilized to predict temperature and stress fields during and after resistance spot
welding process, Increase welding voltage leads to an increase in the weld nugget size. Welding time has the
same role, however, increasing the welding time causes to enhance heat transfer to the surroundings and
therefore less heat is consumed in the formation of weld nugget (I. RanjbarNodehetal, 2008) [2]. To study of
mechanical strength for three test geometry lap-shear, cross-tension and coach-peel, For lap shear strength, a
strong relationship with weld nugget diameter was observed; which discrete strength levels were found for
coach-peel test geometry. For cross tension strength there is a relationship with nugget dia. but the data are
sensitive to nugget periphery defects (L. Han M. Thornton, D. Boomer, M. Shergold, 2011) [3]. Tests of
thin-walled beams joined by spot welding ( Rusi´nski et al, 2004)
III. METHODOLOGY
Taguchi design methodology was Adopted. The experiments were conducted using L9 Orthogonal Array (OA)
with three parameters (electrode force, weld current, weld time) with three levels (level 1, level 2 and level
3).The process parameters, their symbols and their values at different levels are shown in the table 1
Optimization of process parameters is the very important in Taguchi method to achieving high quality without
increasing cost. This is because optimization of process parameters should improve quality and the optimal
resistance spot welding process parameters obtained from the Taguchi method are sensitive to the variation of
environmental conditions and other noise factors. An advantage of the Taguchi method is emphasizes a mean
performance value close to the target value rather than a value within certain specification thus improving the
product quality.
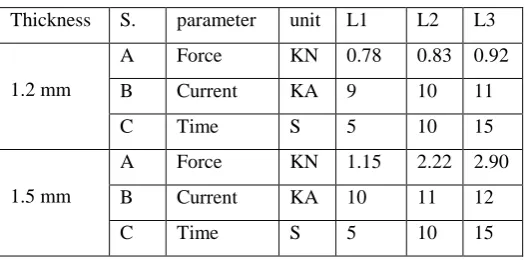
Table 1: Process Parameters and their Values
Thickness S. parameter unit L1 L2 L3
1.2 mm
A Force KN 0.78 0.83 0.92
B Current KA 9 10 11
C Time S 5 10 15
1.5 mm
A Force KN 1.15 2.22 2.90
B Current KA 10 11 12
C Time S 5 10 15
27 | P a g e
Additionally, Taguchi’s method for experimental design is straight and forward and easy to apply many
engineering situations, making it a powerful yet simple tool. The main disadvantage of the Taguchi method is
the results obtained are relative and do not exactly indicate which parameter has the highest effect on the
performance characteristic value. Also, since orthogonal array do not test all variable combination, this method
should not used with all relationships between all variables. A large number of experiments have to be carried
out when the process parameters increases. To solve this task Taguchi method uses a special design of
orthogonal arrays to study the entire process parameters space with only a small number of experiments. Using
an orthogonal array to design the experiment would help the designers to study the influence of multiple
controllable factors on the average of quality characteristics and the variations in a fast and economic way. all
the specimens are welded using the design of experiment shown in the Table 2
Table 2 : Experimental layout using L9 orthogonal array
Experiment Electrode
force (KN)
Welding current
(KA)
Welding Time
(cycle)
1 0.78 9 5
2 0.78 10 10
3 0.78 11 15
4 0.83 9 10
5 0.83 10 15
6 0.83 11 05
7 0.92 9 15
8 0.92 10 05
9 0.92 11 10
A. finding tensile shear strength
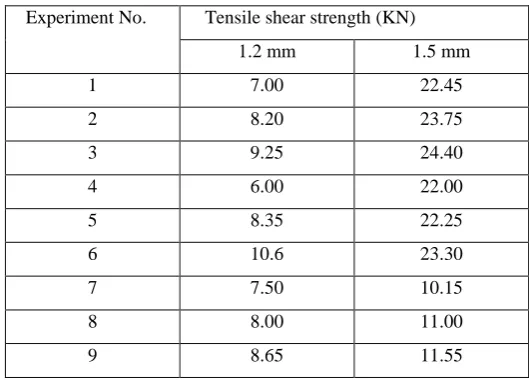
Tensile shear strength finding By using universal testing machine. The result are as follows.
Table 3: Experimental result for the tensile shear strength
Experiment No. Tensile shear strength (KN)
1.2 mm 1.5 mm
1 7.00 22.45
2 8.20 23.75
3 9.25 24.40
4 6.00 22.00
5 8.35 22.25
6 10.6 23.30
7 7.50 10.15
8 8.00 11.00
28 | P a g e
As we have seen before that all the specimens are welded using the taguchi method and now tensile shear testing
of all the specimens has performed using a Universal testing machine. The tensile shear results of all the
specimens are shown in the Table 3.A loss function is then defined to calculate the deviation between the
experimental value and the desired value. Taguchi recommends the use of the loss function to measure the
deviation of the quality characteristic from the desired value. The value of the overall loss function is further
transformed into a Signal to-Noise (S/N) ratio. Usually, there are three categories of the quality characteristic in
the analysis of the S/N ratio, i.e., the lower-the the better,
the larger-the-better, and the more nominal- the-better. The S/N ratio for each level of Process parameters is
computed based on the S/N analysis. Regardless of the category of the quality characteristic, a larger S/N ratio
corresponds to a better quality characteristic. Therefore, the optimal level of the process parameters is the level
with the highest S/N ratio. The loss function of the larger the better quality characteristics can be expressed as
ni i
y
n
N
S
2
1
log
10
where,
Lj = Overall loss function
n = Number of tests
yi = Experimental value of the ith quanlity characteristic
nj = S/N Ratio
By using the above equations
corresponding to overall loss function for each experiment was calculated and given in Table 4
B. S/n Ratio analysis
In order to quantify influence of each level of parameters, mean of S/N ratio for A were computed by averaging
S/N ratio for experiment Number 1, 2, 3 for level 1 and 4, 5, 6 for level 2 and 7, 8, 9, 16 for level 3. Mean of
S/N ratio for each level of other welding parameters were calculated in a similar way. Parameters with large
difference indicate high influence to weld ability as its level is changed. In this study, parameter B had largest
29 | P a g e
Table 4: overall loss function and its S/N ratio
Experiment No. S/N Ratio (db)
1.2 mm 1.5 mm
1 16.90 27.02
2 18.27 27.51
3 19.32 27.74
4 15.56 26.84
5 18.43 26.94
6 20.50 27.34
7 17.50 20.12
8 18.06 20.82
9 18.74 21.25
Based on S/N ratio, new operation parameters were obtained through maximum level of each parameter.
Then the prediction of S/N ratio and tensile shear strength is calculated by using the following relationship
Ƞ = ƞ
m+ ∑
ni-1(a-m)
Where,
Ƞ
= Predicted S/N ratioƞ
m = Total mean of S/N ratioa = Mean of S/N ratio at the optimal level
n = The number of main welding parameters,
That significantly affects the performance.
Table 5: S/N Responses for the Tensile Shear Strength
Thickness Symbol process
parameter
S/N Ratio (db)
Maximum-minimum
1.2 mm
Level 1 Level 2 Level 3
A Electrode force 18.17 18.17 18.10 0.07
B Welding current 16.66 18.26 19.52 2.87
C Time 18.49 17.53 18.42 0.96
1.5 mm
A Electrode force 23.53 22.52 10.90 12.63
B Welding current 18.20 19.00 19.75 1.55
30 | P a g e
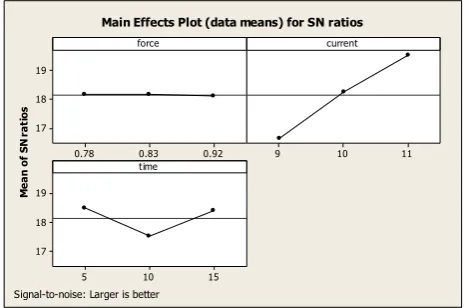
C. Variation in S/N Ratio with process parameterThe graph drawn below shows the variation in S/N ratio with the process parameters. The graph shows the
effect of the parameters.
M e a n o f S N r a ti o s 0.92 0.83 0.78 19 18 17 11 10 9 15 10 5 19 18 17 force current time
Main Effects Plot (data means) for SN ratios
Signal-to-noise: Larger is better
Graph 1: Force, Current, Time vs. S/N Ratio for 1.2 mm
Table 6: Result of the confirmation result
M e a n o f S N r a ti o s 2.90 2.22 1.15 28 26 24 22 20 12 11 10 15 10 5 28 26 24 22 20 FORCE CURRENT TIME
Main Effects Plot (data means) for SN ratios
Signal-to-noise: Larger is better
Graph 2: Force, Current, Time vs. S/N Ratio for 1.5 mm Thickness
Initial process
parameter
Optimal process parameter Improvement
in S/N Ratio
Prediction Experiment
1.2 mm
Level A1B1C3 A1B3C1 A1B3C1
1.83
Tensile strength 08.20 08.80 08.75
S/N (db) 18.27 19.85 20.10
1.5 mm
Level A1B1C1 A1B3C2 A1B3C2
1.71
Tensile strength 22.25 23.40 23.47
31 | P a g e
The results of experimental confirmation are shown in the Table 8. Using optimal welding parameters and
comparison of the predicted tensile shear strength with the actual tensile Shear strength using the optimal
welding parameters are shown in Table. The improvement in S/N ratio from the starting welding parameters to
the level of optimal welding parameters is 1.74 dB and 1.65 dB for 1.2 mm and 1.5 mm sheets respectively. The
tensile shear strength is increased by 0.60 and 1.15 times for 1.2 mm and 1.5 mm sheets Respectively.
Therefore, the tensile shear strength is greatly improved by using the Taguchi method.From the experiment it is
found that the parameters of the spot welding are very important factors for the tensile shear strength of the
welding joint. In this experiment it is found that the welding current is the main parameter, which may affect
more to the strength of a welding joint. The change in process parameters from the initial parameters results an
increase in the strength of the welding joint.
IV. Conclusions
This experiment was based on the optimization of spot welding process parameters to find out the maximum tensile
shear strength of the spot welded joint. The mild steel sheets of 1.2 mm and 1.5 mm of dimensions 28 mm × 250 mm
have used as the work piece. The Taguchi Method of L9 orthogonal array has used to perform the experiment. All the
specimens are spot welded using the taguchi design of experiment. Then the tensile shear strength of work pieces is
found out using a tensile testing machine. An optimum parameter combination for the maximum tensile strength was
obtained by using analysis of (S/N) ratio. The confirmation tests indicated that it is possible to increase tensile shear
strength by using the suitable parameters. The experimental results confirmed the validity of the used Taguchi method
is for enhancing the welding performance and optimizing the welding parameters in resistance spot welding
operations. The experimental results show that welding parameter are the important factors for the shear strength of
the welded joint. which may increase or decrease the strength of the welding joint so we can say that the combination
of the suitable parameters is necessary for the maximum strength of the spot welded joint.
REFERENCES
[1] Aravinthan Arumugam and Abdul Abaharuddin,”Effect of force control during spot welding on weld
properties” volume 4,(2014) ISSN 2250-3153
[2] Matsushita muneo “Development of next generation resistance spot welding technologies contributing to
auto body weight reduction”no,18 (2013)
[3] Ahmet H. Ertas, Fazıl O. Sonmez, “Design optimization of spot-welded plates for maximum fatigue life”,
Finite Elements in Analysis and Design, 47 (2011) 413–423.
[4] Q.I.Bhatti, M. Quisse, S. Cogan, “An adaptive optimization procedure for spot welded structure”
Computers and structure 89 (2011) 1697-1711
[5] Omar savas “effect of some welding parameters on nugget size and mechanical properties of automotive
sheet in electrical resistance spot welding (2013)
[6] Walther jenis “effect of welding nugget diameter on the tensile strength of the resistance spot welding joints of
same sheet metal” (2009)
[7] H.Oikawa,G.Murayama,T.Sakiyama,Y.Takahashi and T.Ishikawa: “Resistance spot weldability of high