1100 | P a g e
Identifying Dropout Factor Order
Using C5.0 Decision Tree
Anju Lata Gajpal
1, Umesh Kumar Pandey
21
Research Scholar,
2Research Supervisor,
MATS School of Information Technology, MATS University Raipur CG
ABSTRACT
Data mining is widely used for discovering new pattern hidden in dataset. Decision tree is one of the method to
find the hierarchical architecture which is easily understandable in the data mining methods. Number of
decision tree algorithms are available i.e. ID3 C4.5, C5.0, CART, CHID etc. Decision tree is applicable in
various areas i.e. marketing, surveillance, scientific discovery, fraud detection etc. In this paper the algorithm
C5.0 is used for making decision tree on dropout data so that factors responsible for dropout identified in
hierarchical architecture and find the dropout factor sequence hidden inside the data.
Keywords: Dropout Factor, C5.0, Decision tree application in EDM.
I.
INTRODUCTION
Data analysis in past few years got importance and everyone recognize its importance. Decision tree is one of
the analytical technique. Decision trees are easy to understand and helpful in decision making. Decision tree
partition data on homogeneous characteristic accepted as effective method for supervised learning. Supervise
learning is also known as classification. Meaning of classification in Oxford dictionary is “the process of
classifying something according to shared qualities or characteristic”. Classification and prediction are applied
on label data. These trees are used to identifies classes of human activities for decision making.
Educational institution and organizing administrators always try to increase the enrollment number of student.
Higher enrollment means higher collection of revenue. Student failure or dropout may cause reduction in
revenue collection. The effort made to increase enrollment do not reflect its purpose in subsequent level of
education.
Human development and progress of a nation is directly related with the education. That is why every nation
tries to establish good institution and resources for the citizens of the nations. But can you imagine school,
college and university without student. The answer is no. This shows the importance of student in institution.
Student are asset of a nation but what happen when student dropout from institution.
Educational data mining study student data to identify various problems related with educational process and
1101 | P a g e
factor responsible for dropout. So that new strategies can be implemented into educational institution to addressthe problem.
II.
LITERATURE REVIEW
Patil N et.al. [1] studied a comparative analysis between C4.5 and C5.0. they opined that on front of efficiency
and memory performance C5.0 is much better than C4.5. C5.0 splits sample data on the fields which has biggest
information gain.
Revathy R and Lawrance R [2] studied comparative analysis between C4.5 and C5.0. they opined that
experimental result illustrate proficiency of C5.0 is high and “confirmed that the most powerful method in
machine learning is C5.0.
Patel B R and Rana K K[3] prepared a study on four decision tree algorithms i.e. ID3, C4.5, C5.0 and CART. In
this research paper they presented application of decision tree in various areas and highlighted issues related
with decision tree i.e. fragmentation problem, replication problem, partitioning problem, repetition problem,
input range, overfitting etc. They opined that performance of algorithms are strongly depends on the entropy,
information gain and the features of the data sets.
Krishna Kumar S V and Kiruthika P [4] compared four decision tree algorithm ID3, C4.5, C5.0 and CART on
six factor i.e. type of data, speed, pruning, boosting, missing value and formula. They opined that C5.0
algorithm works with continuous, categorical, dates, time, timestamp type of data. It has highest speed among
the studied decision tree algorithm with pre-pruning, support boosting and can deal with missing values.
Sweeten G et.al. [5] opined in their study that “as time progress after dropout for school reasons among females,
delinquency declines.
Herzog S [6] opined that dropout risk is highest in the first year of education. In the study work it is also
mentioned that “the level of departure risk associated with a given factor varies between dropout and
transfer-out and is influenced also by simultaneous enrollment somewhere else”.
Basumatary R [7] opined in the study that “possible initiatives are required for mitigating, school dropout
problem. “Policy Options among others, include- elimination of poverty, improvement of school infrastructure,
increased number of trained teachers and adaption of the curriculum to the present needs and so on.
Satessh G M et.al. [8] studied data of student aged 6-16 years. They examined household and parental
characteristic caste, community etc. Multivariate analysis is used to study the data. They opined in this research
work is that “the household size, number of living children, and parental education were the most important
predictors of school dropouts in India”.
1102 | P a g e
C5.0 decision tree algorithm is developed to overcome the limitation of C4.5 and ID3. C5.0 works withmultivariate attribute and missing attribute also.C5.0 is based on entropy and information gain. This entropy and
information gain is used to build the tree.
The entropy is defined as
“Let S be a random variable with outcomes Si, i{1,2…..n} and probability mass function p. The quantity”[10]
“Entropy is used to measure the amount of uncertainty or surprise or randomness in a set of data”[11]
Information gain describe reduction of entropy when a data set split on an attribute into two subsets. Information
gain is calculated as
Where
Values(A)= Set of all possible values
Sv=Subset of S for which attribute A has Value
S=Set of all Values
Fig 1 shows C5.0 algorithm follows following input and method to produce decision tree
1103 | P a g e
IV.
RESEARCH METHODOLOGY
Various literature reviews accept that there is no single reason for the dropout of student. After going through
these research works and observations dropout factors are summarized under seven heads as shown in table. The
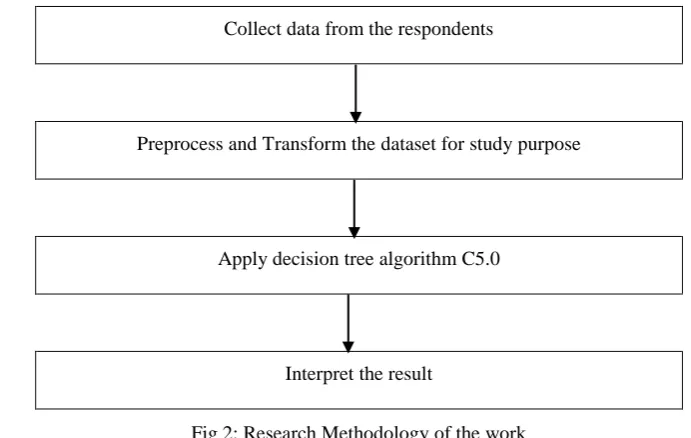
decision tree method is applied over this collected data set. The steps involved in following:
Collect data from the respondents
Preprocess and Transform the dataset for study purpose
Apply decision tree algorithm C5.0
Interpret the result
Fig 2: Research Methodology of the work
V.
DATA SET
Data belongs to student of Raipur area. Data collected from student by approaching directly using questionnaire
method. Table shows the attribute list and its description in which data is collected. The number of respondent
participated in this survey are 172. Table 1 shows all the attributes which are taken for dropout studied and type
of problem student mentioned for the dropout. Possible values for each factor is shown in table 2.
Table 1: Studied factors for dropout
Sr. No. Code Description
1 MS Marital Status
2 CSL Comfortable in stream language
3 FAR Family annual income fulfills fee requirement
4 FCE Father Completed education in which student study
5 MCE Mother completed education in which student study
6 LS Location of study
1104 | P a g e
8 X_1 Mentioned factor for dropout
In table 1 MS, CSL, FAR, FCE, MCE, LS and ESL are considered as cause for the dropout study. Family
problem, health problem, course problem, financial problem and institutional problem are the mentioned reason
for the dropout. Mentioned reason is represented in attribute X_1. MS, FCE, MCE and LS are considered as
family problem. Respondents do not mention any specific cause for health problem. ESL and CSL is mentioned
as the cause for course problem. Respondents do not mention any specific cause for institutional problem.
Values are collected from respondents in each attribute of table 1.
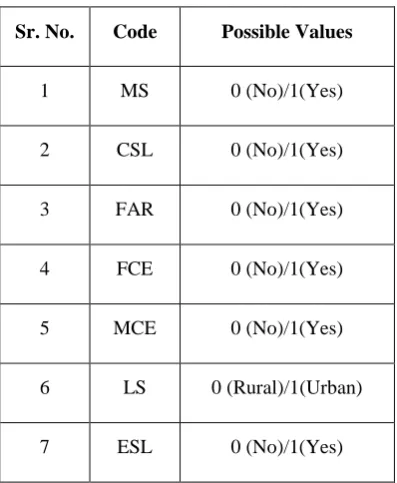
Table 2: Studied factors possible value
Sr. No. Code Possible Values
1 MS 0 (No)/1(Yes)
2 CSL 0 (No)/1(Yes)
3 FAR 0 (No)/1(Yes)
4 FCE 0 (No)/1(Yes)
5 MCE 0 (No)/1(Yes)
6 LS 0 (Rural)/1(Urban)
7 ESL 0 (No)/1(Yes)
Table 2 shows the possible value for each attribute mentioned in the table 1 All values are of Boolean nature
where 0 is for no and 1 is for yes. Except location of school (LS) rural and urban area.
VI.
DATA ANALYSIS TOOL
Data is studied in R programing language. For C5.0 algorithm R language provide the package “C50”. The
function name is “C5.0”. “readxl” package provide a function “read.excel” to fetch data store in the excel
worksheet. The data is stored with database name anjuc50. X_1 mention the set of reason (one or more than one
reason) for dropout mentioned by the respondents.
library(C50)
library(readxl)
anjuc50 <- read_excel("F:/anju/question.xlsx",
1105 | P a g e
+"numeric", "numeric", "numeric", "numeric","numeric", "numeric", "blank",+"blank", "blank", "blank", "blank", "text"))
set.seed(9850)
g<-runif(nrow(anjuc50))
anjuc50r<-anjuc50[order(g),]
anjuc50r$X__1<-as.factor(umeshc50r$X__1)
vars<-c("Gender","MS","CSL","FAR","FCE","MCE","LS","ESL","DLI")
m2<-C5.0(anjuc50r$X__1 ~ .,data = umeshc50r)
m2
summary(m2)
VII.
RESULT ANALYSIS
C5.0 algorithm in R language produces attribute usage, tree of rules pattern, error rate and confusion matrix of
classification. Table 3 shows the attribute usage in the decision tree. Table 3 indicates that FAR has highest
attribute usage whereas MCE has lowest attribute usage and out of 9 attributes 5 attributes has more than 50%
usage in the decision tree.
Table 3: Attribute usage in the algorithm
Attribute Usage Percentage
FAR 100.00%
ESL 94.77%
MS 73.84%
LS 63.95%
FCE 58.72%
Gender 41.86%
CSL 37.21%
1106 | P a g e
MCE 14.53%
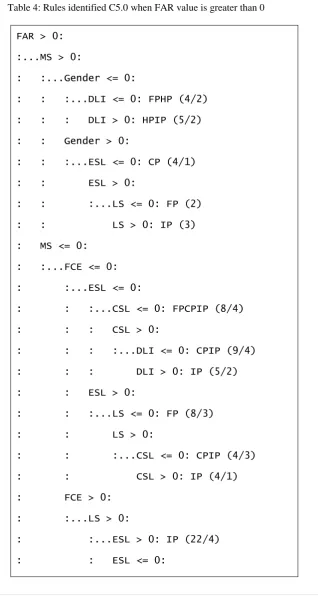
Table 4: Rules identified C5.0 when FAR value is greater than 0
FAR > 0:
:...MS > 0:
: :...Gender <= 0:
: : :...DLI <= 0: FPHP (4/2)
: : : DLI > 0: HPIP (5/2)
: : Gender > 0:
: : :...ESL <= 0: CP (4/1)
: : ESL > 0:
: : :...LS <= 0: FP (2)
: : LS > 0: IP (3)
: MS <= 0:
: :...FCE <= 0:
: :...ESL <= 0:
: : :...CSL <= 0: FPCPIP (8/4)
: : : CSL > 0:
: : : :...DLI <= 0: CPIP (9/4)
: : : DLI > 0: IP (5/2)
: : ESL > 0:
: : :...LS <= 0: FP (8/3)
: : LS > 0:
: : :...CSL <= 0: CPIP (4/3)
: : CSL > 0: IP (4/1)
: FCE > 0:
: :...LS > 0:
: :...ESL > 0: IP (22/4)
1107 | P a g e
: : :...CSL <= 0: CPIP (5)
: : CSL > 0: IP (11/5)
: LS <= 0:
: :...ESL <= 0: CPIP (4)
: ESL > 0:
: :...Gender <= 0:
: :...MCE <= 0: FP (3)
: : MCE > 0: CP (2/1)
: Gender > 0:
: :...DLI <= 0: IP (4)
: DLI > 0: CP (2/1)
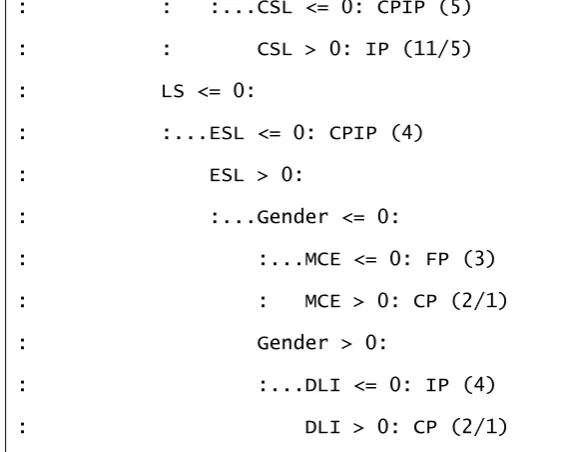
Table 4 shows the rule set pattern identified by the c5.0 algorithm when the value of FAR is greater than 0.
Table 5 shows the rule set pattern identified by the C5.0 algorithm when the value of FAR is less than or equal
to 0. C5.0 algorithm uses entropy and information gain for splitting the tree and choose best attribute. When
FAR value is greater than 0 then next attribute which has highest gain is MS and similarly identify next attribute
whereas when FAR is less than or equal to 0 then ESL is chosen as splitting attribute and other attributes are
selected which has next highest gain.
Table 5: rules identified by C5.0 when FAR is less than or equal to zero
FAR <= 0:
:...ESL > 0:
:...LS > 0: Fip (20/9)
: LS <= 0:
: :...Gender > 0: Fip (5/1)
: Gender <= 0:
: :...DLI <= 0: FP (2/1)
: DLI > 0: FPHPFiP (4/2)
ESL <= 0:
:...Gender <= 0:
:...CSL > 0: FPFiP (6/4)
: CSL <= 0:
1108 | P a g e
: DLI > 0: CPIPFiP (3/1)
Gender > 0:
:...MCE > 0: CPFiP (2/1)
MCE <= 0:
:...MS > 0: CPIP (3/1)
MS <= 0:
:...DLI > 0:
:...LS <= 0: CP (2/1)
: LS > 0: CPIPFiP (3/1)
DLI <= 0:
:...FCE <= 0: CPIPFiP (4/2)
FCE > 0:
:...CSL <= 0: CPIP (3/1)
CSL > 0: Fip (3/1)
Table 6: Confusion matrix of classification
Class Cases False Pos False Neg
CP 11 4 5
CPFiP 6 1 5
CPIP 31 9 12
CPIPFiP 8 4 2
Fip 17 11 0
FP 14 4 3
FPCP 5 0 5
FPCPIP 10 4 6
FPCPIPFiP 2 0 2
1109 | P a g e
FPHP 4 2 2
FPHPCP 2 1 0
FPHPCPIPFiP 1 0 1
FPHPFiP 2 2 0
FPHPIP 1 0 1
FPIP 3 0 3
HPCP 1 0 1
HPCPFiPIP 2 0 2
HPCPIP 1 0 1
HPFiP 2 0 2
HPIP 3 2 0
IP 39 12 2
Evaluation of training data of 172 cases size of the decision tree is 33 with an error rate of 34.9 %. Table 6 is
confusion matrix of class allocation of specific class. Each class shows the number of cases false positives
and false negatives. A false positive for a particular class is a case of another class that is classified as that class,
while a false negative for a particular class is a case of that particular that is classified as some other class.
VIII.
CONCLUSION
Decision tree is a tool for making decision. Decision tree algorithms build a tree like graph or model using
conditional control system. Decision tree algorithm help in identifying a particular class when multiple variables
are responsible for any class. In this paper C5.0 algorithm is used for analyzing the dataset. FAR is most
important factor which can be used to decide that the student will dropout from the college education. Table no.
4 and 5 indicates the rule and order of the factor which causes the dropout from education system identified
from the data studied. Findings of this research paper will be used by decision maker to take necessary step for
1110 | P a g e
REFERENCES
[1.] Patil, N., Lathi, R.,Chitre, V., “Comparison of C5.0 & CART Classification algorithms using pruning Technique”, International Journal of Engineering Research & Technology (IJERT), Volume.1, Issue.4,
June 2012, pp: 1-5.
[2.] Revathy R, Lawrance R, “Comparative analysis of C4.5 and C5.0 Algorithms on Crop Pest Data”,
International Journal of Innovative Research in Computer and Communication Engineering, Vol 5 Special
Issue 1 march 2017, ISSN- 2320-9801-page no. 50-58
[3.] Patel B R & Rana K K, “A Survey on Decision Tree Algorithm For Classification”, IJEDR, Vol 2 Issue
1ISSN 2321-9939 Page No. 1-5
[4.] Krishna Kumar SV and Kiruthika P, “ An Overview of Classification Algorithm in Data Mining”,
International Journal of Advance Research in Computer and Communication Engineering, Vol 4 Issue 12
December 2015, ISSN 2278-1021. Page 255-257.
[5.] Sweeten G, Bushway S D and Paternoster R, “Does Dropping Out of School Mean Dropping
IntoDelinque Number ncy”, Criminology Vol. 2009 Page 47-91
[6.] Herzog S, “Measuring Determinants of student Return Vs Dropout/Stopout Vs Transfer: A
First-to-Second Year Analysis of New Greshmen”, Research in Higher Education, Vol. 46, No. 8 December DOI:
10.1007/s11162-005-6933-7 Page 883-928
[7.] Basumatary R, “School Dropout across Indian States and UTs: An Econometric Study”, International
research Journal of Social Science, Vol.1(4), 28-35, December (2012) ISSN 2319-3565
[8.] Sateesh Gouda M, Sekher T V, “Factors Leading to School Dropouts in India: An analysis of National
family health Survey-3 Data”, IOSR Journal of Reseacrh& Method in Education (IOSR-JRME) Vol. 4
Issue 6 Ver. III (Nov -Dec 2014) PP 75-83 ISSN 2321-737X
[9.] Revathy R and Lawrance R, “Comparative analysis of C4.5 and C5.0 Algorithms on Crop Pest Data”,
International Journal of Innovative Research in Computer and Communication Engineering, Vol. 5
Special Issue 1, March 2017 ISSN 2320-9801 Pg No. 50-58.
[10.] Jansson J, “Decision Tree Classification of Products Using C5.0 and Prediction of workload Using Time
Series Analysis”, ExamensarbeteInomElektroteknik, AvanceradNiva, 30 HP Stoclholm, Sverige 2016
[11.] Dunham M H, “Data Mining Introductory and Advance Topics”, ISBN: 978-81-7758-2 Page 93