7-4-2014 12:00 AM
Revisiting working memory: Are domain, process and global
Revisiting working memory: Are domain, process and global
models mutually exclusive, nested or orthogonal?
models mutually exclusive, nested or orthogonal?
Jeffrey P. Wong
The University of Western Ontario Supervisor
Dr. Adrian Owen
The University of Western Ontario Graduate Program in Neuroscience
A thesis submitted in partial fulfillment of the requirements for the degree in Master of Science © Jeffrey P. Wong 2014
Follow this and additional works at: https://ir.lib.uwo.ca/etd
Part of the Cognitive Neuroscience Commons, and the Systems Neuroscience Commons
Recommended Citation Recommended Citation
Wong, Jeffrey P., "Revisiting working memory: Are domain, process and global models mutually exclusive, nested or orthogonal?" (2014). Electronic Thesis and Dissertation Repository. 2181.
https://ir.lib.uwo.ca/etd/2181
This Dissertation/Thesis is brought to you for free and open access by Scholarship@Western. It has been accepted for inclusion in Electronic Thesis and Dissertation Repository by an authorized administrator of
A revised model of neural mechanisms underlying working memory
(Thesis format: Monograph)
by
Jeffrey Wong
Graduate Program in Neuroscience
A thesis submitted in partial fulfillment of the requirements for the degree of
Master of Science
The School of Graduate and Postdoctoral Studies The University of Western Ontario
London, Ontario, Canada
ii
Master of Science
Department of Neuroscience
Western University Canada
2014
Working memory (WM) is a cognitive function whereby task-relevant information is
actively maintained and manipulated in mind for goal-directed behaviour. Three competing
models, here dubbed the global, domain and process models, have attempted to explain its
neural underpinnings. Despite extensive research however, no consensus has been reached.
Here, we use two new WM paradigms to demonstrate that all three models are partially
correct. In the first experiment, our results show that selected frontoparietal regions (MD),
from the global model, are largely stimulus-independent. However, more posterior and
caudal frontoparietal regions show stimulus-dependent activations as described by the
domain model. In the second experiment, our results reveal that a dorsal MD sub-network is
more active when information is manipulated, as described by the process model. Thus, WM
is best represented by all three models, with the process model nested within the global, and
the domain model partially independent from the others.
Keywords
Key Words: Working Memory, Frontoparietal Cortex, Cognitive functions, Domain model, Process model, Adaptive coding, Multiple Demand, fMRI, Independent Components
iii
Acknowledgments
Many people have defined my graduate experience and without their support, this
achievement would not have been possible. I would like to show my appreciation to Dr.
Adrian Owen for directing me throughout the entire process of my degree giving critical
feedback about my thesis and life decisions. Likewise, I would like to take the time to
express my utmost gratitude to Dr. Adam Hampshire for his invaluable guidance and
intellectual proficiency. I also offer my appreciation to Mr. Adam McLean for patiently
helping me scan participants in the MRI late at night. Lastly, I would like to thank all
members of the Neuroscience graduate programme and Brain and Mind institute for giving
iv
Acknowledgments ... iii
Table of Contents ... iv
List of Tables ... vi
List of Figures ... vii
List of Abbreviations ... viii 1.1 Introduction to Working Memory ... 1
1.2 Experiment 1 - Task design ... 5
1.3 Experiment 2 - Task design ... 7
1.4 Participants ... 9
1.5 Data acquisition ... 10
1.6 Independent Components Analysis ... 11
1.7 Fixed and Random Effects Analyses ... 12
1.8 Experiment 1: Behavioural Results ... 13
1.9 Experiment 1: Neuroimaging Results ... 15
1.10 Experiment 1: ROI results ... 16
1.11 Experiment 1: Whole brain analyses ... 21
1.12 Experiment 2: Behavioural Results ... 26
1.13 Experiment 2: Neuroimaging Results ... 28
1.14 Experiment 2: ROI results ... 30
1.15 Experiment 2: Whole brain analyses ... 34
1.16 Discussion ... 37
1.17 Independent buffers outside of MD ... 38
1.18 Adaptive coding and specialisation ... 40
v
vi
Table 2: Peak activation coordinates from whole brain analysis of experiment 1. ... 24
vii
List of Figures
Figure 1: Extracted networks from MD ... 3
Figure 2: Task design of experiment 1. ... 6
Figure 3: Task design of experiment 2. ... 8
Figure 4: Behavioural results from experiment 1 ... 14
Figure 5: Extracted ICA components from experiment 1 ... 15
Figure 6: ROI analyses during encoding period of experiment 1 ... 17
Figure 7: ROI analyses during the delay period of experiment 1 ... 18
Figure 8: Accuracy-matched contrasts within the ventral network ... 20
Figure 9: Whole-brain analyses of stimulus-specific activations. ... 22
Figure 10: Baseline activation during the encoding period of trials separated by domain ... 23
Figure 11: Baseline activation during the delay period of trials separated by domain ... 23
Figure 12: Whole-brain analysis of load-specific activations during encoding. ... 25
Figure 13: Behavioural results from experiment 2 ... 27
Figure 14: Extracted ICA components from experiment 2 ... 28
Figure 15: Overlapped components from both experiments ... 29
Figure 16: ROI analyses during the encoding period of experiment 2 ... 31
Figure 17: Significant interacting effects during the delay period of experiment 2 ... 33
Figure 18: Whole-brain analyses from experiment 2. ... 35
viii
WM Working Memory
MD Multiple Demand
fMRI Functional Magnetic Resonance Imaging
BOLD Blood-Oxygen-Level-Dependent
IFS Inferior Frontal Sulcus
AI/FO Anterior Insula / Frontal Operculum
IPS Intraparietal Sulcus
SMA/ACC pre-Supplementary Motor Area / Anterior Cingulate Cortex
LPFC Lateral Prefrontal Cortex
DLPFC Dorsolateral Prefrontal Cortex
VLPFC Ventrolateral Prefrontal Cortex
ICA Independent Components Analysis
ROI Region of Interest
FDR False Discovery Rate
1.1 Introduction to Working Memory
Working memory (WM) refers to the set of cognitive control functions that allow
task-relevant information to be temporarily maintained and processed in the brain during
goal-directed behaviour (Baddeley & Hitch, 1974). Intact WM is a prerequisite for
reasoning, comprehension, planning and fluid intelligence. Many psychiatric and
neurological disorders including schizophrenia, attention deficit/hyperactivity disorder
and Alzheimer’s have been associated with impairments in WM (Baddeley, 1986;
Jonides, 1995). Thus, studying the neural correlates of WM can help us better understand
cognitive dysfunction in clinical populations. Three models, here dubbed the global
(Duncan, 2001), domain (Levy & Goldman-Rakic, 2000) and process (Petrides, 1994)
models, have attempted to explain the neural underpinnings of WM. However, despite
decades of research, no consensus regarding the functional brain organisation of WM has
ever been reached. In part, this is due to poorly controlled visual display and motor
response confounds. Furthermore, although there is substantial evidence promoting each
perspective, all three models are generally treated as mutually exclusive to one another. In
this study, we propose that all three models are partially correct as they either describe the
neural-anatomical correlates of WM at different levels of detail or assign particular
components of WM to different brain regions.
The global model proposes that selected frontoparietal brain regions with adaptive
coding properties are recruited during a broad range of cognitive functions including
WM. These brain regions include the inferior frontal sulcus (IFS), anterior insula/frontal
operculum (AI/FO), bilateral intraparietal sulcus (IPS) and pre-supplementary motor
area/anterior cingulate cortex (SMA/ACC) (Duncan, 2006). Neuronal populations within
these regions rapidly adapt to code for task-relevant information including target stimuli,
responses and rules (Duncan, 2001; Miller & Cohen, 2001). In fact, the same brain areas
have been activated by many other psychological tasks including perceptual and target
interference tasks (Duncan, 2006; Duncan & Owen, 2000). As such, it has been dubbed
the Multiple Demand (MD) cortex for its contributions to multiple cognitive processes.
Activations within these areas have also been demonstrated to correlate with individual
that WM, attention and cognitive control are facets of the same general neural system
(Duncan, 2006). Unlike the domain and process models, the global model describes a
system that is not specialised for any particular stimulus domain or cognitive process but
instead, rapidly adapts to code for whatever task is currently at hand.
In sharp contrast, the domain model proposes that the lateral prefrontal cortex
(LPFC) sub-regions process specific categories of information. More specifically, this
stimulus-dependent model argues that the ventrolateral prefrontal cortex (VLPFC)
processes non-spatial information whereas the dorsolateral prefrontal cortex (DLPFC)
processes spatial information (Levy & Goldman-Rakic., 2000). In line with this view, it
has been reported that the VLPFC is active when objects are being maintained in WM
(Courtney et al., 1997), whilst the caudal superior frontal gyrus is active when spatial
information is maintained (Courtney et al., 1998). Furthermore, a number of studies have
demonstrated that Broca’s area (left BA 44/45) is crucial for sub-vocal rehearsal and
verbal WM (Cohen et al., 1997; Awh et al., 1996). Thus the domain model postulates
that the LPFC sub-regions process specific stimulus domains in an extension of the
ventral-dorsal subdivision of the primary visual cortex (Ungerleider & Haxby, 1994).
The process model proposes that the VLPFC and DLPFC functionally dissociate
based on the type of cognitive processes that they support as opposed to the specific
stimulus domain that they manage. More specifically, this stimulus-independent model
argues that the VLPFC supports simple processes including active maintenance and
selective attention, whereas the DLPFC supports higher order processes including the
monitoring and manipulation of maintained information (Petrides, 1994; Owen et al.,
1998). In support of this view, primates with mid-DLPFC lesions were reported to
perform normally on recognition-based memory tasks (Petrides, 1991) but were impaired
on self-ordered search tasks (Petrides, 1995). Furthermore, human neuroimaging evidence
has demonstrated that spatial tasks with simple maintenance requirements recruit the
VLPFC whereas the reorganisation of verbal information recruits the DLPFC (Owen et
stimulus domains, the same brain regions are recruited (Owen et al., 1998). Therefore, the
process model postulates that the LPFC functionally dissociates based on the type of
cognitive process that is applied as opposed to the domain of information that is being
processed.
There is substantial evidence for all three perspectives of the functional
organisation of WM but no consensus has been reached as the models are usually viewed
as mutually exclusive. However, a recent study demonstrated that a ventral-dorsal
functional axis similar to the process model can be found within the MD regions of the
global model (Hampshire et al., 2012). Specifically, the authors used factor analyses on
neuroimaging data from twelve different cognitive tasks. The results revealed that whilst
all MD regions were recruited by all tasks, there were two functionally dissociable and
spatially distinct MD sub-networks (Figure 1). Tasks that required short-term memory
maintenance most strongly activated the ventral network whilst tasks that required
reasoning or planning processes most strongly activated the dorsal network. Thus, the
process model may in fact be nested within the anatomical regions posited by the global
model. Interestingly, a third network was also identified that was most strongly activated
to tasks with verbal stimuli. The authors proposed that a spatial equivalent of the new
component could also exist within the frontal lobes but in regions outside of MD areas.
For all of these reasons, the domain, process and global models may not be mutually
exclusive.
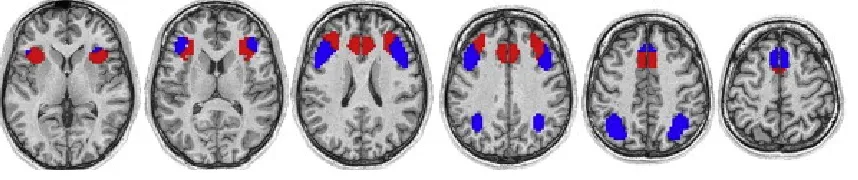
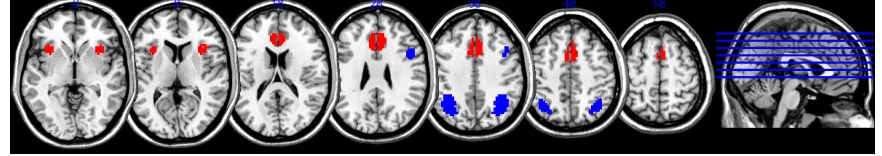
Figure 1: Extracted networks from MD (Hampshire et al., 2012). The ventral network (red) recruited the AI/FO, superior frontal sulcus and ventral portion of the SMA/ACC
whilst the dorsal network (blue) recruited the IFS, IPS and dorsal portion of the
same task context. Firstly, we applied an independent component analysis (ICA) to the
neuroimaging data of both WM tasks in order to replicate the previous findings of the
ventral and dorsal MD sub-networks. Then we determined whether MD functional
networks or regions outside of MD cortex responded specifically to different stimulus
domains. Finally, we examined whether the MD functional networks were sensitive to the
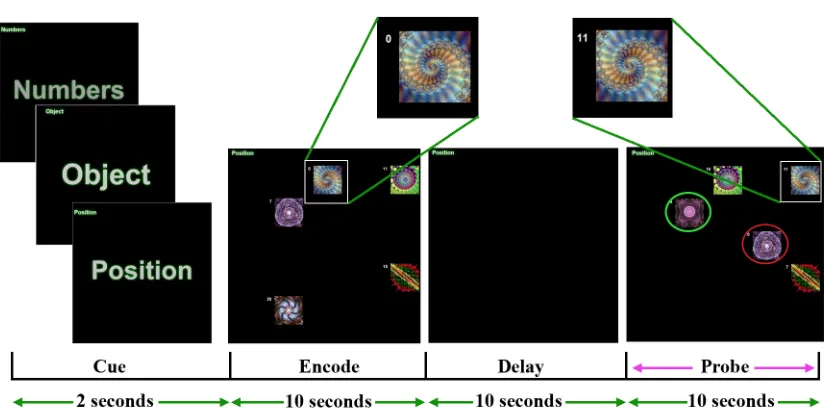
1.2 Experiment 1 - Task design
In the first experiment (Figure 2), participants were required to encode and
maintain a set of features from an array of compound stimuli. Each compound stimulus
was composed of a pseudo-randomly assigned Arabic digit, spatial position and abstract
fractal. Each trial began with a pre-encoding cue directing participants to focus the
features from one of the three stimulus domains (Numbers, Position or Object). Then,
three, five or seven compound stimuli were presented within a 5-by-5 grid. After 10
seconds of encoding, all compound stimuli were removed and the participants were
required to maintain the cued domain features (e.g. number, positions or objects).
Following the delay, the previous compound stimuli were presented again with one
replaced digit, spatial position and fractal. Only a single domain feature was replaced in
any one of the compound stimuli. Participants were then required to select the compound
stimulus that contained the new feature from the cued domain. The trial terminated earlier
if the participants responded within the allotted 10-seconds. Another trial began after an
Figure 2: Task design of experiment 1. In this example, participants were required to remember the spatial position of the compound stimuli. As such, when presented with the
probe array after the delay period, they were required to select the stimulus that was in a
different position compared to the encoded array. Here the correct answer was the object
circled in red. However, if participants were required to remember the fractal features of
the compound stimuli, they would select the green circled object because it was not
present in the encoding array. Similarly, if participants were required to remember the
number features, they would choose a different compound stimulus with a new number
that was not present in encoding array. On each trial, one Arabic number, spatial position,
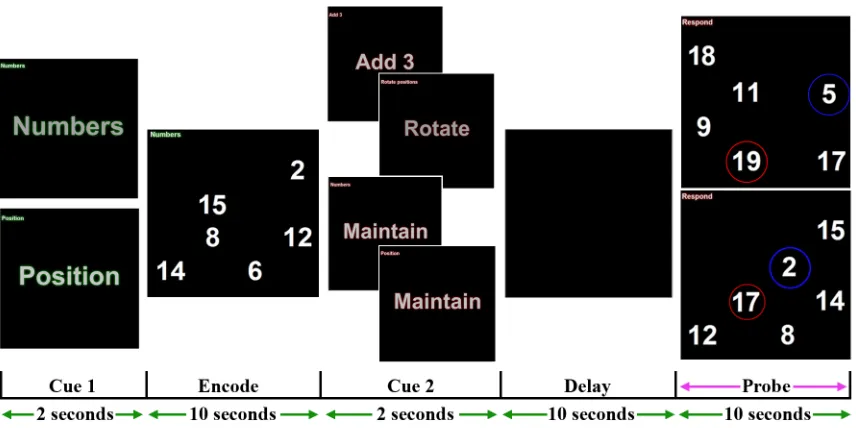
1.3 Experiment 2 - Task design
The second experiment (Figure 3) was similar to the first in design; however,
participants were required on some trials to manipulate information in mind as opposed to
simply maintain. Each trial began with a pre-encoding cue directing participants to focus
on a specific stimulus feature (Numbers or Position; N.B. – Fractal shapes were not used
in this task). Subsequently, either three or six Arabic digits were pseudo-randomly
presented on a 5-by-5 spatial grid. A second post-encoding cue was then presented to
inform participants to either maintain or manipulate the encoded information. If the
maintain cue was presented, participants simply needed to remember the Arabic digits or
spatial positions in order to find the new cued stimulus feature during their respective
trials. In contrast to the previous experiment, if the manipulate cue was presented,
participants needed to add three to every encoded digit during number trials or rotate the
entire spatial grid by 90-degree clockwise during position trials. The transformed stimulus
set was then presented after a delay with an altered Arabic digit and spatial position.
Participants were required to select the non-matching feature based on the stimulus
domain and manipulation that was cued throughout the trial. The trial terminated earlier if
the participants responded within the allotted 10-seconds. Another trial began after an
Figure 3: Task design of experiment 2. In this example, participants were cued to focus on the identity of the Arabic numbers whilst ignoring spatial positions. After
encoding, participants were required to maintain (lower images) or manipulate (upper
images) information. If required to maintain, they had to remember the numbers or spatial
positions during their respective trials and then select the new digit (red) or position
(blue) after the delay. In contrast, if participants had to manipulate, they were then
required to add three to every encoded digit during number trials or rotate the entire
spatial grid by 90-degrees clockwise during position trials. After the delay, the
transformed stimulus set was presented again with an altered digit (blue) and position
(red). Participants were allocated 10 seconds to select the non-matching feature based on
1.4
Participants
In the first experiment, nineteen right-handed volunteers between the ages of 20 to
40 with corrected to normal vision and no history of neurological or psychiatric illnesses
participated in the fMRI study. All participants consented to experimental procedures and
underwent a short training session to ensure that they understood and were capable of
performing the task. The training session consisted of one block of the task
(approximately 15-20 minutes) undertaken on a laptop outside of the MRI scanner. In the
second experiment, sixteen right-handed participants were recruited and trained using the
In the first experiment, each block contained 18 trials, two each from nine possible
combinations of stimulus domains (Number, Position and Shape) and WM loads (3, 5 and
7). In the second experiment, each block contained 16 trials, two each from eight possible
combinations of cognitive processes (Maintenance and Manipulation), stimulus domains
(Number and Position) and WM load (3 and 6).
MRI scanning was conducted at the Robarts Research Institute at Western
University in Canada using a 3-Tesla Siemens Trim Trio scanner. Thirty-two 3-mm slices
(0.75 mm inter-slice gap and interleaved slice order) were acquired using a repetition time
(TR) of 2 seconds and in-plane resolution of 3×3 mm. Approximately 300-400 ܶଶכ -weighted echo-planar images depicting blood oxygen level–dependent (BOLD) contrasts
were acquired from each participant depending on their reaction times. The first ten
images were discarded to avoidT1equilibrium effects. Using a mirror mounted to the head-coil, stimuli presented on a back-projection screen were visible from the bore of the
MRI scanner. Responses were taken with a custom MRI-compatible trackball mouse.
Both WM paradigms were programmed using Adobe Flash Builder 4.5 and embedded in
a scanner interface programmed in Visual Basic 6.
Brain images were pre-processed and analysed using the Statistical Parametric
Mapping 5 software package (SPM5, Wellcome Department of Cognitive Neurology).
The images were reoriented to correct for participant motion, spatially normalised to the
standard Montreal Neurological Institute template, smoothed with an 8-mm full-width at
1.6
Independent Components Analysis
A spatial group ICA was conducted on the pre-processed functional data from all
participants using the Group ICA of fMRI toolbox for MATLAB (GIFT – MIND
Research Network, Albuquerque, United States). Prior to the use of ICA, data were
pre-processed by removing mean-per-time points using GIFT. In order to identify the
functional networks within MD regions that were consistently recruited across
participants, 10-mm radius ROIs based on peak coordinates for the bilateral IFS (-41; 23;
29 and -41; 23; 29), AI/FO (-35; 18; 2 and 35; 18; 2), IPS (-37; -56; 41 and 37; -56; 41)
and ACC/SMA (0, 31, 24) were combined and the ICA was undertaken within that mask.
The information maximization (Infomax) algorithm was then used to extract group spatial
components. In order to ensure the reliability of the spatial decomposition, the ICA was
repeated 100 times with random initial weights using the GIFT ICASSO tool. Group
component time-courses were then back-reconstructed using the GIFT GICA3 method.
Here, the ICA was set to extract two components as prior research (Hampshire et al.,
2012) indicated that MD regions house a dorsal (IFS-IPC) and ventral (AIFO-ACC)
sub-networks. Peak coordinates from the extracted mean components were then used to
generate ROIs using the MarsBar toolbox (http://marsbar.sourceforge.net), which
Both fixed- and random-effects analyses were completed using SPM5. Separate
fixed-effects analyses were carried out on the individual participant data and analysed
using general linear modelling. In the first experiment, 45 regressors were generated
using trial events that were specific for the stimulus domain (Numbers, Position, and
Shapes), load (3, 5, and 7) and stage (Cue, Encode, Delay, Response, and Rest). In the
second experiment, 40 regressors were generated using trial events that were specific for
stimulus domain (Numbers and Position), load (3 and 6), cognitive process (Maintenance
and Manipulation) and stage (Cue, Encode, Delay, Response and Rest). Six movement
regressors and a resting baseline constant were also added into the model of both
experiments.
All regressors were created by convolving the onsets and durations of each event
using a canonical hemodynamic response thus ensuring that beta-values represented an
estimate of the neural response per unit time. Beta-weighted images from different
stimulus domains, WM loads and/or cognitive processes were examined at the group
level using random-effects analyses in order to show brain regions that were differentially
activated when different trial types were contrasted. T-tests were then used to compare
the mean voxels for a specific stimulus domain, load and/or cognitive process for the
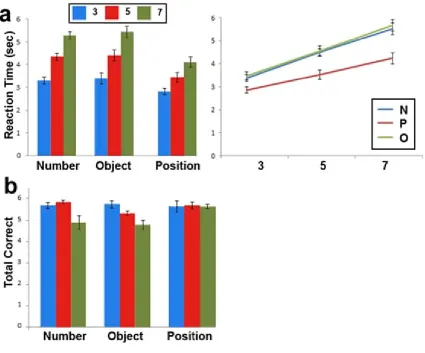
1.8 Experiment 1: Behavioural Results
All 19 participants completed three blocks of 18 trials. The effects of stimulus
domain (Numbers, Position or Objects) and load (3, 5 or 7) on reaction times (RT)
(Figure 4a) were examined using a 3 × 3 repeated-measures analysis of variance
(ANOVA). The findings revealed a significant interaction between domain and load (F4,
72 = 2.651, p < 0.05) as seen in the line graph of figure 4a. Noticeably, the interaction is
mostly driven by a greater effect of load on number and object trials than position.
Using a similar 3 x 3 repeated measures ANOVA, the effects of stimulus domain
and load on the total number of correctly solved problems were also examined (Figure
4b). There was only a significant main effect of load (F1.338, 24.083 = 11.850; p < 0.01)
such that significant decreases in accuracy were present when contrasting medium- (p <
0.05) and low-load trials (p < 0.001) to high-load trials. No significant main effects of
stimulus domain (p > 0.08) or interacting effects (p > 0.1) of load and stimulus domain
were present.
In order to examine the domain-specific brain activations without the effects of
general difficulty, accuracy-matched trials (Number-5, Position-7 and Object-3) were
Figure 4: Behavioural results from experiment 1. (a) Mean RT with the standard error of the mean. There was a significant interaction between domain and load as seen on the
left image. Load has a greater effect on RT for object and number trials than the position
trials. (b) Mean number of correct responses (out of a total of 6). There was a significant
main effect of load such that increasing load significantly decreased the number of
correctly solved problems. (*p < 0.05, ** p < 0.01, *** p < 0.001) Error bars represent
1.9 Experiment 1: Neuroimaging Results
A two-component ICA of MD regions was used in this experiment because our
previous factor analysis study (Hampshire et al., 2012) showed that only two statistically
significant components accounted for ~90% of the variance. As predicted, the results
generated two networks (Figure 5) that were highly similar to the previous results. Peak
coordinates were recorded for these networks and they were used to generate ROIs.
Specifically, a ventral component encompassed bilateral AI/FO (-34; 18; 2 and 35; 19; 3)
and bilateral ACC/SMA (-5; 23; 34 and 6; 23; 36) whilst a dorsal component covered
bilateral IPS (-35; -59; 41 and 35; -58; 40) and right IFS (45; 14; 32). In order to explore
the functional contributions of these two networks, the data were examined using two
separate 3 x 3 full factorial designs for encoding and delay in SPM5. Factors included
stimulus domain (Number, Position and Objects) and load (3, 5 or 7 items).
Figure 5: Extracted ICA components from experiment 1. The ventral network (red) recruited the bilateral AI/FO and SMA/ACC whilst the dorsal network (blue) recruited
and stimulus domain within both networks. There was a significant main effect of load on
the BOLD signals within both ventral (F = 5.61, p < 0.01) and dorsal (F = 5.76, p < 0.01)
networks (Figure 6a). Pairwise comparisons revealed that increased BOLD signals were
observed during high-load trials within both ventral (low versus high load t = 2.74, p <
0.01; medium versus high load t = 3.28, p < 0.01) and dorsal networks (low versus high
load t = 3.30, p < 0.01; medium versus high load t = 2.84, p < 0.01). In addition, there
was a significant main effect of stimulus domain on the BOLD signals within the ventral
network (F = 10.72, p < 0.001). Pairwise comparisons revealed that increased BOLD
signals were observed during object trials in contrast to number (t = 3.12, p < 0.01) and
position (t = 4.54, p < 0.001) trials (Figure 6b). No significant main effect of domain was
observed in the dorsal network (p > 0.95). Furthermore, no significant interacting effects
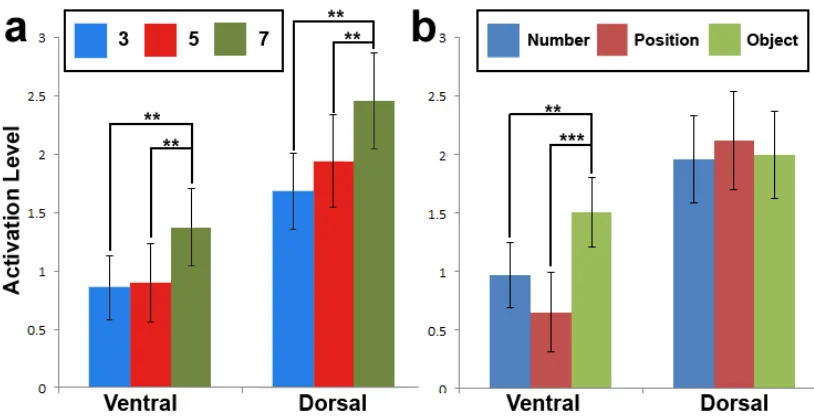
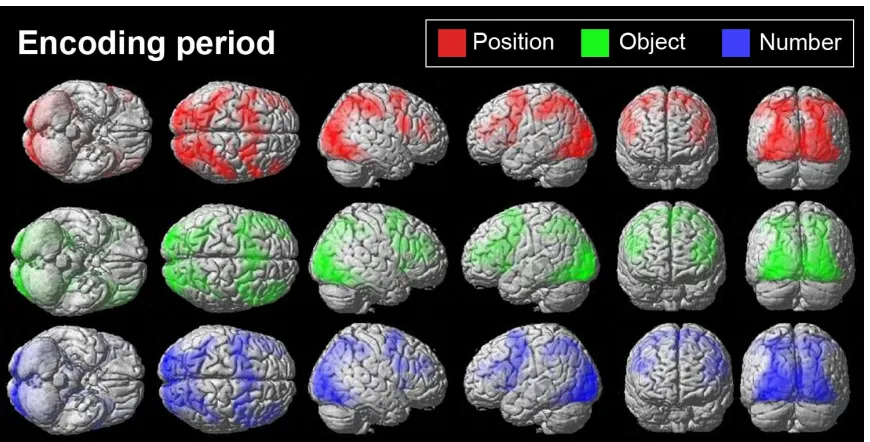
Figure 6: ROI analyses during encoding period of experiment 1. (a) Beta-weights for each level of load. Significant increased BOLD signal was observed during high-load
(7-items) trials within both ventral and dorsal networks. (b) Beta-weights for each level of
domain. Despite significant activation across all levels of domain for both networks, only
increased BOLD signals were observed during object trials within the ventral network.
effects of load were present in the ventral (p > 0.83) and dorsal (p > 0.69) networks.
There was a significant main effect of domain on the BOLD signals within the ventral
network (F = 6.57, p < 0.01). Specifically, increased BOLD signals were observed when
contrasting object trials against number (t = 3.48, p < 0.001) and position trials (t = 2.78,
p < 0.01). No significant main effect of domain (p > 0.07) was observed in the dorsal
network. Furthermore, no significant interacting effects of load and domain were present
in the ventral (p > 0.98) and dorsal networks (p > 0.88).
Figure 7: ROI analyses during the delay period of experiment 1. (a) Beta-weights for each level of load. Significant activations were evident for all levels of load with no
significant differences across levels. (b) Beta-weights for each level of domain. Increased
activation was evident within the ventral network during object vs. number and position
trials (* p < 0.05, ** p < 0.01, *** p < 0.001). Error bars represent standard error of the
To test whether or not the significant increased BOLD signals within the ventral
network during object trials were due to general difficulty rather than domain specific
activation, accuracy-matched activations were contrasted. A correlation coefficient matrix
(Table 1) was conducted on the number of correct responses for each trial condition of
every subject. The trial conditions that had the highest correlation coefficients were used
in the subsequent accuracy-matched ROI analyses. In particular, BOLD signals from
medium-load position (P5) and medium-load number trials (N5) were contrasted against
the BOLD signals from low-load object trials (O3) (Figure 8).
During encoding, significant increased BOLD signals were present when
contrasting object against number trials (t = 2.838, p < 0.05) and position trials
(t = 2.643, p < 0.05). During the delay, significant increased BOLD signals were
observed when contrasting object against number (t = 3.146, p < 0.01) but not position
trials (t = 1.942, p = 0.068). Thus, it appears that the ventral network is sensitive to
non-verbal and non-spatial object stimuli. However, given that the ventral network was also
activated during position and number trials, this difference is statistical as opposed to
The highest correlation coefficients (in green) were subsequently used for the
accuracy-matched ROI analyses.
O3 O5 O7
N3 0.09 -0.01 0.13
N5 0.40 0.33 0.16
N7 0.22 -0.15 -0.11
P3 0.24 0.13 0.11
P5 0.36 0.05 0.18
P7 0.03 -0.26 -0.22
Figure 8: Accuracy-matched contrasts within the ventral network. The figure illustrates the beta-weights for low load (3-items) objects, medium load (5-items)
positions and medium-load (5-items) numbers during the encoding and delay periods
within the ventral network. There is greater activation for object trials relative to number
and position trials during encoding and delay within the ventral network even when
1.11 Experiment 1: Whole brain analyses
Voxel-wise whole brain analyses were used to identify the brain regions that were
specific to certain stimulus domains and load. Contrast maps comparing each of the
experimental conditions to baseline were generated for individual participants and entered
into group-level random-effects analyses. Data from the encoding and delay periods were
analysed using a 3x3 factorial design with load and stimulus domain as factors. A
subsequent conjunction analysis of object against number contrast and object against
position contrast was conducted to find overlapping object-specific regions. Similar
conjunction analyses were also used to find position and number-specific brain areas.
Examination of the domain-specific results during the encoding stage (threshold
corrected using false discovery rate, FDR, of p < 0.05) showed that posterior and anterior
areas were sensitive for spatial and non-spatial processing, respectively (Figure 9 – upper
image). In addition, left-hemispheric regions were sensitive for number trials. Likewise,
analyses that examined the main effects of domain during the delay period (threshold
corrected using FDR of p < 0.05) also revealed similar dorsal and ventral areas sensitive
for spatial and non-spatial processing. However, number-specific activations were not
present at the corrected threshold during maintenance (Figure 9 – lower image). Baseline
activation of trials separated by domain during the encoding (Figure 10) and delay
periods (Figure 11) indicates that the frontoparietal network is strongly active regardless
of stimulus domains.
Examinations of load effects during the encoding stage (threshold corrected using
FDR of p < 0.05) showed that when contrasting high- against low-load trials, primary
visual and DLPFC areas are recruited (Figure 12, Error! Reference source not found.Table 2) in line with previous research (D'Esposito et al., 2000). Interestingly, contrasts comparing high- against low-load trials during the delay stage showed no
Figure 9: Whole-brain analyses of stimulus-specific activations. The figure depicts whole-brain maps from group-level analyses with FDR correction at p < 0.05.
Conjunction analyses of activations during object trials against number and object trials
against position are shown in green. Similar conjunction analyses were applied to position
Figure 10: Baseline activation during the encoding period of trials separated by domain. The figure depicts whole-brain maps from group-level analyses with FDR correction at p < 0.05.
Figure 11: Baseline activation during the delay period of trials separated by domain.
The figure depicts whole-brain maps from group-level analyses with FDR correction at
Verbal > Object -12 -87 3 9.95 L Calcarine 17 Verbal > Position -3 -84 15 8.94 L Calcarine 18
-9 -57 0 8.00 L Lingual 18
Encoding Period -51 -6 42 7.42 L Post central 6
-63 3 21 6.54 L Post central 43
-57 -42 18 5.66 L Superior Temporal 42
-21 -27 -3 4.49 L Hippocampus ---
Position > Object 63 -24 42 10.7 R. Supramarginal 1 Position > Verbal -60 -27 39 10.3 L. Supramarginal 2
-15 -63 60 7.73 L Precuneus 7
-24 -9 54 7.67 L superior frontal 6 Encoding Period 24 -6 57 7.06 R superior frontal 6 51 6 18 6.98 R Rolandic Operculum 6
-39 -81 30 6.03 L Mid Occipital 19
Object > Position Object > Verbal
Encoding Period -57 -33 -3 -12 24 36 30 -54 60 30 -96 30 24 60 39 15 39 21 -15 9 18 4.83 4.55 4.16 3.50 3.96 3.89 3.67
L. Inferior Parietal L. Mid Frontal L. Medial Superior Frontal
L. Superior Occipital R. Inf. Frontal. Orb
R. Inf. Frontal Tri. R. Superior Frontal
40 10 32 18 11 48 10 Load effects
(High > Low)
Encoding Period 9 -27 27 -45 45 33 -90 -3 0 3 6 21 6 51 48 30 27 9 16.73 7.17 6.62 6.48 5.12 4.52 R. Calcarine L. Mid Frontal L. Mid Frontal L. Precentral R. Precentral R. Insula 17 6 6 44 44 48 Position > Object
Position > Verbal
Delay Period 42 -18 -21 51 -54 54 -24 -36 -63 -3 6 6 -60 -72 45 57 60 39 24 -6 30 7.67 7.48 6.94 5.53 5.24 5.23 4.56 R. Supramarginal L Superior Parietal L Superior Frontal
R. Precentral L. Precentral R. Inferior Temporal
L. Mid Occipital
2 7 6 6 6 37 19 Object > Position
Object > Verbal
Delay Period -6 30 -33 -45 30 -15 60 57 15 -30 27 21 18 -9 -6 5.05 4.67 4.46 3.69 3.61 --- R. Mid Frontal L. Superior Medial Frontal
All 16 participants completed three blocks of 16 trials. The effects of cognitive process
process (maintenance or manipulation), stimulus domain (Number or Position) and load
(three or six) on RT (
p < 0.001). Further pairwise comparisons revealed that at low loads, RTs of number trials
are significantly shorter than RTs of position trials (p < 0.05). However, at high-load,
RTs of number trials are significantly longer than RTs of position trials (p < 0.001). No
significant main (p > 0.7) effect of RT by the type of cognitive processes was observed.
Furthermore, no interacting effects of RT by the cognitive process type and load (p >
0.2), cognitive process type and domain (p > 0.4) or three-way interactions were present
Figure 13b) were also examined. There was a significant interaction between stimulus domain and load (F1,15 = 6.429, p < 0.05) such that the accuracy of number trials
was significantly lower during high rather than low-load trials (p < 0.001). In contrast,
accuracy of position trials showed no significant differences between different loads (p >
> 0.8). In addition, no interacting effects of accuracy by cognitive process type and load
(p > 0.069), cognitive process type and domain (p > 0.8) or three-way interactions were
Figure 13: Behavioural results from experiment 2. (a) Mean RTs with the standard error of the mean. There was a significant interaction between stimulus domain and load.
There were no significant main or interacting effects by the cognitive process type.
(b) Mean number of trials correct (out of a total of 6) with the standard error of the mean.
There was a significant interaction between stimulus domain and load such that accuracy
significantly decreased during number trials at higher loads. (*p <0.05, ** p < 0.01,
1.13 Experiment 2: Neuroimaging Results
As in the previous experiment, two MD sub-networks were extracted when
applying a two-component ICA with a mask of MD regions (Figure 14). These networks
were similar to the reasoning and short-term memory networks documented in previous
publication (Hampshire et al., 2012). Using these two component maps, significant peak
coordinates were recorded and used for ROI analyses. In detail, component one consisted
of bilateral IPS (-35; -58; 40 and 35; -58; 40), right IFS (44; 16; 33) and dorsal areas of
the ACC/SMA (5; 9; 49 and -4; 8; 49) whilst component two consisted of bilateral AI/FO
(-34; 18; 3 and 35; 19; 4) and bilateral ACC/SMA (-5; 23; 35 and 6; 23; 37). In order to
explore the functional contributions of these two networks, data were examined using two
2 x 2 x 2 full factorial designs for encoding and delay periods in SPM5. Stimulus domain
(Number or Position), WM load (3 or 6 items) and cognitive process type (Maintenance
or Manipulation) were included as factors.
Figure 14: Extracted ICA components from experiment 2. The ventral network (red) recruited bilateral AI/FO and SMA/ACC whilst the dorsal network (blue) recruited the
Figure 15: Overlapped components from both experiments. This figure depicts the extracted ventral (Bottom) and dorsal (Top) components from experiment 1 (green),
1.14 Experiment 2: ROI results
During the encoding period, there was robust activation in the ventral (Figure 16a)
and dorsal networks (Figure 16b). Specifically, there were significant main effects of load
in the ventral (F = 5.93; p < 0.05) and dorsal networks (F = 14.05; p < 0.001). Increased
BOLD signals were observed during high load trials for both ventral (t = 2.43; p < 0.05)
and dorsal networks (t = 3.75; p < 0.001). This is in line with our previous experiment,
which showed increased BOLD signals in the ventral and dorsal networks during
high-load trials. Despite strong activation, no additional main effects of stimulus domain were
present in both ventral (p > 0.38) and dorsal networks (p > 0.35). Furthermore, no
interacting effect of the BOLD signal by stimulus domain and load was present in either
ventral (p > 0.75) or dorsal networks (p > 0.17).
Given that participants did not know whether to manipulate or maintain
information during the encoding stage, we anticipated that there would be no effect of
cognitive process types. As expected, no main effect of the BOLD signal was observed in
either the ventral (p > 0.21) or dorsal (p > 0.18) networks. Furthermore, no interactions
between the domain and cognitive process type (pventral > 0.13; pdorsal > 0.10), nor load
and cognitive process type (pventral > 0.19; pdorsal > 0.08) were observed. There were also
no significant three way interaction for either ventral (p > 0.29) or dorsal networks (p >
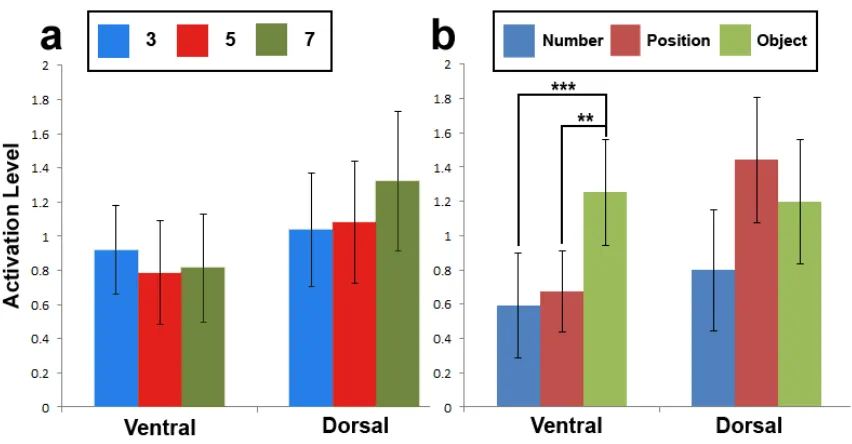
Figure 16: ROI analyses during the encoding period of experiment 2. (a) Beta-weights for ventral network. (b) Beta-Beta-weights for dorsal network. For both ventral and
dorsal networks, there was significantly increased BOLD signal as load increased. No
other significant main or interacting effects of domain or type of cognitive function were
present. (* p < 0.05, ** p < 0.01, *** p < 0.001) Error bars represent standard error of
During the delay, there was significant activation for all levels of load, stimulus
domain and cognitive process types within the ventral and dorsal networks. Within the
ventral network (Figure 17a), there was a significant interaction of load and stimulus
domain (F = 10.19, p < 0.01). Pairwise comparisons revealed that there was a significant
effect of load for number but not position trials such that increased BOLD activity was
observed during high-load number trials (t = 3.49, p < 0.001). No main effect of cognitive
process types was present in the ventral network. Furthermore, no interacting effects
between the load and cognitive process type (p > 0.20), stimulus domain and cognitive
process type (p > 0.80) were evident. The three-way interaction was also not present (p >
0.87).
More importantly, within the dorsal network (Figure 17b), there was a significant
interaction effect of load during manipulation trials but not maintenance (F = 7.01, p <
0.05). Increased activation was observed during high-load manipulation trials (t = 2.46, p
< 0.001). In addition, there was a significant main effect of domain present in the dorsal
network (F = 6.78; p < 0.05) such that increased BOLD signals were present during
position trials (t =2.60; p <0.01). However, no interaction between domain and cognitive
process type (p > 0.22) was present. The three-way interaction was also not present (p >
Figure 17: Significant interacting effects during the delay period of experiment 2.
(a) Beta-weights for ventral network. Findings demonstrate increased activation in the
ventral network when required to process numbers at high load. (b) Beta-weights for
dorsal network. Results revealed an increased activation in the dorsal network when
required to manipulate at high load. (*p < 0.05, **p < 0.01, ***p < 0.001)
1.15 Experiment 2: Whole brain analyses
Voxel-wise whole brain analyses were applied to test whether domain-specific
effects from the first experiment could be replicated. Contrast maps comparing each of
the experimental conditions to baseline were generated for individual participants and
entered into a series of group-level random effects analyses. Data from the encoding and
delay stage were analysed using a 2 x 2 x 2 factorial design with load, stimulus domain
and type of cognitive process as factors. Unlike the first experiment, there was no need to
use a conjunction analysis since there were only two levels for each of the factors.
Examination of the statistical parametric maps of stimulus-domain during the
encoding stage (threshold corrected using FDR of p < 0.05) revealed that dorsal regions
were sensitive for spatial processing whilst left-hemispheric regions were sensitive for
number processing (Figure 18 and Table 3). A similar examination analysing the delay
stage (threshold corrected using FDR of p < 0.05) revealed a similar dorsal and
left-hemispheric activation for spatial and verbal processing respectively.
Examination of load effects during the encoding stage (threshold corrected using
FDR of p < 0.05) showed that when contrasting high- against low-load trials, primary
visual cortex and frontal brain regions were strongly activated (Error! Reference source not found.Table 3). Like the first experiment, contrasts that comparing high- and low-load trials during the delay stage showed no significant effect. No other significant main
or interacting effects with domain were revealed.
Lastly, examinations of the cognitive process types showed no significant main or
interacting effects during the encoding. As suspected, participants did not reveal any
differences during encoding as they were unaware of whether to maintain or manipulate
information. Similar contrasts (threshold corrected using FDR of p < 0.05) were used to
examine the main and interacting effects during the delay stage. No main effects by
cognitive process types were found. However, an interacting effect of load and cognitive
process types (high against low load manipulation trials) revealed specific dorsal
frontoparietal regions, very similar to the dorsal network of the MD areas, were recruited
Figure 18: Whole-brain analyses from experiment 2. The figure depicts whole-brain maps from group-level analyses of experiment 2 with FDR correction at p < 0.05.
Contrast activation of position against number trials during encoding and delay periods is
shown in red. Similarly, contrast activation of number against position trials during
encoding and delay period is shown in blue.
Table 3: Peak activation coordinates from whole brain analysis of experiment 2.
Trial Type x y z t Region BA
Number (Verbal) Encode Period -51 -45 -21 30 -60 -6 -42 -72 -54 3 48 21 9 6 15 8.41 7.28 6.77 6.09 5.69
Post central gyrus L. Supplementary motor area
L. Calcarine R. Calcarine L. Rolandic Operculum
6 6 19 19 48 Position (Spatial) Encode Period 39 27 -21 54 54 -54 -39 -3 -3 9 -57 -60 45 60 57 27 -6 -6 10.84 8.82 8.02 7.49 6.71 5.42
R. Inferior Parietal R. Superior Frontal L. Superior Frontal R. Inferior frontal operculum
R. Inferior Temporal L. Inferior Temporal
40 6 6 44 37 37 Load effects
(High > Low)
Encode Period -18 -6 6 -51 33 -72 -78 -90 -3 -3 -12 -6 6 45 54 13.12 12.71 12.31 7.15 5.50 L Cerebellum L. Lingual R Calcarine L Pre-central R Mid Frontal
18 17 17 6 6 Number (Verbal) Delay Period -51 -3 -45 -60 -12 24 -6 6 -42 3 -78 51 48 63 21 12 15 30 7.09 5.99 5.72 5.61 5.21 3.76
Post central gyrus L. Supplementary motor area
L. Supplementary Temporal L. Rolandic Operculum
Left Calcarine R. Middle Gyrus
6 6 41 48 17 46 Position (Spatial) Delay Period 21 -18 -24 30 54 -33 54 -63 -66 -6 -3 9 -39 42 57 54 57 57 30 -15 6 11.89 10.82 9.55 8.96 6.86 4.71 4.03
R. Superior Parietal L. Superior Parietal L. Superior Frontal R. Superior Frontal R. Inferior frontal operculum
L. Fusiform R. Frontal Inferior Tri
7 7 6 6 44 37 45 Interacting effect
(Load x Process)
High > Low
-3 -27 9 -48 45 6 -63 -66 0 -33 63 54 48 51 36 4.79 4.60 4.40 4.32 4.07
L Superior Motor Area L. Superior Parietal
The findings reported here demonstrate that the global, domain and process
models are not mutually exclusive as was previously assumed. Instead, they provide
different perspectives on the functional organisation of WM. For instance, results from
the first experiment demonstrated that there was stimulus domain sensitivity across much
of the frontoparietal cortices including the ventral MD network. In fact, the whole-brain
analyses showed that dorsal, ventral and left-hemispheric frontoparietal cortices were
differentially recruited when processing spatial, object and verbal stimuli respectively as
described by the domain model. Critically, these sensitivities to stimulus domains were
still evident when controlling for general difficulty. However, within MD cortex such
differences were a matter of extent as opposed to absolute given that all MD sub-regions
were still strongly activated during encoding and maintenance regardless of stimulus
domains. Therefore, supporting evidence for both the domain and global models may be
drawn from analysis of the same data.
Equally importantly, findings from our second experiment demonstrated that the
process model also co-exists with the global model. Specifically, the ICA showed that
two functional networks, ventral and dorsal, are encompassed within MD cortex. Like
most WM experiments, both networks showed strong activation throughout the encoding
and delay periods at all levels of load, for all stimulus domains and during both
maintenance and manipulation. However, significantly greater activation was observed in
the dorsal network when information had to be manipulated under high-load conditions
whereas no such effect was evident in the ventral MD network.
The findings from these two experiments concur with our hypothesis that the
global, process and domain models are not mutually exclusive. They also refined our
hypothesis even further. Originally, we predicted that the process model provided a more
detailed picture of the same system described by the global model given the results from
our earlier study (Hampshire et al., 2012). This prediction was true as sensitivities to
cognitive processes differed across MD sub-networks whereby the dorsal network was
significantly activated during manipulation demands. We also predicted that brain areas
and process models. However, this was not quite the case. Whilst many areas that showed
domain sensitivity were located outside of the MD cortex, the ventral network was more
active when processing object specific information even after accounting for general
difficulty. Taken as a whole, the process model is nested within the global model whilst
the domain model is partially overlapping. Despite this, all three models are partially
correct at describing neural correlates of WM. As opposed to discrete processing modules,
the data presented in this study can be best explained by functional gradients. It should be
noted that gradients and networks may co-exist within a system.
Within the WM literature, many neuroimaging studies have poorly controlled
visual display and motor response confounds that prevent a comprehensive analysis of
WM activations. Generally, many neuroimaging studies focus on one stimulus domain,
which does not allow for any isolation of stimulus-dependent dissociations and must be
compared between experiments. To counter these issues, our WM paradigms displayed
multiple stimulus domains simultaneously during the encoding and probe periods. In
addition, participants had to select one of multiple post-delay changes depending on the
cue presented at the beginning of the trial. As such, only the focus of attention and WM
processes were manipulated. Given that only task-requirements were changing, our
object-verbal-spatial dissociations did not fall prey to the same visual display confounds.
In order to study the neural architecture during different cognitive processes, rotation and
addition requirements were added into the delay period of our second WM experiment.
This allowed for proper comparisons between different types of manipulation as well as
stimulus domains. Furthermore, motor response confounds, including eye-movements,
are rarely managed (Postle, 2006). Our paradigms required participants to make the same
motor responses, such as eye movements, regardless of stimulus domains. By removing
these confounds, our findings show a complete analysis of WM.
1.17
Independent buffers outside of MD
The global model postulates that MD regions are insensitive to stimulus features
whilst adaptive to task specific information. Despite strong BOLD activity within MD
regions throughout all stages of the WM tasks, only modest dissociations were observed
bilateral superior occipital and inferior parietal regions were activated during object WM;
bilateral superior frontal sulci and superior parietal regions were recruited during spatial
WM; and left lateral orbitofrontal and fronto-polar cortices were activated during verbal
WM. This is very similar to the Multiple Component Model of WM, which defined WM
as two stimulus-dependent independent buffers for storage and a stimulus-independent
Central Executive System that organised information (Baddeley and Hitch, 1974). Our
results suggest that the regions outside of MD parallel stimulus-dependent buffers whilst
the regions inside MD resemble the stimulus-independent Central Executive System.
For WM tasks that use verbal stimuli, early research documented that Broca’s area
(area 44/45) was crucial for maintenance and sub-vocal rehearsal (Cohen et al., 1997;
Demb et al., 1995; Awh et al., 1996). Furthermore, patients with deficits in Broca’s area
have been documented to have aphasia. Conversely, prior research has demonstrated that
the posterior part of the superior frontal sulcus is significantly activated by WM tasks that
use spatial stimuli (Courtney et al., 1998). Disturbances within this area following stroke
(Carlesimo et al., 2001) or trans-cranial magnetic stimulation (Mottaghy et al., 2002)
selectively interfere with spatial processing. In contrast, WM tasks that use object stimuli
have been documented to activate the ventral PFC including inferior and middle frontal
gyri (Courtney et al., 1996; Courtney et al., 1997). Disruption of the ventral PFC has been
documented to show selective impairment on non-spatial WM tasks (Bechara et al., 1998;
Mottaghy et al., 2002). Within our experiments, an assortment of brain regions including
Broca’s area was recruited when participants focused on verbal information. In contrast,
the superior frontal gyrus and dorsal parietal areas were recruited when participants
attended to spatial stimuli. Conversely, many ventral frontoparietal areas including
ventral MD regions were recruited when focusing on fractal objects. In summary, results
from our experiments and literature review have shown that dorsal, ventral and
left-hemispheric frontoparietal areas outside of stimulus-independent MD regions are variably
Unlike spatial and verbal processing, object stimuli have inherent spatial and
non-spatial characteristics including texture, colour and orientation (Courtney, 2004).
Furthermore, participants have been known to verbalise objects in order to improve
encoding. As such, isolating brain regions specific for non-spatial processing is rather
difficult. Within our own study, we used fractal patterns as objects in order to prevent
participants from verbalising the stimuli. However, these abstract fractals were inherently
more difficult compared to verbal and spatial stimuli and also contained higher-order
structure, which may be more salient to lateral frontal cortices (Bor et al., 2003). For
future studies, using less complex object specific stimuli may be more appropriate when
identifying non-spatial stimulus specific brain areas.
1.18
Adaptive coding and specialisation
The global model proposes that WM, attention and cognitive control are all
subsets of a common underlying cognitive process due to the highly adaptable nature of
the MD regions. From a detailed perspective, neurons within MD have adaptive coding
properties that process task-relevant information, thus generating a temporary mental
workspace. Moreover, these neurons are involved in almost all tasks with nominal
functional specialisation (Duncan, 2001; Duncan 2006). However, specialisation within
MD regions is not necessarily exclusive with the idea of an adaptive coding system. For
example, some ventral MD regions may house neurons that adapt to code for simple and
concrete aspects of a task such as relevant stimuli and planned responses (Hampshire et
al., 2009). Other more dorsal regions may adapt to code for task relevant rules and higher
order relationships between maintained items (Hampshire & Owen, 2010). To put it
another way, there may be subdivisions between regions that simply hold representations
online and regions that process those representations by rearranging or chunking them in
order to predict outcomes and solve problems. Consequently, the same subdivisions
posited by the process model may actually be nested within the global model.
Indeed, our results revealed that two functionally distinct networks exist within
the MD regions and are co-recruited during the encoding and delay periods of WM tasks.
In both experiments, a ventral network composed of the AI/FO and SMA/ACC, and a
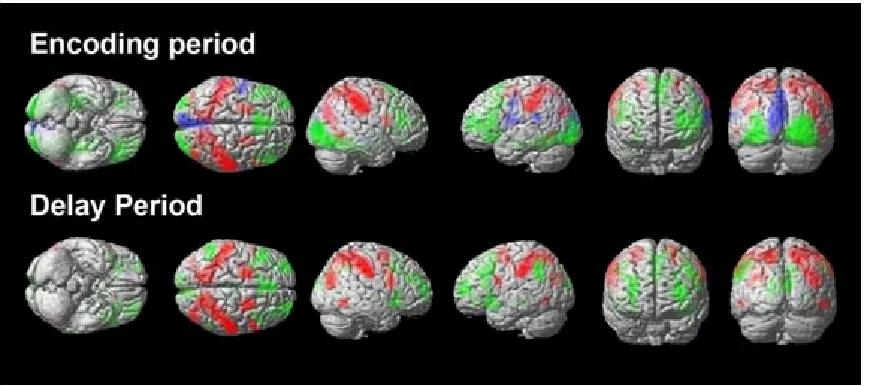
indistinguishable in the two experiments reported here (Figure 155) although the dorsal
network is stronger in second task. More importantly, these two networks are strikingly
similar to the ventral-dorsal functional axis of the process model. This model proposes
that the VLPFC subserves simple cognitive operations such as active selection and
comparisons, whilst the DLPFC subserves higher-order executive processes including
manipulating information (Petrides, 1994; Owen et al., 1998). In the previous study
(Hampshire et al., 2012), tasks that required short-term memory maintenance strongly
activated the ventral network, whilst tasks that required mental manipulation strongly
activated the dorsal network. In this study, findings from our experiments revealed that
only the dorsal network is more activated when manipulating information at high loads.
The dorsal network has been activated by a host of psychological tasks including
chunking (Bor et al., 2003), analogical reasoning (Hampshire et al., 2011) spatial
planning (Cohen et al., 1996), mental rotation (Owen et al., 1996) and arithmetic. Our
results showed that this network was recruited during addition and spatial rotation with no
particular sensitivity for either process. In addition, the dorsal network showed increased
BOLD signal during the encoding period of high-load trials for both experiments. In line
with prior research (Postle et al., 1999; Rympa et al., 1999; Bor et al., 2003), this network
is likely recruited to chunk information in order to improve encoding. Originally, we
expected that the dorsal network would also be recruited when manipulating information
at low loads. However, some participants may have both encoded and transformed the
stimuli during the encoding period in order to find the unmatched target more accurately.
If true, the dorsal network may have been less activated during the delay period of
manipulation trials. In contrast, participants may not have processed and held both
encoded and transformed information during higher loads. Additional experiments are
needed to verify this claim. On a more general role, the dorsal network has been proposed
to be a specialised hub for transforming information according to task rules (Hampshire
The ventral network has been activated by a host of tasks including inhibition
(Hampshire et al., 2010), target detection (Hampshire et al., 2009), and extra-dimensional
shifting (Hampshire et al., 2006) among many others. Our first experiment revealed that
though the ventral network was activated by all stimulus domains, objects showed greater
activation during the encoding and delay. As a result, it is possible that this network
carries a greater sensitivity for non-spatial information, but given that spatial and verbal
stimuli also activated this network, it is rather unlikely. Instead, it is possible that
processing certain stimuli such as fractals required more attention than processing spatial
and verbal stimuli. On a general level, the ventral network has been proposed to maintain
and bias attention between competing representations in modality specific posterior
regions in order to maintain their relevance to current behavioural goal (Owen and
Hampshire, 2009).
1.19
Recent Meta-analysis
Observations in a recent meta-analysis (Rottschy et al., 2012), which included 189
fMRI experiments, accorded well with our results. First, the analysis revealed a
stimulus-general central core network engaged in many WM tasks. The same authors also
suggested that this network may not be limited to WM but may also span several higher
cognitive functions, including attention and action control. Second, their results showed
that n-back tasks, which generally place greater demands on manipulation, converged in
the DLPFC. In contrast, Sternberg tasks, which normally place greater demands on
maintenance, showed more consistent activation in the left inferior frontal gyrus.
Critically, this would mean that the ventral-dorsal functional axis of the process model
exists in the LPFC. Lastly, their analysis demonstrated ventral and dorsal brain regions
specific for non-spatial and spatial stimuli respectively in more posterior and caudal areas
of the frontal lobe. Similar to our results, their core WM network is both anatomically and
functionally similar to the MD regions of the global model. Furthermore, their results also
showed that activation differences from the n-back and Sternberg tasks parallel the
ventral-dorsal functional axis posited by the process model. In addition, their stimulus
non-1.20
Conclusion
A consensus has not yet been reached regarding the functional organisation of WM
processes within the brain, but our experiments here have the potential to reconcile the
domain, process and global models. Critically, our results show that these models are not
mutually exclusive and all three models may in fact be partially correct. The process
model is nested within the MD regions of the global model, whilst the domain model is
partially independent from the others. On a very broad level, many cognitive functions
including WM, attention and cognitive control rely heavily on the adaptive coding
properties of the frontoparietal MD cortex (Duncan 2006). However, this does not
exclude the possibility of specialisation, as previous research has demonstrated that a
ventral/dorsal functional axis exists within these regions (Hampshire et al., 2012). Our
results further demonstrate that this axis is comparable to the axis of the process model
whereby the ventral and dorsal networks are activated by maintenance and manipulation
respectively. Beyond the general global processing of MD regions, WM also requires
specialised buffers located in other brain regions. Our results demonstrated that dorsal,
ventral and language regions outside of MD are recruited during spatial, non-spatial and
verbal processing respectively. In conclusion, our results support the theory that WM is
an emergent property of multiple specialised brain systems, and the three views discussed