2164 | P a g e
Analysis of Alkalinity in Tube Wells and Hand Pump Water
Subhash Malik
1and Shailly Malik
21
Department of Chemistry D. J. College Baraut (Baghpat) (India)
2
Shri Venkateshwara University, Gajraula, Amroha UP (India)
ABSTRACT
The Physico-chemical parameters of ground water of different villages during the pre-monsoon and post
monsoon seasons were comparatively analysed. Study has been carried out to assess ground water quality in
different villages of Shamli district of Uttar Pradesh. The ground water samples were collected from hand
pumps and tube wells. The study area experiences a seasonal climate and broadly divided into three
seasons as winter (November to February), summer (March to June) and rainy (July to October).
Physico-chemical parameters of ground water were determined. The results broadly indicate that the quality of
water varied considerably from one location to other. Systematic study has been carried out to assess the
water quality of River Krishna adjoining areas in Shamli District. Water samples from sampling stations
were collected and analysed. Each parameter was compared with the standard desirable limit of that
parameter in river water as prescribed by different agencies. The analytical data of various
physicochemical parameters indicates that some parameters are found to be in excess than the prescribed
limit. Values of water samples show the contamination of ground water.
Keywords: Groundwater, Hardness,
Hand pumps,
Physico-chemical parameters,Tube wells
, Waterquality
I INTRODUCTION
Most of the development activity is still dependent upon rivers. It becomes very important to systematically
study the status of the pollution of the rivers in the relation to adjoining areas i. e. villages, towns etc (Gautam et
al., 2010 and Pathak et al., 2013). Man requires a minimum body intake of water which varies from 2.8 to 5.0
liters per day. If there is no intake of water in to the body then death can occurs within couple of days
(Pushpendra et al., 2017 and Mani et al., 2010). Water is essential to man for maintain personal body
hygiene. Ground water pollution is an environmental problem that has attracted international attention (Mishra
et al., 2009 and Pushpendra et al., 2014)). The difference between atoms is expressed by atomic numbers
2165 | P a g e
pollution. The chief source of pollution is identified as sewage constituting 84 to 92 percent of the wastewater. Industrial waste water comprised 8 to 16 percent.
Water pollution is related to water borne diseases like typhoid, hepatitis, jaundice, cholera, diarrhea and
dysentery. Rapid population, growth land development along river basin urbanization and industrialization are
major cause for this (Pushpendra et al., 2011). These are also responsible for giving rise to water pollution and
environmental deterioration. Increased human activities, contamination of surface and ground water by sewage
disposal municipal and drainage system are also leading the problem. The Physico-chemical indices are based
on the values of various Physico-chemical parameters. In water sample, biological indices are derived
from the biological information and are calculated using the species composition of the sample. River
water has been used as drinking water and irrigation water of agriculture and for fish culture throughout the
history of the mankind (Rana et al., 2014 and Pushpendra et al., 2018). In this study the goal is to access the
quality of ground water at different places of different villages. The domestic sewage discharged gives rise to
numerous water-borne diseases like typhoid, cholera, dysentery, poliomyelitis, thereby affecting the
human health and deterioration of the water quality.
Ground water is the main source of life for many peoples in the world depending upon the climate and
temperature (Gautam et al., 2010 and Pathak et al., 2013). The surface water pollution issue has been enlisted
as one of the most serious problem in developing countries. Most of the rivers in urban area of the developing
world are the end point of the effluent discharged from the industry (Rana et al., 2014 and Pushpendra et al.,
2018). Now a day’s men is feeling one off the most severe ecological crises of environmental as well as water
pollution is a phenomenon characterized by determination of quality of water as a result of various human
activity.
II MATERIAL AND METHODS
The present study is devoted for valuation off different water quality parameters of groundwater compared on
their geography and particular location. On the basis of the preliminary study, sampling locations were
selected in the study area. Water sample were collected into plastic bottles of 500ml. All samples were
analyzed for Physico-chemical parameters as per procedure prescribed in standard methods and manuals
of instruments. Krishna, the mighty Indian River originates from the Saharanpur, remains the source of
water of millions of Indians. From its source to its entry in to the Hindon, it travels a distance of around
225 Kms. Shamli is a city in Northern India on the bank of the Krishna River north of Delhi. It is an
agriculture pilgrimage centre. Shamli lies along the Krishna River at the boundary between the
2166 | P a g e
winds from July to October. For this study, the water samples were collected. Sampling station werestudied and described properly before the starting of this work.
III EXPERIMENTAL
All the sampling locations were near about the Krishna River. The river is following from Saharanpur via
Shamli district. It is an established fact that the more harmful a given pollutant is, the smaller is its
standard permissible value recommended for drinking water. Sampling stations were situated in the north
and south of Shamli. The stream of the Krishna is separated from the other rivers before merging it in to
Hindon. Before every sampling site, industries also situated and the effluent also enters into the stream.
The domestic sewage mixes upstream to the sampling point. Accurate and timely information on the
quality of water is necessary to shape a sound public policy and to implement the water quality
improvement programmes efficiently. One of the most effective ways to communicate information on
water quality trends is with indices.
The concept behind this was that adjoining area of river may be contaminated due to percolation of river
pollutants in ground water. The qualitative analysis of water samples, were done to fulfill the objective of the
study. The water has been collected during daytime. Sampling is done at each station in plastic sampling
bottles of 500ml capacity. Sampling has been done from the hand pumps and tube wells separately. All the
digital instruments like pH meter, Conductivity meter spectrophotometer were calibrated before use. The
Physico-chemical analysis of water samples were carried out in laboratories of D.J. College Baraut,
Baghpat, UP and Delhi Jal Board. The water samples were collected from 16 different spots during
different seasons during this period. The samples were taken in BOD bottles and plastic jerry canes and
brought to the laboratory with necessary precautions. All samples were labeled properly.
IV RESULT AND DISCUSSION
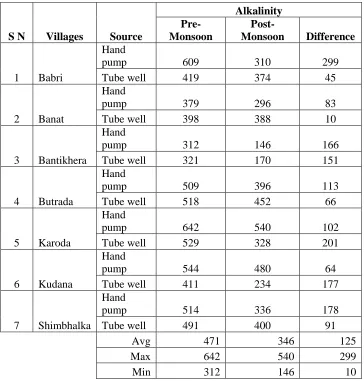
The results broadly indicate that the quality of water varied considerably from one location to other
(Table-1). The prescribed range of Alkalinity is 200-600 mg/l for drinking water. Alkalinity in
groundwater samples varies from 312 to 642 mg/l during pre monsoon season. During the pre monsoon
season highest value was observed 642 mg/l while the lowest was 312 mg/l. In case of post monsoon
period highest value was recorded 540 mg/l while the lowest was 146 mg/l. Alkalinity in groundwater
samples varies from 146 to 540 mg/l during post monsoon season. There was a quite difference in average
values, maximum values and minimum values. These were 471, 642, 312 mg/l and 346, 540, 146 mg/l
2167 | P a g e
V CONCLUSION
Water is a very important substance, as it makes up the larger part of an organism's body. Inside the body
of a human being, there is a skeleton, which makes your body solid and makes sure you can stand up
without falling apart. Water is also a kind of skeleton. It consists of tiny particles, the atoms, just like
every other substance on earth. The flooding of rivers at the time of excessive rains increases ground
water percolation. It may create dilution of pollutants in ground water chambers. Even the polluters like
industry also suffer due to increased pollution of the rivers. Ground water pollution has several
dimensions. Effective monitoring and control of ground water pollution requires the expertise from
various disciplines. In India it is reported that about 70% of the available water is polluted. After the
analysis of water samples of Hand pump and Tube wells from different locations results were compared.
Suitable suggestions were made to improve the quality of water.
REFERENCES
1. Gautam A K, Pushpendra and Rakesh K (2010) Bioremediation of anaerobically treated distillery spent wash
using axenic culture of Proteces microbilis, Bacillus spp, Kleibsiella planticola, Enterobactor sokazaki; M Sc
theses Deptt of biotechnology, Adhunic institute of education and research Delhi Meerut road Duhai, Ghaziabad.
2. Mani R R, Pushpendra and Tyagi A (2010) Optimization of bioremediation of PMDE (post methylated distillery
effluents) by analyzing the environmental factors and inoculums ratio, M Sc theses Deptt of biotechnology,
Adhunic institute of education and research Delhi Meerut road Duhai, Ghaziabad (U.P.)
3. Mishra, S. N., Pushpendra and Singh A. (2009) Effect of different Cadmium concentrations on the Yield of
Different Plant Species, Journal of Management & Technology, Agra, ISSN-0975-6167, Vol. 1 No. 1, 2009 Jan.
Pp 35-47.
4. Pathak A, Dhama P, Dong J Kim (2013) Reduction of Sludge Solids and Metal Bioleaching in a Single Stage
Reactor. In: Geosystem Engineering, 2-3rd May, South Korea.
5. Pathak A, Singh P, Dhama P, Dastidar M. G., Dong J Kim (2014) Comparative Study on Leaching of Nutrients
during Bioleaching of Heavy Metals from Sewage Sludge using Indigenous Iron and Sulfur-Oxidizing
Microorganisms, Canadian Metallurgical Quarterly, 53 (1), 65-73.
6. Pushpendra (2017) Cadmium Contamination Affects Leaf Biomass in Sandy Loam and Sewage Water Irrigated
Soil, International Journal of Advance Research in Science and Engineering, IJARSE, Vol No 06, Issue No 11,
Nov 2017, ISSN: 2319-8354, pp 2157-2163.
(http://www.ijarse.com/images/fullpdf/1518616276_J839Bijarse.pdf)
7. Pushpendra (2018) Plants Biomass generation in Cadmium contaminated Sandy Loam Soil, International Journal
of Advance Research in Science and Engineering, IJARSE, Vol No 07, Issue No 02, Feb 2018, ISSN:
2168 | P a g e
8. Pushpendra (2011) Water Quality Parameters to Determine Quality of Water, Journal of Computer Application
(JCA), half yearly –March 2011, Ajay Kumar Garg Engineering College, 27th Km Stone, NH-24, Delhi-Hapur
Bypass Road, Adhyatmik Nagar, Ghaziabad-201009.
9. Pushpendra and Sharma AK (2014) EDTA-Enhanced Translocation of Heavy Metal from Root to Shoot in
Indian mustard and Toryia Species, International Journal of Advanced Technology in Engineering and Science,
Vol No 2, Issue No 08, Aug 2014 ISSN: 2348-7550, pp 385-389.
(http://www.ijates.com/images/short_pdf/1408968688_P385-389.pdf)
10.Pushpendra and Singh R P (2014). Cadmium Concentration Affects the Root Biomass Adversely during the
Phytoextraction Experiment, International Journal of Advanced Technology in Engineering and Science, Vol No
2, Issue No 09, Aug 2014 ISSN: 2348-7550, pp 56-61.
(http://www.ijates.com/images/short_pdf/1410595607_p56-61.pdf)
11.Rana V (2014) Study on river Hindon with respect to Physico- Chemical Properties of River and its Effect on
2169 | P a g e
Table 1:
Variation in Alkalinity at Various Sampling Sites (Villages/ Towns) of Shamli
District in Hand pumps and Tube wells during Pre-monsoon as well as Post-Monsoon
S N Villages Source
Alkalinity Pre-
Monsoon
Post-
Monsoon Difference
1 Babri
Hand
pump 609 310 299
Tube well 419 374 45
2 Banat
Hand
pump 379 296 83
Tube well 398 388 10
3 Bantikhera
Hand
pump 312 146 166
Tube well 321 170 151
4 Butrada
Hand
pump 509 396 113
Tube well 518 452 66
5 Karoda
Hand
pump 642 540 102
Tube well 529 328 201
6 Kudana
Hand
pump 544 480 64
Tube well 411 234 177
7 Shimbhalka
Hand
pump 514 336 178
Tube well 491 400 91
Avg 471 346 125
Max 642 540 299