Geant-val:
a web application for validation of detector simulations
Luc Freyermuth1, Dmitri Konstantinov2,3,∗, Grigorii Latyshev2,∗∗, Ivan Razumov2,3, WitoldPokorski3, andAlbertoRibon3
1L’École internationale des sciences du traitement de l’information, Cergy, France
2Institute for High Energy Physics named by A. A. Logunov of National Research Centre "Kurchatov
Institute", Protvino, Russian Federation
3CERN, Geneva, Switzerland
Abstract. One of the key factors for the successful development of Monte-Carlo programs for physics simulations is to properly organize regression test-ing and validation. Geant4, the world-standard toolkit for HEP detector simu-lation, heavily relies on this activity. The CERN SFT group, which contributes to the development, testing, deployment and support of the toolkit, is also in charge of running on a monthly basis a set of community-developed tests using the development releases of Geant4. We present the web applicationGeant-val
developed for visualizing the results of these tests so that comparisons between different Geant4 releases can be made. The application is written using the Express.js, Node.js and Angular frameworks and uses PostgreSQL for storing test results. Test results are visualised using ROOT and JSROOT. In addition to pure visual comparisons, we perform different statistical tests (χ2, Kolmogorov-Smirnov, etc.) on the client side using JavaScript Web Workers.
1 Introduction
Geant4 [1] is a toolkit for the simulation of the passage of particles through matter. Its areas of application include high energy, nuclear and accelerator physics, as well as studies in medical and space science.
The Geant4 team produces a public release once a year, with monthly internal develop-ment releases. These releases need to be validated.
Physics validation of Geant4 includes regression testing (comparing physics output from one release to another), comparison of performance between different physics models and validation testing (comparing physics output with published experimental results). As a result it requires analysing a large amount of data produced by Geant4 tests.
2 Requirements
Software validation is a continuous and complex process involving the entire Geant4 com-munity. The main goal of the application we describe here is to provide a fast and convenient web-based validation tool for Geant4 developers.
Below there is a brief list of the requirements to the validation application:
• The procedure for integrating new Geant4 tests should be simple and straightforward; • User should be able to display and analyse one- and multidimensional histograms and
scatter plots, with same or different binning;
• User should be able to compare tests results with experimental data, when available; • It should be possible to produce high quality plots with custom plot style, ranges, scales,
etc using only the website;
• The application should have intuitive, modern and fast user interface;
• Should use the technologies that allows a fast feature development and integration. In order to keep data consistent between all application services aplotdata type was in-troduced. Aplotobject is a central element of the data model ofGeant-valapplication, used for exchanging data between different parts of the web application: displaying data on the web page, calculating result of statistical tests, etc. Files containingplotobjects in JSON [6] format are used to upload data to the database and to generate plots with standalone C++ plotter utility. Eachplot consists of histogram or scatter plot data and necessary metadata describing the configuration used to run the associated Monte-Carlo simulation (Geant4 ver-sion, physics list), test parameters (beams, targets, energies, etc.) and its results (e.g., the name of the quantity measured).
A Python tool namedmc-config-generatorwas developed to produce JSON files containingplotobjects from the output of the validation application. It also provides a uni-form way to prepare and run tests on the batch system (LSF, Torque PBS, HTCondor), and to get information about execution times and any Geant4 exceptions generated during test execution.
For faster deployment, the application is distributed as a Docker image which is hosted on virtual machine provided by CERN VM service. The website is optimised for asynchronous access and plotting and can be easily scaled ”horizontally” by launching new instances.
3 Software components
To implement these ideas in practice, we decided to write the server and client parts of the application in JavaScript, using Node.js [2] and AngularJS [3] and to use ROOT [4] frame-work along with JSROOT [5] library to produce high quality plots. Python and C++were used for writing service utilities.
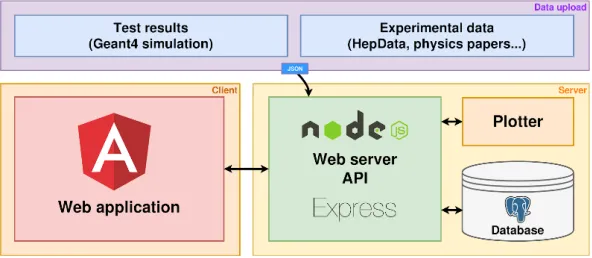
The components of Geant-val web application and the interactions between them are shown in the Figure 1:
• The serveris the core of the Geant4 validation system. It provides a web API that allows clients to access the database, asynchronously responds to the clients requests and gener-ates high quality plots "on the fly" whenever they are requested. The server is written in JavaScript and runs with the Node.js engine.
Below there is a brief list of the requirements to the validation application:
• The procedure for integrating new Geant4 tests should be simple and straightforward; • User should be able to display and analyse one- and multidimensional histograms and
scatter plots, with same or different binning;
• User should be able to compare tests results with experimental data, when available; • It should be possible to produce high quality plots with custom plot style, ranges, scales,
etc using only the website;
• The application should have intuitive, modern and fast user interface;
• Should use the technologies that allows a fast feature development and integration. In order to keep data consistent between all application services aplotdata type was in-troduced. Aplotobject is a central element of the data model ofGeant-valapplication, used for exchanging data between different parts of the web application: displaying data on the web page, calculating result of statistical tests, etc. Files containingplotobjects in JSON [6] format are used to upload data to the database and to generate plots with standalone C++ plotter utility. Eachplot consists of histogram or scatter plot data and necessary metadata describing the configuration used to run the associated Monte-Carlo simulation (Geant4 ver-sion, physics list), test parameters (beams, targets, energies, etc.) and its results (e.g., the name of the quantity measured).
A Python tool namedmc-config-generatorwas developed to produce JSON files containingplotobjects from the output of the validation application. It also provides a uni-form way to prepare and run tests on the batch system (LSF, Torque PBS, HTCondor), and to get information about execution times and any Geant4 exceptions generated during test execution.
For faster deployment, the application is distributed as a Docker image which is hosted on virtual machine provided by CERN VM service. The website is optimised for asynchronous access and plotting and can be easily scaled ”horizontally” by launching new instances.
3 Software components
To implement these ideas in practice, we decided to write the server and client parts of the application in JavaScript, using Node.js [2] and AngularJS [3] and to use ROOT [4] frame-work along with JSROOT [5] library to produce high quality plots. Python and C++were used for writing service utilities.
The components of Geant-val web application and the interactions between them are shown in the Figure 1:
• The serveris the core of the Geant4 validation system. It provides a web API that allows clients to access the database, asynchronously responds to the clients requests and gener-ates high quality plots "on the fly" whenever they are requested. The server is written in JavaScript and runs with the Node.js engine.
• The databaseis used for storing plots containing simulation results or experimental data, together with meta data describing these plots. PostgreSQL [7] is used as database manage-ment system for the application. The database instance is provided by the CERN Database-On-Demand service. The database schema is designed in a way to store scatter plots and histograms with unlimited number of optional test parameters in additional to a few manda-tory ones.
Figure 1.Components ofGeant-valweb application and flow of data between them.
• A ROOT-based C++plotting utilitywas developed to produce high quality plots. It uses data in the JSON format which has been introduced as main interchange format between all parts of the application. The utility is not deeply integrated in the server infrastructure and can be used as a standalone application. It supports all types of application’s data, can plot histograms with different binning on one canvas, and produce ratio plots. Ranges and scales of plot axes are selected automatically, but can be overriden if necessary.
• TheWeb interfaceis an AngularJS single page application which shows plots with tests results together with statistical analysis. The web page was verified on the most popular mobile and desktop browsers (Firefox, Chromium-based browsers, Safari, Edge).
Each plot on the website can be displayed as a static image produced by plotting utility or as an interactive JSROOT canvas. The latter allows the user to change the range or scale of axes, and the style of the data "on the fly" in the same way as it can be done in ROOT. It is possible to export the plots in PNG, ROOT, EPS, Gnuplot [8]. It is also possible to view JSON representation ofplotobjects corresponding to the displayed distributions.
Access to the test results produced with internal Geant4 releases is restricted to the Geant4 developers authenticated via CERN Single Sign-On. For public Geant4 releases the access is open to anyone.
4 User interface
TheGeant-valwebsite provides two ways of viewing and comparing results:
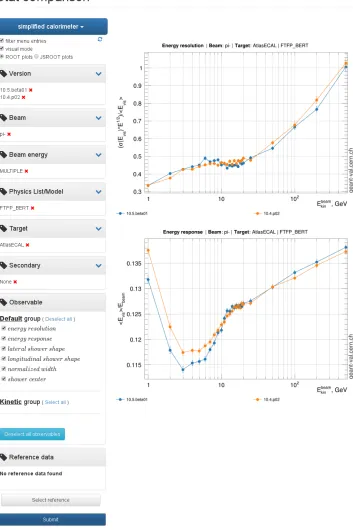
• Statistical comparisonspage allows comparison of simulation with compatible experimen-tal results using a selecton of statistical tests.
cross-checked against the same statistical techniques implemented in the ROOT frame-work (ROOT::TH1::Chi2Test()andROOT:TMath::KolmogorovTest() cor-respondingly).
Results are marked as ”bad”, ”warning” and ”good” depending on χ2 probability, exact ranges for each category can be adjusted by the user. It is also possible to download a PDF file containing the report and all plots.
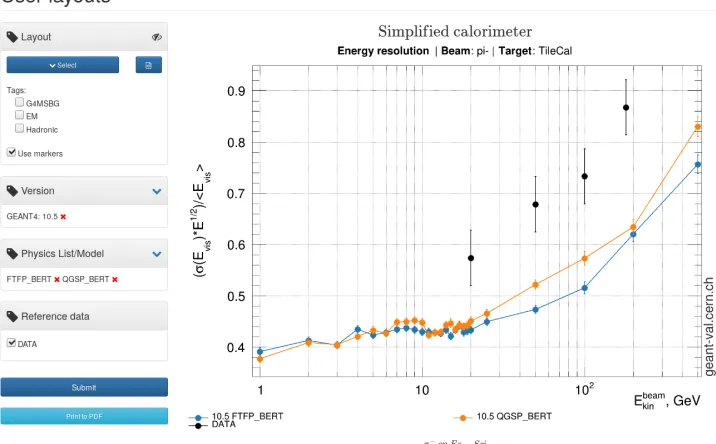
• User layoutspage (see Figure 4). Alayout is an XML file describing what plots should be displayed and how should they be laid out on a page. It can be useful for Geant4 tests that produce hundreds of different plots, but for whose fast "visual" validation it is often enough to compare only a small well-defined subset of them.
The user selects the desired layout, Geant4 version(s), physics list(s) and experimental data. All other plot parameters should be defined inlayoutfile. It allows performing fast visual comparison of several Geant4 versions/physics lists. It is also possible to produce ratio plots to better visualise the differences between different distributions.
Layouts are available "out of the box" for some tests, however users can define and use on their own layout on the website.
5 Conclusion
The Geant-val web application provides an uniform and clear way of performing all stages of physics validation: from creating configuration files and running simulation code to produc-ing and analysproduc-ing final plots.
The web interface allows performing quick visual evaluation of MC-experiment agreement for various combinations of Geant4 versions and physics lists. mc-config-generator’s submission system allows one to easily submit jobs to any supported batch system, and to analyse the produced results.
TheGeant-valweb application is actively used by Geant4 developers in CERN and by Geant4 Medical Simulation Benchmark Group (G4BSMG).
References
[1] S. Agostinelliet al.[GEANT4 Collaboration], Nucl. Instrum. Meth. A506, 250 (2003). doi:10.1016/S0168-9002(03)01368-8
[2] NodeJS is a JavaScript runtime https://nodejs.org/
[3] AngularJS is an MWM JavaScript framework https://angularjs.org/
[4] Rene Brun and Fons Rademakers, ROOT - An Object Oriented Data Analysis Framework, Proceedings AIHENP’96 Workshop, Lausanne, Sep. 1996, Nucl. Inst. & Meth. in Phys. Res. A 389 (1997) 81-86. See also (http://root.cern.ch).
[5] Bertrand Bellenot and Sergey Linev 2015, J. Phys.: Conf. Ser.,664, 062033
[6] Internet Engineering Task Force (IETF) Request for Comments (RFC) 8259 "The JavaScript Object Notation (JSON) Data Interchange Format" https://tools.ietf.org/html/ rfc8259
[7] PostgreSQL is an open-source database https://www.postgresql.org/
cross-checked against the same statistical techniques implemented in the ROOT frame-work (ROOT::TH1::Chi2Test()andROOT:TMath::KolmogorovTest() cor-respondingly).
Results are marked as ”bad”, ”warning” and ”good” depending onχ2 probability, exact ranges for each category can be adjusted by the user. It is also possible to download a PDF file containing the report and all plots.
• User layoutspage (see Figure 4). A layoutis an XML file describing what plots should be displayed and how should they be laid out on a page. It can be useful for Geant4 tests that produce hundreds of different plots, but for whose fast "visual" validation it is often enough to compare only a small well-defined subset of them.
The user selects the desired layout, Geant4 version(s), physics list(s) and experimental data. All other plot parameters should be defined inlayoutfile. It allows performing fast visual comparison of several Geant4 versions/physics lists. It is also possible to produce ratio plots to better visualise the differences between different distributions.
Layouts are available "out of the box" for some tests, however users can define and use on their own layout on the website.
5 Conclusion
The Geant-val web application provides an uniform and clear way of performing all stages of physics validation: from creating configuration files and running simulation code to produc-ing and analysproduc-ing final plots.
The web interface allows performing quick visual evaluation of MC-experiment agreement for various combinations of Geant4 versions and physics lists. mc-config-generator’s submission system allows one to easily submit jobs to any supported batch system, and to analyse the produced results.
TheGeant-valweb application is actively used by Geant4 developers in CERN and by Geant4 Medical Simulation Benchmark Group (G4BSMG).
References
[1] S. Agostinelliet al.[GEANT4 Collaboration], Nucl. Instrum. Meth. A506, 250 (2003). doi:10.1016/S0168-9002(03)01368-8
[2] NodeJS is a JavaScript runtime https://nodejs.org/
[3] AngularJS is an MWM JavaScript framework https://angularjs.org/
[4] Rene Brun and Fons Rademakers, ROOT - An Object Oriented Data Analysis Framework, Proceedings AIHENP’96 Workshop, Lausanne, Sep. 1996, Nucl. Inst. & Meth. in Phys. Res. A 389 (1997) 81-86. See also (http://root.cern.ch).
[5] Bertrand Bellenot and Sergey Linev 2015, J. Phys.: Conf. Ser.,664, 062033
[6] Internet Engineering Task Force (IETF) Request for Comments (RFC) 8259 "The JavaScript Object Notation (JSON) Data Interchange Format" https://tools.ietf.org/html/ rfc8259
[7] PostgreSQL is an open-source database https://www.postgresql.org/
[8] Gnuplot, a portable command-line driven graphing utility http://www.gnuplot.info/
Figure 3. Statistical comparison of "simplified calorimeter" test results between Geant4 releases 10.5.beta01 and 10.4.p02 forπ−beam.