Human self-motion perception
Sensory processing, adaptation
and training
Nadine Hummel
München, 2. September 2016
Dissertation der
Graduate School of Systemic Neurosciences der
Human self-motion perception
Sensory processing, adaptation
and training
Dissertation der
Graduate School of Systemic Neurosciences der
Ludwig-Maximilians-Universität München
Eingereicht von
Nadine Hummel
Supervisor: Dr. Virginia L. Flanagin
2nd Reviewer: Prof. Dr. Hans Straka
Abstract
Every day, we move through the world, walking or driving, uphill or downhill,
on high heels or sneakers, maybe balancing if the street is frozen or
sidestepping people in the crowded pedestrian zone. When we move, our
environment is constantly changing and although it appears easy to us to adapt
to these changes, the performance of our brain in this task is astonishing. A
multitude of signals from different modalities needs to be evaluated and
combined continuously regarding their informative value and matching motor
and cognition responses have to be induced. Knowledge about how this is
achieved is still far from complete. However, approaches come from a number
of different research fields. In this thesis, I present three studies measuring
human performance in, and cortical processes of uni- and multisensory
self-motion perception. In the first study, we evaluated the effect of prior
expectation on our sensory self-motion estimates, in the second study we looked
at the cortical processing of a visual self-motion stimulus and in the third study
we investigated how long-term sensory modifications of self-motion perception
affect brain anatomy. I draw conclusions about how short- and long-term
sensory modifications affect self-motion perception and how these changes can
be explained based on existing theories of multisensory cue integration, and I
present a framework of sensory cue processing during visual self-motion
Overview
This thesis is structured in five chapters. In the first part of the introduction, I
present three sensory systems that closely interact when we are moving through
our environment: Vision, vestibular sensation and somatosensation. I review
theories on their integration and respective calibration. In the second part of the
introduction, I summarize how the human cortex is organized to allow for the
perception and interaction with our environment and I review what we currently
know about the cortical processing of self-motion perception.
In chapters two to four research on these topics is presented in form of two
articles published in peer-reviewed journals (Chapters 2 and 4), and one article
(Chapter 3) prepared for submission.
In the first study (Chapter 2) we explored how important the upright body
position, i.e. the body position we are most used to, is for our ability to estimate
the direction we are moving to, our heading direction. Eleven subjects estimated
their perceived heading directions from visual or vestibular cues and we
evaluated how accuracy and precision differ between upright and supine body
positions. We observed strong vestibular, but almost no visual effects of body
position and draw conclusions about our prior expectation on the direction of
gravity and the reliability of our visual system during heading estimation.
In chapter three we investigated the cortical representation self-motion
direction. In an fMRI study, 26 subjects performed a visual heading
discrimination task and we evaluated the cortical activation patterns during the
estimation of eight different heading directions. We observe sensitivities to the
direction of a self-motion consistent optic flow in all stages of visual and
multisensory cortical processing. We present a theoretical approach on how a
visual self-motion stimulus is processed along the human cortex and identify
different factors of heading encoding.
In chapter four we evaluated the long-term effects of sensory loss and balance
training on brain anatomy. Using diffusion tensor imaging (DTI), we measured
white matter properties of a group of patients suffering from bilateral vestibular
failure, a group of balance trained dancers and slackliners and their respective
anisotropy and an increase in radial diffusivity in both groups. We concluded
that this finding likely is due to an increased amount of fiber crossings in these
regions, representing the strengthening of intersensory and sensorimotor
connections, as a result of the increased demand of balance in both groups.
In the discussion, I review the outcome of the three studies in regard to their
contribution to two major topics of self-motion perception: 1. Its ability to adapt
Contents
1. General Introduction 11
1.1 Sensory systems involved in self-motion perception 13
1.1.1 The visual system 14
1.1.2 The vestibular system 15
1.1.3 The somatosensory system 16
1.2 Multisensory self-motion perception 17
1.2.1 Optimal Bayesian cue integration 18
1.2.2 Sensory cue calibration 19
1.3 The neuronal basis of self-motion perception 20
1.3.1 General cortical stimulus processing 20
1.3.2 Cortical processing of self-motion stimuli 22
1.4. About this thesis 26
2. The effect of supine body position on human heading perception 27
3. The neuronal representation of self-motion consistent, visual
motion directions 41
4. Vestibular loss and balance training cause similar changes
in human cerebral white matter fractional anisotropy 71
5. General discussion 85
5.1 Adapting to a changing environment: Processes of
sensory adaptation and training 87
5.1.1 Immediate effects of sensory input modification 88
5.1.2 Long-term effects of sensory input modification 90
5.2 Estimating the direction of self-motion from optic flow:
Performance and cortical processing 92
5.2.1 Behavioral evidence on visual heading perception 92
5.2.3 Combining behavior and cortical processing 99
5.3 Concluding remarks 100
6. References 103
7. Acknowledgements 111
8. Curriculum Vitae 113
9. Publications 114
10. Eidesstattliche Versicherung / Affidavit 115
CHAPTER 1
12 General introduction
General introduction 13
The human body consists of approximately 650 muscles, 206 bones and around
360 joints. This is a large number, considering that most of the time we are
moving, we do not actively think about how to coordinate every involved
muscle, bone and joint. During walking, running, dancing or balancing, we can
coordinate our body - some more, others less - and adjust its position to our
environment so that our movement looks natural, we avoid obstacles and we do
not fall. Furthermore, we are able to estimate the speed, direction and distance
covered by our motion, and if we are told to walk towards a specific location we
can usually follow the instructions easily. Perceiving how we move through our
environment therefore represents also an essential part of our ability to orient
and navigate. All of our sensory systems work together to continuously provide
us with information about our body and our environment and our brain
evaluates each system's input, combines them to accurate estimates of our
current state and dynamically produces matching motor responses.
To understand the complex mechanisms underlying self-motion perception, we
need to understand every single step of the process. The focus of this thesis will
lie on how we process sensory information about our body position relative to
our environment, how important our different sensory systems are and what
happens if we modify one of them.
1.1 Sensory systems involved in self-motion perception
Practically every sensory system of our body can transfer self-motion specific
information. For example, when we cross a street, our eyes and ears tell us if
there are cars approaching, and our proprioceptive and vestibular systems
control our body position when we walk. Even the distribution of blood in our
body or the smell of our favorite food place across the street, they all can
provide information about our state of self-motion. Here, I would like to
introduce the three systems that are considered the most important for optimal
self-motion perception: Visual, vestibular and somatosensory system, and their
14 General introduction
1.1.1 The visual system
For humans, as well as for many other species, the visual sense dominates over
all other senses. The reason is that the visual system provides the best ratio
between distance and accuracy: Other systems like hearing and smell reach far,
but are often imprecise in source localization, while touch and taste are very
accurate, but only for objects that are in contact with our body. When we move
through the environment, a so-called optic flow is created by our motion, which
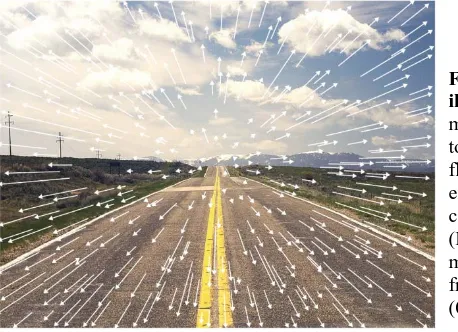
produces a pattern of light on our retinae (Gibson, 1950) (Figure 1). This
motion pattern provides reliable estimates, for example about the direction of
our motion or about the collision probability with surrounding objects, even if
no other sensory input is provided. When we move forward, and look in the
direction of our motion, the optic flow field is a radial motion pattern, with all
objects looming radially from a centered focus of expansion. For forward
motion, the position of this point corresponds to the direction of our self-motion
and can be estimated by evaluating the global motion pattern and local cues of
relative object motion (for a review see Lappe et al., 1999). Behavioral studies
show that the threshold of visually discriminating a heading direction from
straight ahead can be as small as 1.2° (Warren & Hannon, 1988). In the
following chapters I will use the terms 'heading direction' and 'singularity of
flow (SoF)' when referring to the direction of linear self-motion with the gaze
directed at straight ahead, and to the focus of expansion (for forward motion)
and the focus of contraction (for backward motion), respectively.
Figure 1. Optic flow
illustration. When an observer moves forwards, while looking to the same direction, an optic flow is created, with all objects expanding radially from a central focus of expansion (FoE). Image used and
General introduction 15
The use of virtual visual environments, provides an astonishing way to
investigate the visual importance for self-motion perception. Three dimensional
environments can be simulated and presented via head mounted stereo systems,
which sometimes even adapt to head movements. Even if no other sensory input
is provided, a very realistic percept of self-motion through the virtual
environment is created. In the studies described in this thesis, we made use of
such a kind of setup to simulate realistic visual self-motion stimuli.
1.1.2 The vestibular system
The vestibular system, a system that developed specifically to serve balance and
spatial orientation, is located in our two inner ears. It is a twofold system,
consisting of the three semicircular canals for the perception of head rotations,
and the two otolith systems utricle and saccule, which perceive linear body
accelerations and head tilts. The receptors in both systems are hair cells - the
name deriving from the hair bundles that protrude from the apical surface of the
cell. These bundles contain a number of hair-like structures, the stereocilia, and
one longest cilium, the kinocilium. A deflection of the stereocilia in the
direction of the kinocilium, causes a depolarisation of the hair cell, a deflection
in the opposite direction causes a hyperpolarisation of the hair cell, both leading
to a change in the afferent activity. For the semicircular canals, these receptors
are located at the bases of each of the three roughly orthogonal canals. While
the canals are filled with fluid endolymph, the stereocilia of the hair cells stick
into the gelatinous cupula. Head rotations cause the fluid in the canals to move
and push against the cupula, which bends the cilia of the hair cells. In utricle
and saccule, the hair cells sit in a layer of supporting cells, called the maculae.
The cilia reach into a polysaccharide layer, on which little calcium carbonate
crystals, the otoliths ('ear stones'), are mounted. These crystals add weight and
inertia to the membrane, acting as an amplifier of linear forces. When we move,
gravity is always acting on these sensors, which means that the force that
deflects the stereocilia is a combination of gravity and inertia (gravito-inertial
force). The maculae of utricle and saccule are oriented roughly orthogonal to
each other, so that the utricle is maximally sensitive to horizontal translation
16 General introduction
structure of the two systems and the different orientations of the hair cells in the
maculae allow for a 3D perception of different linear accelerations.
The importance of the vestibular system to self-motion perception becomes
apparent from reports of patients suffering from vestibular disorders. They
suffer from balance problems and frequent falls and also have problems in
navigation (e.g. Brandt et al., 2005). The vestibular system also plays an
important role during heading estimation. In macaques, heading discrimination
thresholds in darkness after bilateral labyrinthectomy increase by more than
10-fold (Gu et al., 2007). The precision, i.e. the reliability of the vestibular system,
during a heading estimation task, where subjects need to indicate their heading
direction e.g. with a pointer, is often reported to be lower than that of the visual
system (Butler et al., 2010; Ohmi, 1996; Telford et al., 1995). Vestibular
heading discrimination thresholds, on the other hand, are only slightly higher
than visual heading discrimination thresholds (Butler et al., 2015; Butler et al.,
2010; Gu et al., 2007) and the reported biases for oblique heading directions are
usually much smaller (Crane, 2012; Cuturi & MacNeilage, 2013).
1.1.3. The somatosensory system
The somatosensory system responds to physical contact with the external world
(touch) and monitors the internal state of the body (proprioception). Different
receptor types (mechanical, chemical, thermal, and nociceptors) in e.g. joints,
muscles and tendons transport information about the position of our body and of
different body parts with respect to each other, mostly over three long neurons
to our somatosensory cortex. Somatosensation is particularly relevant for active
self-motion, where proprioceptive information produces quick reflexive
sequences of motor patterns. Its role during passive self-motion should,
however, also not be underestimated. Like the vestibular system, gravitoceptive
information can also be delivered via somatosensory receptors (Mittelstaedt,
1992; Trousselard et al., 2004; Vaitl et al., 2002). While our vestibular system
fails at the task to differentiate between a linear acceleration and a head tilt in
the dark, proprioceptive receptors in our neck provide us with the necessary
information about the relationship between head and body position (for a review
General introduction 17
system to perceive a self-motion is reported to be higher than that of the
vestibular system (Hlavacka et al., 1996; Hlavacka et al., 1992).
1.2 Multisensory self-motion perception
None of our sensory systems are perfect. Depending on the situation, some
systems provide more reliable, others less reliable input. This is why when we
move in real life, we usually are provided not only with one, but with a
multitude of different sensory inputs. Usually, the sum of the multisensory
inputs allows us to give a more precise estimate than each single sensory input
alone (Alais & Burr, 2004; Butler et al., 2010; Ernst & Banks, 2002; Knill &
Saunders, 2003). For example, try balancing on one leg, once with eyes open
and once with eyes closed. The task will be much harder when the visual input
is missing, and we need to rely only on vestibular and proprioceptive
information.
How close our different sensory systems are connected becomes apparent, for
example, if we sit on a train in the station and the train next to us starts moving.
Although neither vestibular nor somatosensory motion cues exist, the visual cue
produces a vestibular sensation, so that we feel as if we were moving. This
phenomenon is known as 'vection' (Brandt et al., 1972; Mach, 1875), and
reveals a close visuo-vestibular connection. Similarly, if we tilt the head to one
side, vertical objects might appear tilted to the other side (Aubert, 1861). This
'Aubert-effect', named after the researcher who first described it, is caused by
the close connection between graviceptive and visual systems (Mittelstaedt,
1983). Also, if an apparent conflict between visual and vestibular cues exist,
like for example when we read a book in a driving car, our body might react
with motion sickness (for a review see Bertolini & Straumann, 2016).
When we receive input from different sensory systems during a self-motion, our
brain evaluates and weighs each sensory cue, and then integrates them,
according to their respective reliability. The performance of our brain in this
process becomes even more astonishing, when we consider the flexibility with
which it can adapt to changing conditions. These changes can happen
18 General introduction
but then regain balance over our body, or they can happen over longer periods
of time, for example after losing one sense through a disease, or an accident:
Patients with vestibular disorders, for example, suffer from imbalance and falls
in the beginning, but can learn over months and years to rely more on visual and
proprioceptive cues to regain their balance (Hillier & McDonnell, 2011; Krebs
et al., 1993).
In this chapter I would like to present two mechanisms that allow us to succeed
in these tasks: Sensory cue integration and sensory cue calibration. These two
mechanisms are closely related, and each is essential for a statistically optimal
self-motion perception. Sensory cue integration describes the process of
combining different sensory cues to a more precise, combined estimate, while
sensory cue calibration refers to the calibration of each single sensory system in
order to gain accurate unisensory estimates.
1.2.1 Optimal Bayesian cue integration
Precision during a self-motion task, like heading discrimination, is higher if two
sensory inputs are provided simultaneously than if provided separately (Butler
et al., 2010). Evidence is growing, that during self-motion perception as well as
during many other processes of multisensory perception, our brain integrates
different sensory estimates in a Bayesian optimal way (e.g. Alais & Burr, 2004;
de Winkel et al., 2013; Ernst & Banks, 2002; Fetsch et al., 2009; Knill &
Pouget, 2004).
When we want to estimate a specific state, for example our current body
position, we receive information from our different sensory systems, e.g. our
eyes tell us about the orientation of objects in our environment, which we can
use as a reference, our vestibular system provides information about the
position of our head relative to gravity, and our proprioceptive system tells us
how certain body parts are located in respect to each other. Each of these inputs
has a certain reliability, or precision, that depends on the situation, for example
in darkness, our vision might be less reliable, while it is a very dominant cue
under different circumstances. Further, each sensory input underlies
independent Gaussian noise. With this information we can set up probability
General introduction 19
of the state given this sensory input. If the single sensory estimates are
independent of each other, they can be combined according to a linear cue
combination strategy, i.e. by calculating the weighted average of all estimates
(Cochran, 1937; Landy et al., 1995).
While this cue combination strategy alone usually suffices to describe our
behavior in well controlled experimental setups, it often fails to describe human
behavior in real life. This is because apart from the current sensory input, our
decisions rely heavily on our previous experience, knowledge and memories.
For example, when we estimate our body position, we tend to judge it biased
towards upright, because we are used to upright positions in everyday life
(Mittelstaedt, 1983). In Bayes theory, this so called 'prior' distribution is
combined with the state likelihood estimated from our current sensory input to
create a 'posterior' distribution that then becomes the new prior and can be
further updated by new sensory input.
In mathematical terms, this relationship is formulated as
P(A|B) = P(B|A) P(A) / P(B)
where A is the state that we want to estimate, and B is the given sensory input.
P(A|B) describes the posterior distribution, that is estimated from the product of
likelihood P(A|B) and prior distribution P(A). The term P(B) describes a
normalizing constant term, scaling the probabilities over all possible states to
sum up to one.
1.2.2 Sensory cue calibration
In regard to multisensory perception, we need to distinguish between sensory
precision, and sensory accuracy. While the precision of a sensory system
describes the variability of sensory estimates, and thus the reliability of the
sensory cue, the accuracy of a cue describes how exact the sensory input
describes a specific state. According to the principle of linear cue combination,
the highest weight is assigned to the most reliable input. If this input is, for
some reason, defective or biased, the combined estimate will be shifted
20 General introduction
integrate different sensory cues develops only late in adolescence, suggesting
that our sensory systems are calibrated first to ensure possibly accurate
estimates of each sensory system (Gori et al., 2008; Nardini et al., 2008).
However, also during adulthood calibration mechanisms still exist (Zaidel et al.,
2013; Zaidel et al., 2011). Internal (e.g. in form of another sensory estimate that
serves as comparison) or external (e.g. somebody telling us how accurate we
are) feedback allows us to estimate the accuracy of our sensory estimate and to
adjust it accordingly. For example, if two reliable systems provide conflicting
sensory estimates, the estimates will adapt towards each other in a fixed-ratio
attitude (Zaidel et al., 2011).
In order to fully understand multisensory perception, it is thus important that we
understand how accurate and precise each contributing sensory system is, and
how these factors change when combined. Also it is interesting, how the
systems adapt to manipulations, e.g. how does the modification of one sensory
input affect the accuracy and precision of this system, and how does it affect the
estimates of another system? Some of these points will be addressed in this
thesis.
1.3 The neuronal basis of self-motion perception
In the previous chapters, I described the sensory systems and the basic
principles of self-motion perception. In this chapter I would like to introduce the
neuronal mechanisms that underlie these processes. Knowledge about how
self-motion is processed in our brain is still far from complete, but has been studied
extensively over the last years. In this chapter, I would like to first provide a
rough overview about the general cortical processing of multisensory input,
before I go more into the cortical processing specifically related to self-motion
perception.
1.3.1 General cortical stimulus processing
Uni- and multisensory input reaches the cortex through the thalamus. In the
General introduction 21
visual and somatosensory cues, is first projected to unimodal primary and
association cortices, dedicated exclusively to the input of these specific
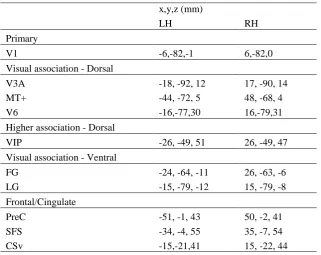
modalities. Figure 2 shows an example processing of a visual and a
somatosensory stimulus through the cortex, according to this classical view.
Figure 2. Primary sensory cortices (solid colors), association cortices (faded colors) and higher order association cortices (grey). This figure illustrates an example pathway of a visual and a somatosensory cue through the cortex. Both cues are first processed in their respective primary cortices, then forwarded to association cortices, where more complex unisensory associations occur. In higher order association cortices the preprocessed cues of all sensory modalities can be combined and the output is projected to areas of cognition and motor control. From here, top-down processes create matching motor responses. Image produced based on data from http://www.indiana.edu (06/08/2016 10:35AM)
Somatosensory (S1) and visual (V1) primary cortices first map very basic
characteristics of the respective sensory stimulus: V1 provides a retinotopic
map, which means the image that is depicted on our retinae is projected in a
similar way on our primary visual cortex, all information of the right visual
field onto the left hemisphere and all information of the left visual field onto the
right hemisphere. Similarly, the somatosensory map of S1, the so called
homunculus, represents sensitivities of our whole body surface to touch. The
sensory information is then further processed in secondary and higher
unisensory association cortices. These cortices are highly developed in humans
22 General introduction
recognizing objects or their spatial relationship. In the next step, the
preprocessed unimodal information is then transported to higher association
areas, which receive multisensory input. These areas finally carry out the actual
cue integration and forward the output to areas of motor control, decision
making and memory to create matching motor and behavioral responses. More
recent findings further suggest that multisensory processes can be observed
already on the level of primary sensory cortices (Kayser & Logothetis, 2007).
1.3.2. Cortical processing of self-motion stimuli
While the performance of self-motion perception can be tested relatively easy,
e.g. by asking 'What was your self-motion direction?', exploring the underlying
cortical processes constitutes a much harder task. Observing the healthy human
brain in action is possible nowadays, but faces certain limitations. For example,
the resolution of an fMRI scanner is too low to measure neuronal responses, as
one functional voxel comprises around 630,000 neurons1. This limitation has been tackled recently by developing new evaluation methods, such as
multi-variate pattern analysis (MVPA, Haxby et al., 2001). This approach is not
limited to the voxel-level, because it evaluates patterns of voxel intensity
instead of single-voxel activation levels. It has been claimed that MVPA allows
for the detection of neuronal firing patterns within cortical visual orientation
columns (Kamitani & Tong, 2005). Although this claim is still discussed
(Freeman et al., 2011; Pratte et al., 2016), general consensus exists that MVPA
allows for the detection of more subtle differences across conditions than
classical evaluation approaches (Haxby et al., 2014). Measuring cortical
activations specifically during the perception of a self-motion with fMRI, faces
two further limitations. First, subjects in the fMRI scanner should move as little
as possible, to avoid motion artifacts in the data. This obviously makes it
difficult to measure self-motion perception. Second, the supine body position
required during fMRI data acquisition could interfere with our prior experience
of moving in upright positions. The relevance of this latter problem is explored
in the first study of this thesis, described in chapter 2. To address the problem of
motion suppression in the scanner, most fMRI studies on human self-motion
General introduction 23
perception use visual stimuli to simulate an egomotion. This approach provides
several advantages 1) The visual sense is our dominant sense, and highly
important for self-motion perception, thus it is likely that areas that process
visual self-motion stimuli are also involved in 'real' self-motion perception. 2)
The visual sense is the best investigated of all senses. 3) Compared to other
sensory systems, it is uncomplicated to create visual self-motion stimuli and
present them in the fMRI scanner. 4) Certain factors of self-motion, like the
estimation of a heading direction, can be done very accurately only from visual
input and do not necessarily need other sensory estimates, and 5) Visual
perception can induce an actual percept of self-motion, called vection. This
opens up the possibility to investigate visual-vestibular integration using
unimodal stimulation.
Although the use of functional imaging methods to investigate human
self-motion perception is promising, knowledge from other fields is highly valuable
to create a common understanding of how we perceive self-motion.
Electrophysiological single cell recordings in non-human primates, for example,
provide relevant information on neuronal firing patterns. In particular the
neuronal responses to self-motion stimuli within the occipito-temporal visual
motion areas MT/V5 and MST have been explored extensively (e.g. Albright,
1989; Duffy & Wurtz, 1991a; Duffy & Wurtz, 1991b, 1995; Gu et al., 2008; Gu
et al., 2007; Tanaka et al., 1986). On the other hand, reports from brain lesion
studies reveal interesting insights into the function and importance of specific
brain regions (Vaina, 1998; Vaina & Rushton, 2000; Vaina & Soloviev, 2004).
For example, patients with occipito-parietal lesions perform well on low-level
motion tasks, such as discriminating different object motion directions, but fail
in higher-level motion tasks, like heading estimation. Patients with occipital
lobe lesions show impairments in low-level motion tasks, but retain their ability
to judge heading direction relative to a target. This suggests mechanisms of
heading estimation in occipito-parietal regions, which do not necessarily depend
on low-level motion estimates (Vaina, 1998).
A number of different brain regions has been suggested in the last years, which
show characteristics making them highly interesting regarding their possible
roles in self-motion perception. Most of these regions are primarily visual
24 General introduction
large receptive fields, making them suitable for the evaluation of the global flow
pattern of a retinal optic flow. Characteristic aspects of visual self-motion have
been investigated in these and other regions to create a concept of cortical
self-motion processing. For example, it was tested which regions differentiate
between coherent and random patterns of object motion (de Jong et al., 1994),
assuming that self-motion always creates coherent motion patterns. These
findings were further refined by distinguishing different kinds of coherent
motion: a self-motion consistent pattern, with only one SoF, was contrasted
against a self-motion inconsistent pattern, with multiple SoFs (Cardin & Smith,
2010; Wall & Smith, 2008), different components of coherent flow stimuli
(radial, circular, planar) were distinguished (Holliday & Meese, 2005, 2008;
Morrone et al., 2000; Pitzalis et al., 2013), different SoF positions were
compared (Cardin, Hemsworth, et al., 2012; Furlan et al., 2014), and the
influence of vection during visual stimulation was investigated (Brandt et al.,
1998; Brandt et al., 2002; Deutschlander et al., 2004; Kleinschmidt et al., 2002;
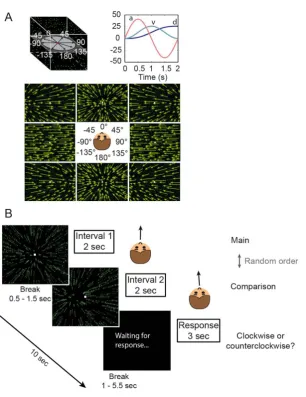
Kovacs et al., 2008; Wada et al., 2016). Table 1 shows recently discussed areas
and the most important findings on motion- and self-motion sensitivity in these
areas.
Together with what we learned in the previous chapters, these findings suggest
that the cortical processing of human self-motion perception includes a large
network of unimodal and multimodal pathways of processing. Both unimodal
and multimodal areas seem to be important for the evaluation of a specific
self-motion state, however, our knowledge is still far from complete regarding the
General introduction 25
Table 1. Summary of regions responding to visual motion and their functions regarding visual motion evaluation
Visual association, dorsal stream
V3A - direction discrimination (Cornette et al., 1998)
- complex flow evaluation (Cardin, Hemsworth, et al., 2012) V5/MT (middle temporal
area) - SoF position (Cardin, Hemsworth, et al., 2012) - heading task > dimming task (Peuskens et al., 2001)
- coherent > incoherent (Holliday & Meese, 2008; Morrone et al., 2000) - expansion > other transverse flow directions (Albright, 1989) - direction (Van Essen et al., 1981)
MST (medial superior
temporal area) - SoF position (Page & Duffy, 1999)(Duffy 1999) - flow components (Saito et al., 1986; Tanaka & Saito, 1989)
- direction (Desimone & Ungerleider, 1986) - expansion, contraction, rotation (Saito et al., 1986) - speed (Tanaka & Saito, 1989)
- multisensory (Page & Duffy, 2003)
V6 - EC > EI (Cardin & Smith, 2010)
- flow components (Pitzalis et al., 2013)
- stereoscopic depth (Arnoldussen et al., 2013; Cardin & Smith, 2011) - vection (Uesaki & Ashida, 2015; Wada et al., 2016)
- coherent > random > static (Wada et al., 2016) - stimulus size (Wada et al., 2016)
Visual association, ventral stream
LG (lingual gyrus) - speed (Orban et al., 1998)
FG (fusiform gyrus) - temporal comparison (Cornette et al., 1998; Orban et al., 1998)
- expansion > random (de Jong et al., 1994) Posterior parietal cortex
VIP (ventral intraparietal
area) - SoF position (Bremmer, Duhamel, et al., 2002) - EC > EI (Wall & Smith, 2008)
- flow components (Bremmer, Duhamel, et al., 2002) - multisensory (Bremmer, Klam, et al., 2002) - vection (Uesaki & Ashida, 2015)
PcM (precuneus motion
area) - first described by Cardin & Smith 2010: EC > EI (Cardin & Smith, 2010) - vection (Wada et al., 2016)
- stimulus size (Wada et al., 2016)
- coherent > Random > Static (Wada et al., 2016) DIPSM/L (medial/lateral
dorsal intraparietal sulcus)
- vection (Kovacs et al., 2008) - coherent > static (Kovacs et al., 2008) - heading vs. dimming task (Peuskens et al., 2001) POIPS (parieto-occipital
intraparietal sulcus) - vection (Kovacs et al., 2008) - coherent > incoherent > static (Kovacs et al., 2008)
Higher cortices
CsV (cingulate sulcus
visual area) - EC > EI (Wall & Smith, 2008) - changes in SoF position (Furlan et al., 2014)
- vection (Wada et al., 2016)
- coherent > static > random (Wada et al., 2016) - stereoscopic depth (Arnoldussen et al., 2013) PIVC (parieto- insular
vestibular cortex) - vection (Brandt et al., 1998; Uesaki & Ashida, 2015) - multisensory, primarily vestibular (Brandt et al., 1998; Grusser et al., 1990)
p2v (putative area 2v) - multisensory, primarily vestibular (Cardin & Smith, 2010; Guldin & Grusser, 1998)
- EC > EI (Cardin & Smith, 2010)
FEF (frontal eye fields) - multisensory heading sensitivity (Gu et al., 2015)
- expansion > other transverse flow directions (Xiao et al., 2006) - active heading task > dimming task (Peuskens et al., 2001)
26 General introduction
1.4. About this thesis
We have seen that self-motion perception is a highly dynamic process, where
different sensory systems continuously adapt to changes in the environment and
are tightly connected to each other. Further, approaches to identify the cortical
basis of self-motion perception were described. The studies described in the
following three chapters of this thesis address these topics in different ways.
In the first study we chose the task of heading direction discrimination to
explore the accuracy and precision of the visual and the vestibular system in this
specific task. We then looked at how a sensory modification in form of a change
to a supine body position affects the perception of the unisensory cues. This
approach allows us, on the one hand, to estimate how important the upright
body position is for our everyday motion. On the other hand it reveals
interactions between the visual and the vestibular system, that might exist, even
if no task-related feedback can be exchanged between the two systems. This
study additionally provided the basis for our second study, by testing the
feasibility of showing visual self-motion stimuli to supine subjects during fMRI.
In the second study, we explored cortical activation patterns during a visual
heading discrimination task. We used univariate and multivariate data
evaluation methods in order to identify cortical sensitivites to the direction of a
self-motion consistent optic flow. We further evaluated which regions are
sensitive to the pattern of the flow that is determined by the position of the SoF,
and which regions show a sensitivity to the temporal sequence of the pattern,
i.e. if the motion is to the left or to the right, forwards or backwards,
independent of the SoF position. We hoped to gain knowledge about the cortical
processes underlying the estimation of our heading direction from optic flow.
While the first two studies refer to performance and neuronal processing of a
specific self-motion task, and the first study evaluates short-time effects of
multisensory adaptation and interaction, the last study looks at a more general
aspect of self-motion perception and the long-term effects of multisensory
adaption and interaction. We compared patients that suffered from bilateral
vestibular loss, normal control subjects, and subjects trained in a balance sport
(e.g. ballet) to evaluate how the different distributions of visual, vestibular and
CHAPTER 2
The effect of supine body position
Author contributions
P.R.M. and V.L.F. conceptualized the study
N.H., L.F.C., P.R.M. and V.L.F. designed the study
N.H. programmed the visual stimuli
L.F.C. and P.R.M programmed the vestibular stimuli
N.H. and L.F.C. conducted the experiments
N.H. analyzed the data
N.H., P.R.M. and V.L.F. interpreted the data
N.H. wrote the manuscript
L.F.C., P.R.M. and V.L.F. critically revised the manuscript
The effect of supine body position on human heading
perception
Nadine Hummel
#
$
German Center for Vertigo and Balance Disorders, LMU University Hospital, Campus Großhadern, Munich, Germany Graduate School of Systemic Neurosciences, Ludwig-Maximilians University, Planegg-Martinsried, Germany
Luigi F. Cuturi
#
$
German Center for Vertigo and Balance Disorders, LMU University Hospital, Campus Großhadern, Munich, Germany Graduate School of Systemic Neurosciences, Ludwig-Maximilians University, Planegg-Martinsried, Germany Present address: Unit for Visually Impaired People, Fondazione Instituto Italiano di Tecnologia, Genoa, Italy
Paul R. MacNeilage
#
$
German Center for Vertigo and Balance Disorders, LMU University Hospital, Campus Großhadern, Munich, Germany Graduate School of Systemic Neurosciences, Ludwig-Maximilians University, Planegg-Martinsried, Germany
Virginia L. Flanagin
#
$
German Center for Vertigo and Balance Disorders, LMU University Hospital, Campus Großhadern, Munich, Germany Graduate School of Systemic Neurosciences, Ludwig-Maximilians University, Planegg-Martinsried, Germany
The use of virtual environments in functional imaging experiments is a promising method to investigate and understand the neural basis of human navigation and self-motion perception. However, the supine position in the fMRI scanner is unnatural for everyday motion. In particular, the head-horizontal self-motion plane is parallel rather than perpendicular to gravity. Earlier studies have shown that perception of heading from visual self-motion stimuli, such as optic flow, can be modified due to visuo-vestibular interactions. With this study, we aimed to identify the effects of the supine body position on visual heading estimation, which is a basic component of human navigation. Visual and vestibular heading judgments were measured separately in 11 healthy subjects in upright and supine body positions. We measured two planes of self-motion, the transverse and the coronal plane, and found that, although vestibular heading perception was strongly
modified in a supine position, visual performance, in particular for the preferred head-horizontal (i.e., transverse) plane, did not change. This provides
behavioral evidence in humans that direction estimation from self-motion consistent optic flow is not modified by supine body orientation, demonstrating that visual heading estimation is one component of human navigation that is not influenced by the supine body position required for functional brain imaging experiments.
Introduction
The use of virtual environments in combination with functional brain imaging provides an important
meth-Citation: Hummel, N., Cuturi, L. F., MacNeilage, P. R., & Flanagin, V. L. (2016). The effect of supine body position on human heading perception.Journal of Vision,16(3):19, 1–11, doi:10.1167/16.3.19.
Journal of Vision(2016) 16(3):19, 1–11 1
doi: 1 0 . 11 6 7 / 1 6 . 3 . 1 9 Received July 22, 2015; published February 18, 2016 ISSN 1534-7362
odological tool for understanding human spatial navigation and self-motion perception. Because fMRI does not allow for actual physical movement, these studies rely on visual stimulation to simulate self-motion (e.g., Cardin & Smith,2010; Kovacs, Raabe, & Greenlee, 2008; Wall & Smith, 2008). The visual input is usually provided in the form of a self-motion consistent optic flow stimulus, from which the direc-tion, speed, and duration of self-motion can be successfully estimated (Bremmer & Lappe, 1999; Gibson, 1950; Warren & Hannon, 1988).
One assumption inherent to performing these tasks during fMRI is that perceptual performance is com-parable between upright and supine body positions. However, the differing vestibular and proprioceptive signals between upright and supine body positions may modify heading perception. We are not accustomed to move in a supine body position, and this prior
experience could lead to differential performance between upright and supine postures. Such differential performance may generalize for heading perception across both visual and vestibular modalities. Alterna-tively, effects of body orientation on heading percep-tion may depend on modality. For the vestibular system, a change in body orientation amounts to changing the direction of the static gravitational stimulus, which could directly impact low-level pro-cessing of dynamic vestibular heading stimuli. In contrast, low-level visual processing will be unaffected by the direction of the static gravitational vestibular stimulus. To determine whether effects of body
orientation on heading perception are modality-specif-ic, it is necessary to measure and compare heading perception across modalities.
In an upright body position, humans show system-atic biases when estimating heading directions from optic flow (Crane,2012; Cuturi & MacNeilage, 2013). These biases have been ascribed to a neuronal
preference for lateral motion. When the same visual stimuli are rendered to subjects in a supine body position, multisensory interactions may prompt the interpretation of movement in the earth vertical plane because nonvisual sensory signals indicate that subjects are lying on their back. Could this affect the
appearance of the visual heading biases?
On a neuronal level, visual and vestibular signals are combined relatively early in sensory processing path-ways (Dichgans, Diener, & Brandt,1974; Gu, De-Angelis, & Angelaki, 2007), suggesting a close interdependence between visual and vestibular pro-cessing. Body tilts away from upright lead to decreased reliability of vestibular sensory estimates (Graybiel & Patterson, 1955; Quix, 1925), causing a reweighting of other sensory inputs, including vision (Dichgans et al., 1974; Fetsch, Turner, DeAngelis, & Angelaki, 2009). This can lead to modifications in visual perception, for
example, in the perception of the orientation of lines or objects (Aubert, 1861; Mikellidou, Cicchini, Thomp-son, & Burr, 2015). The perception of the own body and its orientation relative to extrapersonal space is created by a combination of vision, body position, and gravity (Dyde, Jenkin, Jenkin, Zacher, & Harris, 2009; Harris, Herpers, Hofhammer, & Jenkin, 2014). In a supine body position, the direction of gravity in relation to the body changes, causing a shift in the perceptual upright that could also affect visual motion perception. Varying the body position can lead to systematic biases in estimating the direction of forward movements relative to the horizon from optic flow (Bourrelly, Vercher, & Bringoux, 2010) and increase the threshold of vestibular as well as visual heading direction discrimination close to straight ahead (Mac-Neilage, Banks, DeAngelis, & Angelaki, 2010). Simi-larly, effects of body orientation have been found for distance estimation (Harris & Mander, 2014) and the sensation of vection (i.e., the illusory perception of self-motion that develops during prolonged viewing of optic flow) (Kano, 1991; Thilo, Guerraz, Bronstein, & Gresty, 2002).
The aim of this study was to investigate the influence of the supine body position on visual heading
estimation performance in humans. For comparison purposes, we also acquired supine and upright vestib-ular heading performance as a behavioral measure for the effect of a supine body position on vestibular perception. Biases and variability in heading estimation were compared between upright and supine body positions as a measure of performance and uncertainty. Because heading perception depends strongly on the stimulus type (Fetsch et al., 2009), motion plane (Crane, 2014a; MacNeilage et al., 2010), and heading angle (Crane, 2012; Cuturi & MacNeilage, 2013), we chose a paradigm that covered different factor combi-nations of visual and vestibular stimulation, transverse and coronal stimulus planes, and 24 heading angles within each plane. We expected stronger biases and larger errors in both visual and vestibular heading estimation in the supine position than in the upright position because human self-motion systems are most specialized for processing heading with upright posture.
Methods
Subjects
Eleven subjects (five females), mean age 27.55, range 24–32 years, participated in the study. They had normal or corrected-to-normal vision and no history of neurological disorders. All subjects gave written informed consent to participate in the study, which was
Journal of Vision(2016) 16(3):19, 1–11 Hummel, Cuturi, MacNeilage, & Flanagin 2
approved by the ethics committee of the medical faculty of the Ludwig Maximilians University and performed in accordance with the Declaration of Helsinki.
Stimuli
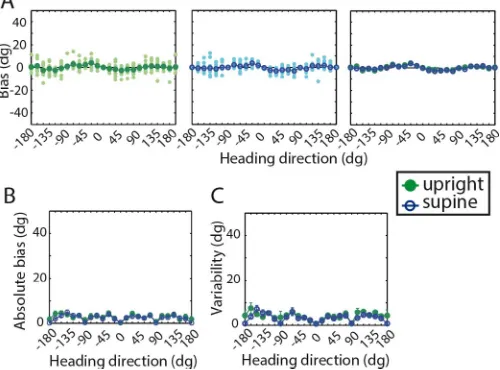
Stimuli were either visual (optic flow) or vestibular (passive acceleration/deceleration) with identical stim-ulus profiles for both types of stimulation. One stimstim-ulus profile lasted 2 s and represented a linear translation in one of 24 directions. All translations had a sinusoidal acceleration profile with a total displacement of 26 cm, a peak velocity of 26 cm/s, and a peak acceleration/ deceleration of 41 cm/s2 (Figure 1). Translational motion can be described in world-centered, i.e., earth-horizontal or earth-vertical, or body-centered coordi-nates, i.e., sagittal, coronal, and transverse. However, previous research has shown that heading discrimina-tion is influenced by changes in the stimulus plane in body-centered and not world-centered coordinates (MacNeilage et al., 2010). Therefore, we refer to the two stimulus planes in the present study with respect to
body coordinates as transverse and coronal transla-tions (Figure 1). Body-centered optic flow stimulus planes also correspond to the same physical stimulus projected onto the head mounted display (HMD), see Visual stimuli; therefore, we define stimulus planes in body-centered coordinates in this study. Both visual and vestibular heading estimation were tested in each stimulus plane in both an upright and a supine body position.
For each plane, we tested 24 heading directions covering the whole plane in 158 steps, i.e., 08, 158, 308, 458, etc. All directions are labeled in relation to 08 or straight ahead/upward such that left (counterclockwise) heading directions are negative (158 to1658) and right (clockwise) directions are positive (158 to 1658, Figure 1). All trials took place in a darkened room, and in the vestibular condition, subjects were additionally instructed to close their eyes during stimulus presenta-tion. Acoustic white noise was played over headphones during stimulus presentation to eliminate auditory self-motion cues. In the upright position, the subject sat in a racing chair; his or her head was positioned against a form-fitting vacuum headrest, and a headband fixated the forehead to the chair. In the supine position, the subject was placed on a form-fitting vacuum mattress, and forehead, body, and legs were fixated with mattress belts.
Visual stimuli
Three-dimensional optic flow stimuli were created in Matlab (The Mathworks Inc., Version R2009b) using the OpenGL library and Psychtoolbox-3 (Brainard,
1997). Stimuli were rendered on a head-mounted stereo display (HMZ-T2, Sony Corporation) with a binocular horizontal field of view of 458, a display resolution of 1,2803720 pixels and a refresh rate of 60 Hz. Stimuli simulated linear transitions through a cloud of
randomly placed triangles. For stimulus creation, 13,366 green, two-dimensional, frontoparallel triangles (base and height 0.5 cm) were placed at a density of 0.04 triangles/cm3 in a black rectangular room with a three-dimensional volume of 122.303170.763210 cm3 (height, width, depth). The near and far clipping planes were at 50 cm and 400 cm, respectively.
Vestibular stimuli
Vestibular stimuli were delivered by a six-degree-of-freedom motion platform (MoogÓ6DOF2000E). Subjects were placed, either seated (upright position) or lying (supine) on the platform. The subject was then moved passively in one of the directions described above following the motion profile described above. After response collection, the platform moved to the origin that was required for the next trial.
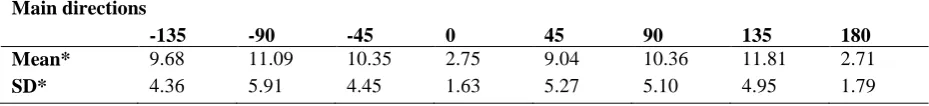
Figure 1. Experimental procedure, conditions, and nomencla-ture. During the experiment, all combinations of the three factors, body position (supine/upright), stimulus type (visual/ vestibular), and stimulus plane (transverse/coronal), were tested. The stimulus profile (lower left corner) shows acceler-ation in cm/s2(a), velocity in cm/s (v), and displacement in cm (d) during the 2-s stimuli for both optic flow and platform motion. Twenty-four heading directions (lower row, center) were presented in the coronal and the transverse plane, respectively (six repetitions). Zero degrees corresponded to a movement straight forward or upward. Negative heading directions refer to leftward self-motion, positive heading directions to rightward self-motion. After each stimulus, the response screen (lower right corner) was shown. Subjects estimated their perceived heading direction by moving the arrow around the dial via button press.
Journal of Vision(2016) 16(3):19, 1–11 Hummel, Cuturi, MacNeilage, & Flanagin 3
Experimental procedure
The procedure was identical in all trials: After an acoustic signal, subjects started the trial via button press. The heading stimulus was presented, and afterward, subjects indicated the perceived heading direction by adjusting the orientation of an arrow on the screen via button press. The arrow was presented within a white circle on a black background (Figure 1). Four buttons allowed for rough adjustments of 28 and fine adjustments of 0.28 per registered key press. Subjects confirmed their estimate by pressing a different button. Haptic cues on the buttons allowed subjects to distinguish all five buttons without visual feedback, and subjects quickly learned the positions of the buttons without seeing them.
The experiment was performed over 4 days, and stimuli were presented block-wise with four blocks per day. Each block consisted of 74 trials. Within one block, only one stimulus type (visual or vestibular), one body orientation (upright or supine), and one stimulus plane (coronal or transverse) was presented. This means, three (of, in total, six) repetitions of the 24 heading directions of one specific condition were presented in random order. Within the same day, stimulus type and body orientation never changed, but two blocks of each stimulus plane were acquired. The order of presentation of stimulus type, body orienta-tion, and stimulus plane was counterbalanced across subjects. Before a new condition began, subjects received 10 training trials that accustomed them to the new condition.
Feedback as to subject’s performance was only given during the 10 training trials. This was done primarily to ensure that subjects were not judging object motion in the visual heading conditions, which would lead to errors of;1808 (see also Crane,2012; Cuturi & MacNeilage, 2013). Despite training, subjects occa-sionally judged object motion instead of self-motion, leading to large errors that are unrelated to the perceptual biases under investigation. Therefore, a deviation of more than 908 from the target angle was considered an erroneous estimate of subjective heading (see also Crane, 2012; Cuturi & MacNeilage, 2013). This was the case in 54 out of 6,336 visual trials (0.85%). These trials were identified immediately, recollected at a later time within the same block, and excluded from further analysis.
Control condition for response bias
Response collection methods may lead to systematic differences between the intended and indicated heading direction. As our response dial was slightly different than what has been used in the past (Cuturi & MacNeilage,2013), we performed two additional
blocks in which we measured heading estimation for ‘‘written’’ directions, similar to the spoken condition in Crane’s (2012) study. Instead of presenting a motion stimulus, the actual direction was presented as a written number on the screen, e.g., ‘‘458.’’ Using this measure helped us to identify to what extent responses given by subjects were biased by their interpretation of the angles on the response device. For example, subjects may not be able to set the line accurately to 458
although, if asked what visual or vestibular heading angle they received, they would respond ‘‘458.’’ For this control experiment, six repetitions of each direction were acquired, again with 158spacing, once in a supine and once in an upright body orientation. To ensure that the additional knowledge of stimulus magnitude did not affect heading estimation, the control experiment was always performed after the main experiment. Subjects were informed about the relationship between each written value and its relative location within the circle prior to performing the task.
Analysis
The error between the response direction and the actual heading direction was extracted from each trial by subtracting the final position of the arrow within the dial in each trial from the presented heading direction, resulting in the heading bias (Crane, 2012; Cuturi & MacNeilage, 2013). Additionally, we calculated abso-lute bias to obtain a measure of the magnitude of the heading bias, independent of its direction. This is convenient, for example, for comparing accuracy of heading perception across body orientations. In addi-tion, variability was calculated as the standard devia-tion of the bias across the six repetidevia-tions.
We performed a 2324 repeated-measures (rm-)ANOVA with factors body orientation (up-right/supine) and heading direction (24 directions per plane) for each of the three measures in each stimulus plane for visual stimuli as well as for vestibular stimuli and for the written control condition. If significant interactions between body orientation and heading direction were found (i.e., p ,0.05), we evaluated the differences by calculating paired ttests for each heading direction.
Results
In this study, we compared visual heading estimation for upright and supine body positions to test whether the change in vestibular sensory information (i.e., the direction of gravity in head coordinates) influences optic flow–based heading perception. We also tested
Journal of Vision(2016) 16(3):19, 1–11 Hummel, Cuturi, MacNeilage, & Flanagin 4
vestibular heading estimation performance in both body positions to estimate the change in vestibular heading perception induced by a change in body orientation.
The rm-ANOVAs revealed a main effect of heading direction for all conditions, consistent with what has been shown previously in an upright position (Crane,
2012, 2014a; Cuturi & MacNeilage, 2013). However, because we were interested in the effects of body orientation, we have focused the results on the main effect of body orientation and the interactions with heading direction. The results of the rm-ANOVAs are summarized in Table 1.
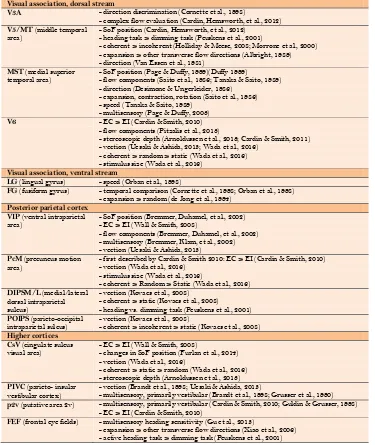
Visual heading perception
Similar heading biases were found between upright (Figure 2A, green) and supine (Figure 2A, blue) body positions using optic flow. This was true in both the transverse and coronal stimulus planes although heading bias showed a very different pattern between stimulus planes. For transverse stimuli, no main effect of body position or interaction between body position and heading direction was found. For stimuli in the coronal plane, a weak main effect of body position existed,F(23, 230)¼5.50,p¼0.041, but no interaction,
F(23, 230)¼1.21,p¼0.24. Inspection revealed that this effect is due to a small offset between supine and upright heading estimates. Biases were in general more positive (i.e., clockwise) when subjects were sitting than when they were lying on their back.
This offset was not correlated to the effects of body position we measured for vestibular heading perception in the same stimulus plane (r¼ 0.019,p¼0.76). It could also not be explained by differences in the absolute bias or variability. Both of these variables showed no main effect of body position (Figure 2B, C), suggesting that the bias offset is neither caused by a change in the subjects’ uncertainty about heading direction nor by generally greater or smaller errors. Bias variability showed a significant interaction be-tween body position and heading direction for both stimulus planes. The interaction was due to a difference in bias variability between upright and supine body position for individual heading directions (Figure 2C), but no consistent pattern of significance across similar heading directions was found that could explain the general offset in heading bias.
Vestibular heading perception
The lack of effect of body position on visual heading estimation could result from little or no effect of body position on heading judgments in general. However,
Visual V e stibular W rit te n BP HD BP -HD BP HD BP -HD BP HD BP -HD F p Fp F p F p F p Fp F p F p F p Bias 0.61 0.45 3.37 , 0.0001 0.77 0.77 Tr ans ver se 0.37 0.55 89.76 , 0.0001 1.44 0.093 5.52 0.041 2.85 , 0.0001 7.19 , 0.0001 Cor onal 5.50 0.041 10.23 , 0.0001 1.21 0.24 25.29 0.00051 3.30 , 0.0001 4.59 , 0.0001 V ariability 7.01 0.024 4.04 , 0.0001 1.50 0.072 Tr ans ver se 0.27 0.61 11.08 , 0.0001 1.58 0.049 6.78 0.026 4.59 , 0.0001 1.62 0.041 Cor onal 0.018 0.90 7.60 , 0.0001 1.65 0.034 11.65 0.0066 5.66 , 0.0001 2.58 0.00019 Absolute bias 4.23 0.067 3.39 , 0.0001 0.86 0.65 Tr ans ver se 1.05 0.33 32.54 , 0.0001 1.31 0.16 0.018 0.90 3.42 , 0.0001 1.00 0.47 Cor onal 0.050 0.83 5.78 , 0.0001 0.98 0.49 25.68 0.00049 4.68 , 0.0001 1.77 0.019 Table 1. F v alues and p v alues fo r the repeat ed-meas ur es ANO V A s perf ormed. Notes :B P ¼ main eff ect of body position, df : 1,10; HD ¼ main eff ect of heading dir ection, df : 23, 230; BP -HD ¼ int er action between the body position and heading dir ection, df : 23, 230.
Journal of Vision(2016) 16(3):19, 1–11 Hummel, Cuturi, MacNeilage, & Flanagin 5
consistent with previous research, vestibular heading biases were strongly affected by body position (Figure 3). These effects varied depending on the stimulus plane.
In the transverse stimulus plane, oblique direction biases went in approximately opposite directions for upright (Figure 3A, top row, green) versus supine (Figure 3A, top row, blue) body position, correspond-ing to a weak main effect of body position and a significant interaction (Table 1). Significant differences between supine and upright biases were seen in almost all oblique heading directions (1658,1508,1358, 608,458,308,158, 458, 1208, 1358, 1508, and 1658,p
,0.05). In the coronal stimulus plane, a strong main effect of body position and significant interaction was found (Table 1). The upright (Figure 3A, bottom row,
green) body position showed no obvious directionality in heading bias. However, distinct heading biases were seen in the supine (Figure 3A, bottom row, blue) body position. Oblique forward heading directions were underestimated and oblique backward heading direc-tions, in particular movements to the left, were overestimated. In other words, subjects showed a bias toward the longitudinal body axis for supine heading estimates, which they did not show in an upright position.
Absolute bias and variability (Figure 3B, C) were further analyzed to determine the effects of body position on vestibular heading accuracy and precision. For transverse movements, absolute biases did not show significant effects of body position, but variability increased significantly in a supine body position (Table 1). For coronal stimuli, both absolute bias and
Figure 3. Vestibular heading perception. Color coding for body orientation and location for stimulus plane are the same as in Figure 2. (A) Left: mean bias across subjects (n¼11, green) and mean bias for each individual (n¼6, bright green) for the upright body orientation. Center: mean bias across subjects (n¼ 11, blue) and mean bias for each individual (n¼6, cyan) for the supine body orientation. Right: Mean bias across subjects plotted for both upright versus supine body orientations. (B) Mean absolute bias6 SEacross subjects. (C) Mean variability (standard deviation of the biases)6 SEacross subjects. Red ticks delineate significant differences between upright and supine as calculated by ttests (p,0.05).
Figure 2. Visual heading perception. Top rows always show results in the transverse stimulus plane and bottom rows the coronal stimulus plane. Green: upright body orientation, blue: supine body orientation. (A) Biases in heading direction estimation. Left: mean bias across subjects (n¼11, green) and mean bias for each individual (n¼6, bright green) for the upright body orientation. Center: mean bias across subjects (n¼
11, blue) and mean bias for each individual (n¼6, cyan) for the supine body orientation. Right: Mean bias across subjects plotted for both upright versus supine body orientations. (B) Mean absolute bias6 SEacross subjects. (C) Mean variability (standard deviation of the biases)6 SEacross subjects. Red ticks delineate significant differences between upright and supine as calculated byttests (p,0.05).
Journal of Vision(2016) 16(3):19, 1–11 Hummel, Cuturi, MacNeilage, & Flanagin 6
variability showed a significant main effect of body position (greater values in supine position) and an interaction between heading direction and body posi-tion. In general, the effects of body position were stronger for the coronal stimulus plane than for the transverse plane.
Written heading estimation
To explore possible effects of response modality on heading errors, subjects were also asked to move the arrow to angles that were written out numerically on the screen. Subjects tended to underestimate forward/ upward and to overestimate backward/downward directions. The magnitude of the biases measured was much smaller than those seen for visual and vestibular heading estimation (Figure 4), suggesting that response bias cannot explain the heading biases. Statistics on heading biases corrected for response bias (i.e., after subtraction of the response bias from the heading bias), showed very similar results as on the original heading biases. However, the weak main effects we found for body position for visual stimuli in the coronal plane, before correction:F(1, 10)¼5.50;p¼0.041; after correction:F(1, 10)¼2.78;p¼0.13, and vestibular stimuli in the transverse plane, before correction:F(1, 10)¼5.52;p¼0.041; after correction:F(1, 10)¼2.52;p
¼0.14, lost significance when accounting for the response bias. Body position had a significant main effect on variability and, by trend, also on the absolute response bias but in the opposite direction than the expected one. Greater errors and higher variability were seen for the upright rather than the supine condition. This may be attributable to the fact that the HMD was more comfortable and more stable in a supine position. However, the main effect was opposite from the effects we found for visual and vestibular heading biases. Thus, the results of the written experiment do not explain the overall effects of body position on heading biases.
Discussion
In this study, we compared visual and vestibular heading biases between upright and supine body positions. We found that visual heading perception is basically unaffected by the change in body position. Vestibular heading biases, on the other hand, were strongly modified. The effect of a supine body position extended to the direction, size, and variability of the vestibular heading biases and depended on the heading angle and the stimulus plane.
Visual heading perception
Humans can estimate their heading direction based solely on optic flow stimuli (Warren & Hannon, 1988). However, heading estimates can be strongly modified by other sensory inputs, such as vestibular, proprio-ceptive, and somatosensory cues (DeAngelis & Ange-laki, 2012). The supine body position that is required during functional imaging scanning is very uncommon when we move in everyday life; during supine
orientation, gravity acts along the sagittal rather than the longitudinal axis of the head and body. Is visual heading performance, when measured in a supine body position, comparable to upright performance? We found that visual heading estimates are very similar between upright and supine body positions. In partic-ular for the transverse plane, the most common plane of movement, we do not find significant differences in performance. This suggests that visual heading perfor-mance is not affected by a supine position and that the estimates are based exclusively on the visual stimuli, which are identical between body positions. A change in body position appears to affect vestibular heading perception as supported by the results of our vestibular heading experiment. However, the vestibular and proprioceptive sensory signals that differ between upright and supine body positions seem not to interfere
Figure 4. Written heading estimation. Color coding for body orientation is the same as in Figure 2and 3. (A) Left: mean bias across subjects (n¼11, green) and mean bias for each individual (n¼6, bright green) for the upright body orientation. Center: mean bias across subjects (n¼11, blue) and mean bias for each individual (n¼6, cyan) for the supine body orientation. Right: Mean bias across subjects plotted for both upright versus supine body orientations. (B) Mean absolute bias6 SEacross subjects. (C) Mean variability (standard deviation of the biases)
6SEacross subjects.
Journal of Vision(2016) 16(3):19, 1–11 Hummel, Cuturi, MacNeilage, & Flanagin 7