
INBREEDING EFFECTS UPON GROWTH AND MATERNAL ABILITY I N LABORATORY MICE
J. M. WHITE
Department of Dairy Science, Virginia Polytechnic Institute and State University, Blacksburg 24061
Manuscript received September 7, 1971
Revised copy received November 4, 1971
ABSTRACT
The effects of systematically increasing levels of inbreeding upon growth and postnatal maternal ability were determined in laboratory mice by utilizing the reciprocal crossfostering technique. Two experiments were conducted. The first included postnatal dams which were inbred 0, 12, 25 and 38% while cor- responding levels in the litter were 0,22,38 and 50%, respectively. The second experiment included 0, 25, 50 and 73% inbred dams with litters inbred 0,38,
59 and 79%, respectively. Increasing the level of inbreeding was found to linearly depress postnatal maternal performance. Young which had been suckled by the more inbred dams were smaller a t 12 and 21 days of age than those which had been nursed by the more outbred dams. I n the second experi- ment, these effects were carried over into the postweaning period. Increasing levels of inbreeding i n the litter significantly depressed birth weight and weight at 12, 21, 42 and 56 days. The depressing effects of inbreeding in the litter were primarily linear for both males and females under the conditions of
the more moderate levels of inbreeding included in the first experiment, but were curvilinear for females and linear for males in the second experiment. The curvilinearity in females was due to the general lack of depression until inbreeding had reached 50 to SO%, after which significant inbreeding depres- sion developed.
INBREEDING has been shown to depress growth and maternal or lactational ability in domestic livestock (BERESKIN et al. 1968, 1970; DINKEL et al. 1968; YOUNG et a2. 1969). However, i n most cases, the effects of inbreeding have been confounded with time trends and with other environmental effects. Additionally, effective separation of the effects of inbreeding on maternal performance from the effects of inbreeding upon growth of the offspring has been difficult in domes- tic species. Inbreeding depression has been implicated as a n explanation for asymmetry of response to bidirectional selection (FALCONER 1953) and as a
possible reason for unusual or unexpected correlated responses to selection for body weight i n laboratory mice (WHITE, LEGATES and EISEN 1968). Although many highly inbred lines of mice have been developed, little research has been reported on the magnitude and nature of the effects of increasing levels of in- breeding upon growth of the young and upon the maternal ability of the post- natal dam. Therefore, this study was conducted with the objective of character-
308 J . M. W H I T E
izing the effects of systematic increases in inbreeding upon growth of young mice and maternal ability in lactating females.
M A T E R I A L S A N D M E T H O D S
Inbred lines of mice utilized in this investigation were developed from a large, outbred population of ICR albino mice originally obtained from the Institute for Cancer Research, Phila- delphia.
Laboratory procedures: The reciprocal crossfostering technique utilized was similar to that shown by WHITE et al. (1968) to be suitable for studying independently differences in growth and postnatal maternal ability among genetically divergent lines of mice. Two experiments were conducted. The first (Experiment I) examined the effects of moderate levels of inbreeding by utilizing dams inbred 0, 12.5 (cited hereafter as 12) 25 and 37.5% (cited hereafter as 38%) whose offspring were inbred 0, 22, 38 and 50%, respectively. The second experiment (Experi- ment 11) was concerned with more intensive levels of inbreeding with dams inbred 0: 25: 50 and 73.4 (cited hereafter as 73%) whose offspring were inbred 0, 38, 59 and 78.5 (cited hereafter as 79%). The various levels of inbreeding in the postnatal dams were developed by mating paternal half sibs for one generation (12%) and through one (25%), two (38%), three (50%) and six (73%) generations of full sib matings. Only first litters were used. At birth, four dams, one each from 0, 12, 25 and 38% inbred groups in Experiment I or one each from 0, 25, 50 and 73% inbred groups i n Experiment I1 that had littered within the same 12-hr interval were assigned to each crossfoster group. Each dam was then given two of her own young and two from each
of the other three dams in her group. The remainder of the young were discarded. Newborn litters were sexed, standardized to eight, and each mouse was identified for genetic line by toe clipping. Offspring were weighed individually and randomly assigned to a postnatal dam in their particular crossfoster group. Fifty-five crossfoster groups were formed from 220 litters in EX- periment I and 26 crossfoster groups were formed from I04 litters in Experiment 11. There were 28 half-sib families represented in the dams inbred 12%, 26 full-sib families represented in the 25% inbred dams and 43 full-sib families represented in the 38% inbred dams in Experiment I.
I n Experiment 11, 12 full-sib families were represented in the 25% group, 15 in the 50% and 11 in the 73% inbred dam group. With the large number of families represented, actual levels of inbreeding should have closely approximated those calculated from theoretical considerations
(WRIGHT 1922).
At 12 days of age, individual body weights were recorded, and the young were permanently identified by toe clipping. Mice were weaned at 21 days and weighed individually. At weaning four mice of the same sex and level of inbreeding were randomly assigned to a cage, with the restriction that each cage contained mice from more than one litter. Individual body weights were recorded at 42 and 56 days of age. Only data from mice which survived to 56 days of age were included in the analysis. This restriction eliminated less than 6% of the data from Experiment
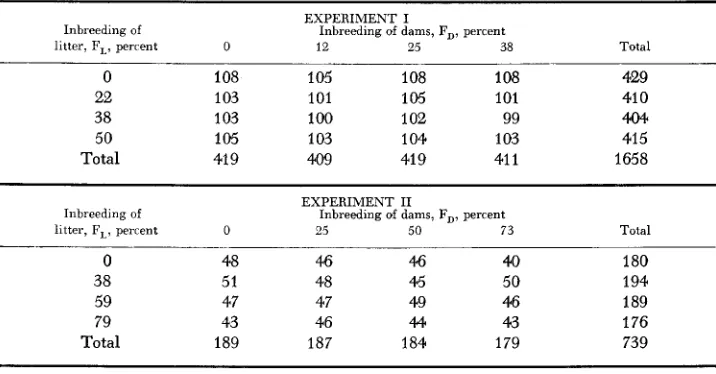
I and 11% from Experiment 11. Table 1 shows the distribution of surviving mice among levels of inbreeding in the litter (FL) and in the postnatal dam (F,,). Although there was a tendency for fewer survivors at the higher levels of inbreeding, chi-square tests indicated that the cell fre- quencies were homogenous. Apparently, even the more inbred dams readily maintained litters of eight mice. All mice were fed standard commercial breeding and growth rations and the labora- tory was maintained at approximately 22'C with a light-to-dark ratio of one.
Statistical techniques: The experimental design utilized was a randomized complete block with the four levels of inbreeding in the postnatal dam (F,) and the four levels in the offspring (FL) arranged factorially in each block (crossfoster group). The two experiments were analyzed separately according to the following model:
Y i n j k ~ m = B
+
gi+
si+
+
P Z+
(sa)j,+
(sp)jZ+
(ap),L+ e i jk zm,when B represents the general mean; g i is the effect of the ith crossfoster group ( i = 1.2 . . . , 5 5
I N B R E E D I N G E F F E C T S I N M I C E
TABLE 1
309
Number of mice in each F,-F, subclass surviving to 56 days of age
EXPERIMENT I
litter, F,, perrent 0 12 25 38 Total
Inbreeding of Inbreeding of dams, FD, percent
0 108 105 108 108 429
22 1 03 101 105 101 41 0
38 1 03 100 102 99 404
50 105 1 03 1 04 1 03 415
Total 41 9 409 41 9 41 1 1658
EXPERIMENT I1
litter, F,, percent 0 25 50 73 Total
Inbreeding of Inbreeding of dams, FD, percent
-.
0 48 46 46 40 180
38 51 48 45 50 194
59 47 47 49 46 189
79 43 46 44 43 176
Total 189 187 184 179 739
is the effect of the kth level of inbreeding in the litter (F,) (k = 1,2,3,4); p L is the effect of the Ith level of inbreeding in the postnatal dam (F,,) (Z = 1,2, 3, 4); (sa). and ( ~ p ) ~ ~ represent in-
teractions of sex with F,, and F,, respectively; represents the interaction of F, with F,
and e i j k l m represents the random error within subclasses. The g i and e i j k l 1 2 , were assumed to be independent random variables with zero means and variances ug2 and U,%, respectively. The
remaining effects were asxmed to be fixed. Due to unequal subclass numbers, methods as out- lined by HARVEY (1950) were used. Linearity of the ak and p L were determined by multiple regression procedures. Equations for crossfoster group-sex subclasses were absorbed by least squares, and the corrected sums of squares and cross-products were examined for linear and quadratic effects of F, and F, simultaneously, for each of the various traits. This procedure re- sults in the regression analysis being conducted within crossfoster-sex subclasses which assumes that the individual regressions for each of the 110 crossfoster-sex subclasses i n Experiment I and 52 subclasses in Experiment I1 were homogenous. Although no specific test of this assumption was made, analyses were completed within crossfoster groups for each sex separately and are reported along with the pooled analysis. The linear effect of total number born in the litter was included as a covariate for birth weight. Statistical significance of the polynomial regressions was tested by procedures outlined by KEMPTHORNE ( 1 952).
3.h
R E S U L T S A N D D I S C U S S I O N
310 J . M. WHITE
TABLE 2
Means of individual body weights for Experiment 1
~ ~
Inbreedmg of Birth 12-day 21 -day 42-day 56-day
Iltter, E',, weight. weight weight weight weight
0
22 38 50
Inbreeding of dam, F,
0
12 25 38 Std. errorsf
1.66 1.65 1.67 1.67
1.67 1.67 1.67 1.66 0.01
8.56 8.26 8.14 8.08
8.35 8.29 8.31 8.09 0.05
15.21 14.53 14.26 14.25
14.64 14.60 14.67 14.35 0.08
29.90 29.85 29.17 29.53
29.69 29.58 29.71 29.46 0.14
32.69 32.42 31.76 31.97
32.31 32.08 32.35 32.09 0.16
* Mean birth weight adjusted for linear effects of litter size at birth.
+
Standard errors for all means in the same column.cients derived from fitting linear effects of increasing levels of inbreeding in the litter
(FL)
and in the dam (F,,), and coefficients derived from fitting both linear and quadratic effects within sex-crossfoster group subclasses and separately for each sex are presented in Table 6. Regressions fitted with only linear effects considered indicated the direction and average magnitude of the effects of in- breeding. The second set included coefficients for both linear and quadratic effects, when quadratic effects were statistically significant, and yielded infor- mation relative to the genetic nature of the effects of inbreeding in the litter and postnatal dam. Since no quadratic effects of FD were significant in ExperimentI,
these coefficients were not listed in Table 6.
No significant differences were noted for birth weight in Experiment I due to
TABLE 3
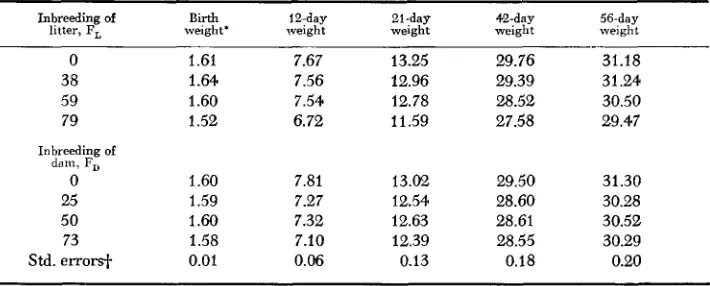
Means of individual body weights for Experiment II
~ ~ ~~ ~
Inbreeding of Birth 12-day 21-day 42-day 56-day
litter, F, weight' weight weight weight weight
0 1.61 7.67 13.25 29.76 31.18
38 1.64 7.56 12.96 29.39 31.24
59 1.60 7.54 12.78 28.52 30.50
79 1.52 6.72 11.59 27.58 29.47
Inbreeding of d a m , F,
0 1.60 7.81 13.02 29.50 31.30
25 1.59 7.27 12.54 28.60 30.28
50 1.60 7.32 12.63 28.61 30.52
73 1.58 7.10 12.39 28.55 30.29
Std. errorsi- 0.01 0.06 0.13 0.18 0.20
* Mean birth weight adjusted for linear effects of litter size at birth.
I N B R E E D I N G E F F E C T S I N MICE
TABLE 4
Analyses of variance for indiuidual body weight for Experiment I
31 1
Mean squares
Birth 12-day 21-day 42-day 56-day
Source df weight weight weight weight weight
Groups Sex (S) F L
F D
S x F, S X F D F L x F,
Linear Quadratic Linear Quadratic Error 54 1 3 1 1 1 1 3 3 3 9 1581 0.20 2.61" 0.05 0.03 0.02 0.01 0.01 0.02 14.34 15.79* *
19.46**
56.45 * * 2.66 5.58** 12.02** 2.87 0.73 0.74 0.24 0.94
43.85 82.63 85.16
180.35" 17895.47" 24957.65** 84.65** 47.20** 73.28** 237.38** 78.80** 182.4Q**
24.33" 0.84 2.08
8.61" 5.74 8.42
12.50' 5.89 1.33
8.76 2.62 0.13
8.12** 18.78 39.04**
2.18 6.78 3.28
0.99 5.26 4.47
2.90 8.46 10.27
Statistically significant ( P
<
0.05).* * Statistically significant ( P
<
0.01 ) .F L even though number born in the litter was fitted as a covariate. Number born
in
the litter was linearly and inversely related (P<
.Ol) to individual birth weight ( b = .009). Average litter size for the 0, 12, 25 and 38% inbred dams was 13.8, 12.4, 12.5 and 12.1, respectively. Apparently, the depressing effects ofthe levels of inbreeding included in Experiment I upon individual birth weight were not great enough to overcome the compensating effects of smaller litters born to the more inbred dams. In Experiment 11, individual birth weight re-
TABLE 5
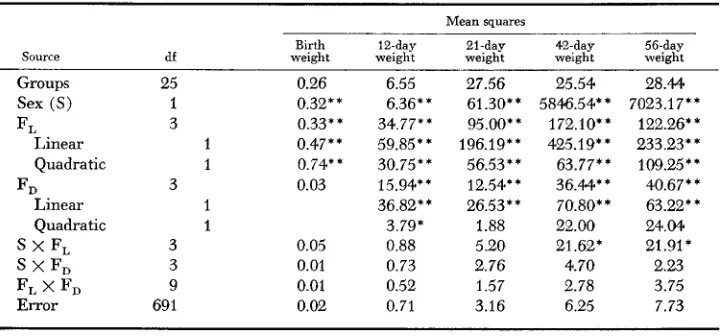
Analyses of variance for indiuidual body weight for Experiment II
Source df
Mean squares
Birth 12-day 21-day 42:day 56-day weight weight weight weight weight
Groups Sex (S) FL
F D
S X F, Linear Quadratic
Linear Quadratic
S X FD
FI. FD
Error 25 1 3 1 1 1 1 3 3 3 9 691 0.26 0.32** 0.33* * 0.47** 0.74* * 0.03 0.05 0.01 0.01 0.02 6.55 6.36* * 34.77** 59.85" 30.75" 15.94** 36.82** 3.79' 0.88 0.73 0.52 0.71 27.56 61.30** 95.00* * 196.19**
56.53* * 12.54** 26.53** 1.88 5.20 2.76 1.57 3.16 25.54 5846.54* *
172.10* *
425.1 9' * 63.77** 36.44** 70.80** 22.00 21.62' 4.70 2.78 6.25 28.M 7023.1 7* *
122.26* *
233.23** 109.25"
40.67* * 63.22* *
24.04 21.91*
2.23 3.75 7.73
312 + +
-g
35
"
._
E ? by"
9
.g
w
.z
m k
3
Q 2
Z - ? .k 8 + R h
5 8
$ 2
r : -
g
i!
P
E:._
w
J. M. WHITE
* * *
m
-
i
$ 8
3
q
g
H - 0 1
I I. I. I.
&
2
$ U
a ,
~ U,3 5
9& & k & h h
$ G * w
$ E @I9 9
2
I / I Ie 8
5
a - r g mg ? 9 9 T:"-c?9 9
I I I l l 1
* * I * *
* Q +.. 3 * * ro
0 w v )
"o,B%
mro
T:
W O
8
0 0 -cq 9 9 9 @I999
I I 1 / 1 1
2 %
W O 1
3
-19 9 m "
I 1 I I
* * * *
I;
$1
;.Id
* C O3
e$ 3
* * * *
e CI
d u & m
2
t - l % k & *F30
b;6
9 B " ! T : m 9 v ) - - % 1 85 1
I g I I I lE
h 3
zt
* * 4.9
8
F r l * h e - m 0 32 k g + $
%2
g
g - 6
9 g - 1 9 0 Y g$ g
X k 2 2 c . l w U l cow W h 2 ."E
Fr;*8
w V
75
5
I I I I I i
+ G * * * * E $ a
"!9189
191 3
8bb2 d
1
3
s
x
'j:H b ) o
%
x2
% $ $ $ %
W hg c?9-199
,986
? E 3 & , 2 zI l l I 1 1 . 1
$!:z
.z
z
q z z w .%
* x * * * * +
2%.23
a* x 5 g g g g 2 p 2 z :
I I I I.
I
I I Ip g $
5;
31
.- * ** * + * * X *
G$-gZ
8
r o w - m
8 5 6 8
r o w ) h L T I M $ % ? $ . Gv
41d T : o
3
a E . 5 2
;
I t g % k 2 . " ' . w + g , o ; = 2
f
org19
8
T : 9 T : 9 o o " ! h E E ai=
0 0 , 5 8 8 h
;
.- V * .$
@gJ?
3
k k L E f+ P4 L
%!
U k k a l 0$ 3 8 8 8 4
$ 4
+-zz+
:s
.5.B.9
3 . 2
g
X $ ".
j j A
5
I I I I I I
* * I * * * *
m -a.-
* * * *
0l
o - - m
d
0 m o m
* * * I * ;;
18
g g
8
S S 1 9 . ? . ~ ! g ~ .5 "
g g
h4
I 1 I l l 1 w o o 4 PI2 w- U
a d k c G
t X * I C * *
0 3
3
w m ro h 1 o n w w 0
I I I I
I
I I - o o o M ' Z ' Z E .%4 4 4-
n e
c-'
8 8 8 W
il n il 4:
4 4 - e 4
$B
c *
Ps
il Q il ;1 n n~ CPIPIFG ;; 5
INBREEDING EFFECTS I N MICE 313
mained stable for offspring born to 0 , 25 and 50% inbred dams, but declined markedly in litters born to 73% inbred dams (offspring inbred 79%). Average litter sizes i n Experiment I1 for dams inbred 0 , 2 5 5 0 and 73% were 14.8, 13.4, 11.8 and 11.8, respectively. The depressing effects of inbreeding overcame the compensating effects of smaller litter size in dams inbred 73% resulting in significant differences among mean birth weights of individual mice in Experi- ment 11.
WHITE
et al. (1968) demonstrated that in using the crossfostering technique, the effect due to F, represents not only differences in weight due to genetic effects of increasing levels of inbreeding in the offspring, but also any prenatal maternal (intrauterine) differences among prenatal dams that might be carried over into the postnatal period. Birth weight was not noticeably affected by these effects i n Experiment I, probably due to the compensating effects of fewer born with slightly heavier birth weights. Since offspring were randomly assigned to postnatal dams at birth, there were no significant differences in birth weight due to FD.Twelve-day weight was significantly depressed by increasing levels of inbreed- ing in both the litter (FL) and postnatal dam (FD) in both experiments. Linear effects were sufficient to explain the response to increasing levels of inbreeding
in the postnatal dam
(FD)
in Experiment I (Table 4) while quadratic effects were significant for the high levels of inbreeding examined in Experiment I1(Table
5).
It should be noted that 12-day weight in Experiment I1 was the only trait measured that showed a significant quadratic response due to FD. Therefore, it is likely that increasing levels of inbreeding generally resulted in a linear depression in postnatal maternal performance. This conclusion is in agreement with YOUNG et al. (1969) who found that increasing levels of inbreeding linearly depressed milk production in dairy cattle. The means in Tables 2 and 3 indicated that the depressing effects of inbreeding in the postnatal dam were slightly more severe in Experiment 11. Offspring which had been suckled by dams inbred 0,12 and 25% showed little variation in 12-day weight in Experiment I, while in Experiment 11, offspring which had been suckled by 25% inbred dams were considerably smaller at 12 days than those which had suckled outbred dams. The effect of inbreeding in the postnatal dam should be at its peak when the litter is 12 days of age because the young do not open their eyes until they are 12 o r 13 days old and depend upon their dam for all nourishment during this period. However, the regression coefficients in Table 6 indicated that the depressing effects of FL were 30 to 40% greater than FD. For example, at 30% inbreeding in Experiment I, individual mice would be expected to weigh 0.30 g less than outbred mice at 12 days of age due to F L , while 30% inbreeding in the postnatal dam would be expected to further depress 12-day weight in the offspring by another 0.18 g, other things being equal. These results agree with those ofBERESKIN et al. (1968) and SWIGER et al. (1961) who found similar results for swine and beef cattle, respectively. They also confirm the hypothesis advanced by WHITE et al. (1968) that inbreeding depression was at least a partial cause
314 J. M. WHITE
performance of dams selected for increased body weight at six weeks of age for 40 generations, and in which inbreeding had accumulated to 40%, was inferior to that of outbred controls.
The absence of significant interactions for sex by F, (Tables
4
and 5 ) and the similarity of regressions for both sexes (Table 6) indicated that the effects of inbreeding on weight at 12 days were similar for males and females. There was no tendency for one sex to be depressed more than the other.The absence of significant FL X F D interactions for 12-day weight indicated that the effects of crossfostering per se were negligible. These results agree with those of WHITE et al. (1968), who found little evidence of preferential treatment when crossfostering among dams of different selected lines with standardized litter size, and NAGAR, LEE and
HICKMAN
(1971) who found similar results when crossfostering among inbred and outbred dams. Similar conclusions can be drawn with reference to the S x FD interaction. Even though males were significantly larger females at 12 days of age, postnatal dams apparently treated male and female offspring similarly. There was apparently very little active competitionfor nourishment from birth to 12 days in litters of eight mice.
Weight at 21 days (weaning weight) was significantly depressed by increasing levels of inbreeding in the litter (F,)
.
Mean squares (Tables 4 and 5 ) and partial regressions (Table 6) indicated significant linear and quadratic effects of inbreed- ing in the litter upon weaning weight. These results are in agreement with those of BERESKIN et al. (1968, 1970), who found significant curvilinear effects of inbreeding in the litter upon weaning weight in swine, but found that only linear effects of inbreeding in the dam were significant. The means in Tables 2 and 3indicated that the overall depressing effects of inbreeding in the litter were evi- dent from 0 to 22%, less severe from 22 to 59% and were severe from 59 to 79%, resulting in the significant curvilinear effects. Effects of inbreeding in the post- natal dam ( F D ) upon weaning weight were significant but were small as evi- denced by the linear regressions in Table 6. The linear regressions indicated that the depressing effects of F, upon weaning weight were much greater than the depressing effects of F,.
The sex by
FL
interaction was significant for weaning weight in Experiment I(Table
4).
This interaction developed from a sex difference in the response to inbreeding in the litter (FL) (Table 7 ) . While not statistically significant, similar patterns of response may be observed in Table 7 for male-female 21-day weights in Experiment 11. I n Table 7, Experiment I, male weight decreased 7.5% and female weight 5.0% as inbreeding increased from 0 to 50%. In Experiment 11,INBREEDING EFFECTS I N MICE 315
TABLE 7
Weights of males and females at various levels of inbreeding in the litter ( F , )
21-day weight 42-day weight 56-day weight h e 1 of inbreeding Males Females Males Females Males Females
~
EXPERIMENT I
0 15.66 14.77 33.36 26.44 36.87 28.51
22 14.73 14.34 32.95 26.74 36.08 28.76
38 14.73 13.80 32.71 25.63 35.95 27.58
50 14.48 14.03 32.69 26.37 35.61 2.8.33
Std. error* 0.12 0.12 0.20 0.21 0.22 0.23
EXPERIMENT I1
0 13.66 12.84 33.05 26.47 34.71 27.66
38 13.07 12.85 31.98 26.81 34.25 28.24
59 12.97 12.59 31.10 25.94 33.22 27.77
79 12.05 11.13 30.59 24.56 32.79 26.15
Std. error* 0.19 0.19 0.26 0.26 0.29 0.30
* Standard errors for all means in the same column.
depressing effects were more drastic than in males. The total depression for increasing inbreeding from 0 to 79% was similar (11.8% for males and 13.3% for females) for both sexes. These results are not consistent with those of STON- AKER (1963) who found the effects of inbreeding depression on weaning weight to be much greater i n female than in male beef calves. However, variable responses among the sexes to inbreeding may be dependent upon the level of inbreeding attained. The S x FD and FL
x
F,
interactions were not significant for weaning weight. These results provided further evidence that postnatal dams treated male and female, native and fostered mice similarly and that the effectsof crossfostering per se were negligible.
The
RZ
values in Table 6 indicated that 4 to 23% of the variation in prewean- ing growth can be accounted for by inbreeding. These results are similar to those previously published for domestic livestock (BERESKIN et al. 1968,1970;DINKEL
et al. 1968).
A
greater proportion of the variation in growth was accounted for by higher levels of inbreeding than by lower levels.Postweaning traits: Means for the postweaning traits are shown in Tables 2
and 3 while appropriate mean squares and regressions are shown in Tables 4, 5
and 6, respectively. Males were significantly larger than females at all stages of growth. No significant differences for either postweaning trait were detected among offspring that were suckled by outbred postnatal dams and those that had been nursed by the more inbred dams in Experiment I. The regressions in Table 6
316 J. M. WHITE
upon the postnatal maternal performance of the more inbred dams significantly affected the weight at 42 and 56 days of offspring which they had suckled. These results are in agreement with those in swine (BERESKIN et al. 1968) where the depressing effects of inbreeding in the dam upon 156-day weight were significant. The depressing effects of FL were significant for weight at 42 and 56 days of age for both experiments. These results were similar to those of BERESKIN et al.
(1968) who found significant depression in 154-day weight in swine due to inbreeding in the litter and those of DINKEL et al. (1968) who found significant reduction in 364-day weight of beef cattle due to inbreeding in the calf.
The effects of inbreeding in the litter upon postweaning traits were linear in Experiment
I
but were curvilinear in Experiment 11. FALCONER (1960) has sug- gested that curvilinear responses could result from complex epistatic gene effects depending on interactions between dominance combinations. However, the re- gression coefficients (Table 6) revealed that the responses were linear for males in both experiments but were curvilinear for females in Experiment 11. This variable response among the sexes was further verified by the significant S X FLinteractions for weight at 56 days, and approaching significance (P
<
0.10) for 42-day weight in Experiment I. The interaction was significant for both post- weaning traits in Experiment 11. Inspection of the 42- and 56-day weight means in Table 7 revealed that male weights were linearly depressed by inbreeding while female weight was more stable and did not show inbreeding depression for either postweaning trait until the level of inbreeding had reached 59%. Males inbred 50.0% were 0.67 g smaller at 42 days and 1.26 g smaller at 56 days than outbred males while corresponding differences for females were only 0.07 g and 0.18 g, respectively. The end result of increasing inbreeding in Experiment I1from 0 to 79% was a 7.4 and 7.2% decrease in the 42-day weight of males and females, respectively; and a 5.5% decrease in 56-day weight in both sexes. There- fore, although the mechanism of inbreeding depression may have been different among the sexes, the end result was basically the same.
this experiment.
The author is grateful for the technical assistance of Mrs. JUDITH SUTPHIN in conducting
LITERATURE CITED
BERESKIN, B., C. E. SHELBY, K. E. ROWE, W. E. URBAN, JR., C. T. BLUM, A. B. CHAPMAN, V. A. GARWOOD, L. N. HAZEL, J. F. LASLEY, W. T. MAGEE. J. W. MCCARTY and J. A. WHATLEY, JR.,
1968 Inbreeding and swine productivity traits. J. Animal Sci. 27: 339-350.
BERESKIN, B., C. E. SHELBY, K. E. ROWE, W. E. REMPEL, A. E. DETTMERS and H. W. NORTON, Inbreeding and swine productivity in Minnesota experimental herds. J. Animal Sci.
Effects of inbreeding 1970
31: 278-288.
DINKEL, C. A., D. A. BUSCH, J. A. MINYARD and W. R. TREVILLYAN, 1968 on growth and conformation of beef cattle. J. Animal Sci. 27: 313-322. FALCONER, D. S., 1953
FALCONER, D. S., 1960 HARVEY, W. R., 1960
Selection for large and small size in mice. J. Genet. 51: 470-501. Quantitatiue Genetics. The Ronald Press, New York.
INBREEDING EFFECTS I N MICE 317
KEMPTHORNE, O., 1952 T h e Design and Analysis of Experiments. John Wiley and Sons, Inc.,
Preweaning growth of inbred, F, hybrid, and
STONAIIER, i<. H., 1963 A genetic hypothesis for sex-mating system interactions in growth of
SWISER, L. -4,, K. E. GREGORY, R. M. KOCH and V. A. ARTHAND, 1961 Effect of inbreeding on
WHITE, J. M., J. E. LEGATES and E. J. EISEN, 1968 Maternal effects among lines of mice selected
WRIGHT, S., 1922 Coefficients of inbreeding and relationship. Amer. Naturalist 56: 33S338. YOUNG, C. W., W. J. TYLER, A. E. FREEMAN, H. H. VOELKER, L. D. MCGILLIARD and T. M. LUD-
Inbreeding investigations with dairy cattle in the north central region of the New York.
NAGAR, J., A. J. LEE and C. G. HICKMAN, 1971
random-bred mice as a measure of mother’s lactation. Can. J. Genet. Cytol. 13: 20-28.
cattle a-id poultry. J. Animal Sci. 22: 320-325.
performance traits of beef cattle. J . Animal Sci. 20: 626-630.
for body weight. Genetics 60: 395-408.
WICK, 1963
![(Utilisation de la similarité sémantique pour l’extraction de lexiques bilingues à partir de corpus comparables) [in French]](data:image/gif;base64,R0lGODlhAQABAIAAAP///wAAACH5BAEAAAAALAAAAAABAAEAAAICRAEAOw==)