STUDY OF STRESS-INDUCED MICROSTRUCTURAL CHANGES IN
NUCLEAR GRADE GRAPHITE USING THREE-DIMENSIONAL
IMAGING TECHNIQUES
Joshua Taylor1, Ying Wang2, Philip Withers3, Graham Hall4, Paul Mummery5
1
Postgraduate Student, University of Manchester, UK
2
Postgraduate Student, Manchester X-Ray Imaging Facility, University of Manchester, UK
3
Director, Manchester X-Ray Imaging Facility, University of Manchester, UK
4
Lecturer, University of Manchester, UK
5
Chair in Nuclear Materials, University of Manchester, UK
ABSTRACT
Graphite is used as a moderating material and as a structural component in the UK’s Advanced Gas-Cooled Reactors and Magnox Reactors, Russian RBMKs and various designs of High Temperature Reactors. During reactor operation graphite components are subjected to considerable stresses and have been shown to deform and, over time, crack. Such changes may compromise the safety and efficiency of the reactor and reduce its operational lifespan, so it is important to have a detailed understanding of graphite’s response to the stresses present in operational nuclear reactors.
Samples of reactor grade Gilsocarbon and Pile Grade A graphites were subjected to loading-induced stresses using a deformation rig, and a series of 3D imaging techniques were used to study changes to the microstructure of the samples as they were loaded to progressively greater levels of stress. X-ray tomography was used to image the interior of the samples, with particular attention paid to the complex pore structures of the materials which play a significant role in crack propagation and whose responses to stress are poorly understood.
Stress-induced changes to the pore structure were quantified in terms of variation of pore volumes and shapes. The observed changes to the microstructure were used to explain the behaviour of the bulk material, and the consequences for the UK’s ageing graphite moderated reactor fleet were discussed.
INTRODUCTION
Graphite is used as a moderating material and as a structural component in various designs of fission reactors. It has predominantly been used in British Advanced Gas-Cooled Reactors (AGRs) and Magnox Reactors, but has also been used as the moderating material in Russian RBMK reactors, French UNGG reactors and various designs of High Temperature Reactors (HTRs). Graphite is particularly suitable for neutron moderation due to its high moderating efficiency, reasonable atomic weight (which affects the rate at which the neutrons are moderated), abundance and low cost.
Naturally occurring graphites must undergo a stringent manufacturing process before they can be used for nuclear applications. The required properties of a moderating material – few impurities, low neutron absorption cross-section, high neutron scattering cross-section and sufficient strength to survive the physical conditions in a working reactor – are ensured using a series of thermal treatment, milling and impregnation processes, in a process documented by Nightingale (1962).
needle-like and exhibit preferential ordering along one axis as a result of the manufacturing process. Therefore, PGA is anisotropic and exhibits different physical properties in different directions.
In an AGR, the graphite moderating materials are machined into large bricks with channels running down their centres, into which fuel rods and control rods are inserted and coolant flows. If the graphite components were to crack or deform as a result of the significant stresses that build up in working reactors, it is possible that these channels could become blocked. The inability to cool the reactor or control the rate of fission as a result of blocked fuel assembly channels, control rod channels or coolant channels, would have significant safety implications.
Given the UK’s considerable investment in graphite-moderated nuclear reactors and the large numbers of these reactors operating beyond their original designed lifetimes, it is particularly important to understand how the build-up of stresses in operational reactors affects the structural integrity of graphite moderator components. Without this knowledge the safe and efficient operation of graphite-moderated nuclear reactors cannot be guaranteed, and the case for further life-extension of ageing power plants is weakened.
THEORY
Tsang and Marsden (2006) define the total strain acting upon a graphite moderating component in a nuclear reactor as being made up of six separate components, as shown in Equation 1:
ϵtotal = ϵe + ϵpc + ϵsc + ϵdc + ϵth + ϵith (1)
Where ϵe
is the elastic strain, ϵpc is the primary creep strain, ϵsc is the secondary creep strain, ϵdc is the dimensional change strain, ϵth
is the thermal strain, and ϵith is the interaction thermal strain. The largest contributions to the total strain are the irradiation-induced stresses, followed by the thermally-induced stresses. By comparison, the elastic strain term is relatively small.
With the failure of graphite components being a significant concern for the safe operation of graphite-moderated reactors, significant research has been performed to determine how and why graphite deforms when exposed to stresses. Smith (1964) and Jenkins (1965) identified two main mechanisms that underpin deformation and failure behaviour of graphite components: microcracking and dislocation movement. Microcracks form due to applied stresses, and these cracks can grow and combine with one another to form large scale fracture paths. Dislocation movement occurs when lattice atoms are knocked into interstitial locations between lattice layers. Semi-stable clusters of interstitial atoms or vacancies left by departing atoms can lead to planar slippage and large scale plastic deformation of the bulk material.
To investigate how reactor stresses compromise the strength and integrity of graphite components, stresses must be created in samples to be studied. A common technique in such studies is to simulate the stresses through the application of a compressive or tensile load upon the sample. The well-established technique of using a load to generate stresses is known to be a good approximation of stress formation inside a working reactor.
With this technique in mind, a novel series of experiments was proposed to investigate how stresses affect the material and microstructural properties of nuclear grade graphites. Of particular interest was how stresses damage and deform the pore structure of the material. Since nuclear grade graphites can be very porous, and the porosity increases significantly after long periods of time inside an operational nuclear reactor, changes to the pore structure will have a considerable impact upon the strength and integrity of the components. Pores are known to range in size from millimetres to Angstroms, so multiple experiments across multiple length scales are required.
EXPERIMENTAL
Material Properties
Pile Grade A and Gilsocarbon graphites were selected for study due to their use in British Magnox Reactors and Advanced Gas-Cooled Reactors respectively. Details of these grades of graphite are shown in Table 1 below.
Pile Grade A graphite contains long thin filler particles that become oriented as a result of the extrusion process during manufacturing. The filler particles orient themselves parallel to the extrusion direction (or ‘grain direction’), such that the properties of the material vary depending on whether they are being measured parallel or perpendicular to the grain direction. Long thin pores are observed in the filler particles, oriented with the grain direction. Pores in the binder phase do not exhibit significant preferential ordering.
Gilsocarbon is moulded during manufacturing and is comprised of spherical layered filler particles held in a binder matrix. The material is considered to be semi-isotropic. Pores in the filler particles typically follow the layered, onion-like shell structure of the filler particles themselves, while pores in the binder phase do not exhibit any preferential ordering.
Table 1: Manufacturing and physical property details of Gilsocarbon and Pile Grade A, the two grades of graphite selected for study. Values of density, compressive strength and Young’s modulus calculated by
Brocklehurst and Kelly (1993).
Grade Forming process
Filler particle morphology
Density [g cm-3]
Compressive strength [MPa]
Young’s modulus [GPa]
PGA Extrusion Elongated 1.74 27 with grain 17 against grain
11.7 with grain 5.4 against grain
Gilsocarbon Moulding Spherical 1.81 70 10.85
Sample Preparation
Three samples were machined from Gilsocarbon and Pile Grade A bricks manufactured by British Acheson Electrodes Ltd. Each sample was machined into a cylinder of height 10 ± 0.1 mm and diameter 8 ± 0.1mm. Due to the anisotropy of Pile Grade A graphite, two samples were required for study – one with the long axis oriented parallel to the grain direction and a second sample with the long axis oriented perpendicular to the grain direction. Due to the semi-isotropy of Gilsocarbon, only a single sample was machined.
Samples were cleaned in a bath of deionised water, followed by 30 minutes in an ultrasonic bath containing acetone, to remove loose pieces of graphite or other impurities from the open pores in the samples.
In-Situ X-Ray Tomography
The X-ray tomography was performed using the Nikon Metrology 320/225 kV Custom Bay at the Manchester X-Ray Imaging Facility. This machine was selected due to the high resolution images attainable and its compatibility with in-situ sample environments. The Custom Bay can achieve resolutions between 3 and 160 µm for samples of diameter between 3 and 320 mm respectively.
These parameters provided suitable contrast and transmission required for the study of the interior pore structures of the samples.
In order to apply an in-situ axial load to the samples, a compression rig manufactured by Deben was used. The rig consisted of a static base plate upon which the sample was mounted, with a moveable upper plate and a 5 kN load cell used to apply the compressive load. Integrated software allowed real-time control and tracking of the force applied to the sample, to an accuracy of 0.1 N. Due to the size and shape of the loading rig, the distance from the X-ray source to the sample and the distance from the sample to the detector were quite large. This limited the resolution of the images. The smallest possible pixel size attainable by the Custom Bay when the compression rig was in use was found to be 18.5 µm.
A series of axial compressive loads were applied to each sample. The samples were compressed to loads ranging between 0 N and 95% of the anticipated failure load of the sample, calculated using Equation 2:
F = A
σ
(2)
Where A is the cross-sectional area of the sample, σ is the compressive strength of each type of graphite shown in Table 1 and F is the expected failure load of the sample.
The initial scan for each sample was performed with a token non-zero force applied to the sample, since there is a possibility of sample movement during initial contact between the sample and the loading ram. After this initial scan the compressive load applied to the sample was slowly increased. Periodically the sample was held at a constant load while a tomography scan was performed. Each full scan was comprised of 1500 projections across 360°, resulting in an image being recorded every 0.24° of rotation, and a full scan time of 36 minutes. This step size was a compromise between maximising the quality of the reconstructed images and the limited amount of time available for the experiment. In total, four scans were performed on each sample of PGA graphite, whilst five scans were performed on the Gilsocarbon sample.
Image Analysis
The tomography data sets were reconstructed using the ASTRA toolbox created by Palenstijn, Batenburg et al (2012). Once reconstructed, the images were imported into Fiji, an image analysis package that contains a number of programs and plugins that are particularly useful for tomography image analysis.
To segment the pore structure in each sample and separate it from the binder and filler materials, a greyscale thresholding technique was used. A threshold intensity was defined such that voxels with an intensity below the threshold are defined as pores and voxels with an intensity greater than the threshold are not classed as pores. Although the resolution of the images were 18.5µm, it is not ideal to quantify pore properties at this level since small pores with sizes of the order of a few voxels will not be adequately resolved, and as such the error associated with each result will be significant. As the observed pores get larger, this source of error becomes less significant.
The volume of each individual pore was calculated with the assistance of the 3D Objects Counter
plugin, a data analysis package created by Bolte and Cordelières (2006) that quantifies many different parameters of objects defined through thresholding. In this case the plugin was used to calculate the volume of each individual pore. Pore volumes were calculated for each image at progressively higher loads to determine quantitatively how compressive stresses deform the pore structure.
These properties were then used to calculate the eccentricity of each fitted ellipsoid, as defined by Equation 3:
e2 = 1 – (c2 a-1/2) (3)
Where e is the eccentricity, a is the major radius and c is the second radius of the fitted ellipsoid. The result is a value between 0 and 1, where 0 represents a perfect sphere and values approaching 1 indicate an increasingly elongated shape.
Although this technique is well established for study of pore shapes, for example by Kane et al (2011), its effectiveness is limited by the difficulty of accurately fitting ellipsoids to irregularly-shaped or structurally complex pores. During previous studies of two-dimensional pore entrance areas by Taylor et al (2015), a technique to identify pores that were badly defined by ellipses through comparisons of the perimeters of each pore and its fitted ellipse was defined. It was proposed that perfect fitting ellipses would exhibit a pore perimeter to ellipse perimeter ratio of 1. Deviation from this value was indicative of a poorly fitting ellipse, and a cutoff was chosen beyond which pores were rejected for study.
To extend this technique to three dimensions, a similar comparison was performed using the surface areas of pores and their fitted ellipsoids. As before, ratios of pore surface areas to fitted ellipsoid surface areas were calculated. An acceptable fitting range of 0.75 – 1.25 was chosen through visual study of the data, and pores with surface area ratios outside of this range were rejected from eccentricity calculations (resulting in rejection of approximately 18% of the pores).
RESULTS AND DISCUSSION
Pore Volume Analysis
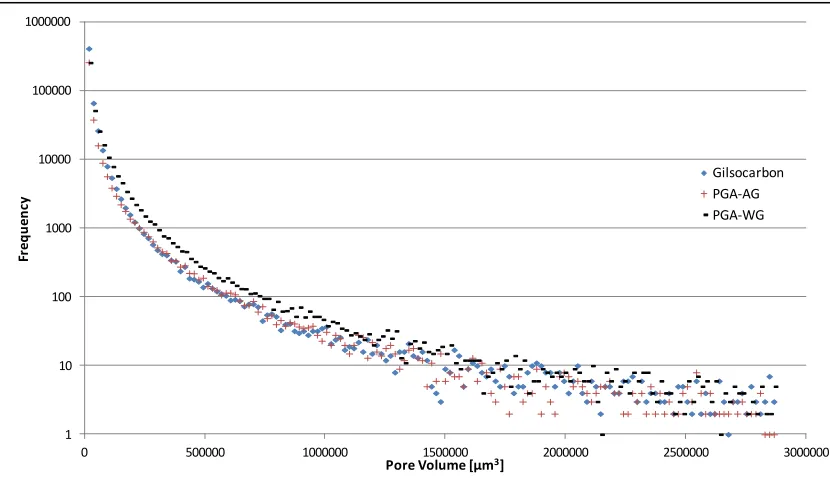
Figure 1 shows the range of pore volumes observed in each sample at zero load. In each case pores up to a size of 0.0029 mm3 are shown. Although there are some pores with volumes exceeding the range shown in Figure 1, they make up less than 0.1% of the total number of pores observed in the Gilsocarbon and PGA samples.
Both PGA and Gilsocarbon graphites exhibit broadly similar pore size distributions. A power law of the form f = AvB, where f is the observed frequency of pores of volume v, and A and B are constants, describes the relationship between pore size and frequency well. This relationship agrees with previous studies of pore areas, using two-dimensional data, by the authors.
1 10 100 1000 10000 100000 1000000
0 500000 1000000 1500000 2000000 2500000 3000000
Fr
e
q
u
e
n
cy
Pore Volume [µm3]
Gilsocarbon PGA-AG PGA-WG
Figure 1: Distribution of the range of pore volumes present in the three samples studied with no external load applied. A logarithmic y-axis is used to increase readability of data. The observed relationships are well described by power laws.
y = -750x2- 1,197x + 29,960
y = -2,881x2+ 139x + 34,290
y = -779x2- 1,060x + 34,695
28000 29000 30000 31000 32000 33000 34000 35000 36000
0 0.2 0.4 0.6 0.8 1
Mea
n
p
o
re
vo
lu
me
[µm
3]
Ratio of applied load to failure load
Gilsocarbon PGA-AG PGA-WG
Figure 2: Mean pore volumes at a range of applied loads for each graphite sample. Stresses are shown as a ratio to the expected failure load of the sample calculated using Equation 2 and data from Table 1. Quadratic best-fitting curves are shown for each sample.
In both Gilsocarbon and PGA, mean pore volumes appear to decrease quadratically, which suggests that the rate at which pore collapse and closure occurs increases as the applied load increases. The quadratic relationship was unexpected since a similar study performed using two-dimensional pore area data by Taylor et al (2015) showed a linear relationship between mean pore area and applied load.
direction (PGA-AG). This is because the long thin filler particles in PGA graphite become oriented along the grain direction during manufacturing. These particles are much more resistant to dimensional change when loaded parallel to their long axis than when loaded perpendicular to the long axis, therefore the compressive strength of the filler particles, and hence the bulk material, is greater in the grain direction. This behaviour explains the difference in compressive strength values in PGA graphite shown in Table 1.
Pore Eccentricity Analysis
Gilsocarbon is manufactured to be semi-isotropic, with no preferential shape or orientation of pores present in the raw material or introduced during manufacturing. Filler particles typically contain a number of thin pores aligned along spherical ‘shells’, similar to the layers of an onion. PGA graphite contains elongated filler particles containing long thin pores that align themselves along the long axis of the filler particles during manufacturing. In the binder phase no preferential pore shape or orientation is observed.
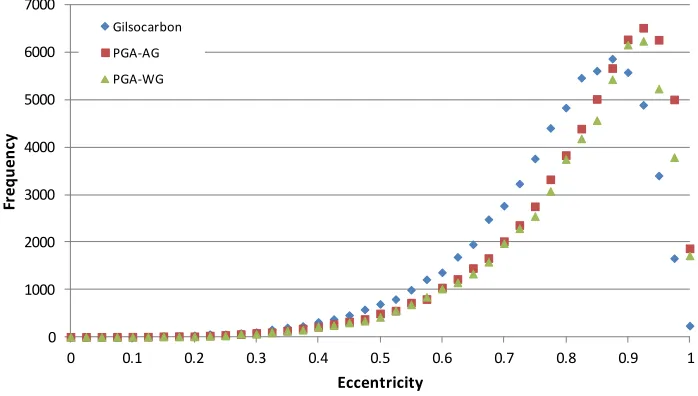
Figure 3 shows the variation of pore eccentricity at zero load, showing the frequency of pores observed at a range of eccentricities.
0 1000 2000 3000 4000 5000 6000 7000
0 0.1 0.2 0.3 0.4 0.5 0.6 0.7 0.8 0.9 1
Fr
eq
u
en
cy
Eccentricity
Gilsocarbon
PGA-AG
PGA-WG
Figure 3: The range of pore eccentricities observed in Gilsocarbon and PGA samples with zero applied load. An eccentricity of zero represents a perfect sphere, while progressively larger values indicate the pore has an increasingly large aspect ratio.
In all three cases the pore eccentricity distribution is negatively skewed, with a clear bias towards highly eccentric pores and a long tail to the left. Mean eccentricity is lower in Gilsocarbon than in PGA. Given the large numbers of highly eccentric pores in each material, it was anticipated that loading-induced changes to mean pore eccentricities would be dominated by deformation of highly eccentric pores. Thus different orientations of PGA graphite are expected to behave very differently due to their highly eccentric, well ordered filler particle pores.
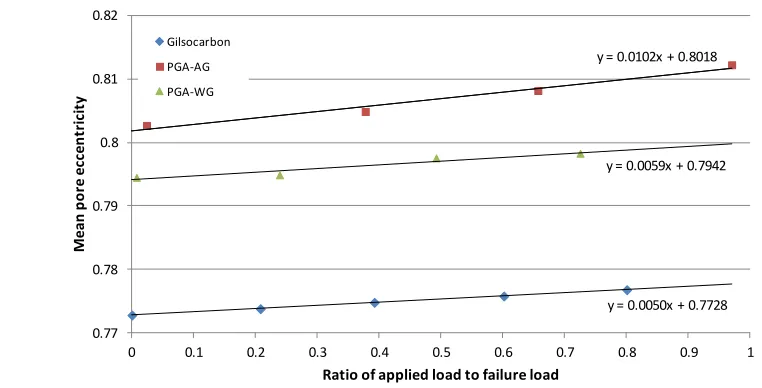
y = 0.0050x + 0.7728 y = 0.0102x + 0.8018
y = 0.0059x + 0.7942
0.77 0.78 0.79 0.8 0.81 0.82
0 0.1 0.2 0.3 0.4 0.5 0.6 0.7 0.8 0.9 1
M
ea
n
p
o
re
ec
cen
tr
ic
it
y
Ratio of applied load to failure load
Gilsocarbon PGA-AG PGA-WG
Figure 4: Graph showing the change in mean pore eccentricity of each sample at a range of loads. The applied load is shown as a ratio to the expected failure load calculated using Equation 2 and the data in Table 1.
Each sample was observed to exhibit a linear increase in mean pore eccentricity when the applied load was increased. The compressive strength data in Table 1 suggests that Gilsocarbon should exhibit the smallest changes in mean pore eccentricity since it has a much higher compressive strength than either orientation of PGA graphite. This hypothesis was confirmed by the data in Figure 4, with the rate of change of pore volumes in Gilsocarbon being smaller than the equivalent behaviour in PGA.
Gilsocarbon was observed to predominantly contain highly eccentric pores, but with little preferential directional orientation of pores. When a compressive load was applied to the Gilsocarbon sample, the pores oriented perpendicular to the loading axis were less resistant to loading-induced collapse and exhibited a relatively large increase in eccentricity. The pores oriented parallel to the loading direction were stiffer and more resistant to dimensional change, and exhibited a relatively small decrease in eccentricity. These competing changes resulted in a net increase in mean eccentricity.
For the PGA-AG sample the rate of change is greater than that for PGA-WG, which was expected since this orientation of PGA has a lower strength and is more susceptible to deformation, as shown in Table 1. Long thin pores are more resistant to deformation if they are oriented parallel to the loading axis than if they are oriented perpendicular to the loading axis. In this case the needle-like pores present in the filler particles are oriented perpendicular to the applied axial load, so they are particularly susceptible to dimensional change. By comparison, the filler particle pores in PGA-WG are much more resistant to compression due to their orientation along the loading axis, which explains the lower rate of change of mean eccentricity observed in the PGA-WG sample.
To explain the observed increases in mean eccentricity in the PGA samples, the effects of the aligned filler particles must be considered. In the PGA-AG sample highly eccentric pores in the filler particles are ordered perpendicular to the loading direction. Pores of this orientation will exhibit an increase in eccentricity when compressed, which contributes to the increase in mean eccentricity.
The filler particles in the PGA-WG sample contain pores ordered parallel to the loading direction. It was expected that this would result in a reduction in mean pore eccentricity, however this was not observed. Applying the load to this sample increased the eccentricity of these pores as they collapsed. Mean eccentricity increased with the applied load, but at a lower rate than for PGA-AG.
contribution of the elongated pores in the filler particles to the overall mean porosity is less in PGA-AG than in PGA-WG.
With no preferential orientation of pores present in the non-filler regions, a relatively large increase mean in pore eccentricity in these regions was observed, for the same reasons that underpin the behaviour in Gilsocarbon, discussed above.
The large increase in mean pore eccentricity in the non-filler regions and the small decrease in mean pore eccentricity observed in the filler particles combine to give a small net increase in mean pore eccentricity in the PGA-WG sample.
CONCLUSIONS
Many previous imaging-based studies into pore behaviour in graphite, such as those by Kane at el (2011), Bodel (2012) and Taylor et al (2015) utilise two dimensional microscopy data. The extension of these existing methodologies to three dimensions allows analysis of the pore structure in the interior of the materials to be performed. This yields information that is much more useful and relevant to the study of graphite moderator materials than could be achieved solely through the acquisition and analysis of two dimensional data.
At low loads, application of compressive loads was found to predominantly deform the pores and cracks, with a proportionally smaller amount of binder phase closure. The relationship between pore volumes and applied load was found to be inversely quadratic. This conflicts with existing research by the authors using two dimensional data, which predicted an inverse linear relationship. Since the existence of porosity in the graphite moderating components is known to weaken the components’ strength, stress-induced closure of pores is expected to make graphite reactor components stronger and have increased longevity in a working reactor. However, this effect does not happen in isolation – for example, the competing processes of oxidation and irradiation-induced damage will hasten the damage and degradation to the material, reducing its’ strength and structural integrity.
The main limitation of this research is the limited resolution of the data available. This is due to the size of the axial deformation rig increasing the source-to-sample and sample-to-detector distances. While the Nikon Metrology 320/225 kV Custom Bay can achieve resolutions of 3 µm, the size of the rig resulted in a maximum attainable resolution of 18.5 µm. Repeating the experiments documented in this paper with a smaller rig will result in a significant increase in the number and range of sizes of resolvable pores, particularly given the significant bias towards small pores shown in Figure 1.
This paper discusses only a few of the microstructural properties that can be studied to gain an understanding of the stress-induced deformation behaviour of graphite. Pore volume and pore eccentricity data provide insight into how and why the pore structure collapses when exposed to stresses. Further studies by the authors have included observing variation of pore orientations and deformation in the binder and filler phases. In addition, the methods discussed in this paper have so far only been applied to unirradiated graphite components. Whilst a study of stress-induced deformation behaviour in irradiated graphites will provide a more accurate approximation of the conditions present in an operational nuclear reactor, this initial work provides a suitable baseline upon which to build further, more complex experiments dealing with a greater number of deformation mechanisms.
ACKNOWLEDGEMENTS
The authors would like to acknowledge the assistance provided by the Manchester X-ray Imaging Facility, which was funded in part by the EPSRC (grants EP/F007906/1, EP/F001452/1 and EP/I02249X/1).
REFERENCES
Bodel, W. (2012). “The relationship between microstructure and Young’s modulus of nuclear graphite.” PhD Thesis, University of Manchester.
Bolte, S. and Cordelières, F. P. (2006) “A guided tour into subcellular colocalization analysis in light microscopy.” Journal of Microscopy224(3): 213-232
Brocklehurst, J. E. and B. T. Kelly (1993). "Analysis of the dimensional changes and structural changes in polycrystalline graphite under fast neutron irradiation." Carbon31(1): 155-178.
Jenkins, G. M., Williamson, G. K. And Barnett, J. T. (1965). “The role of crystal structure in determining the mechanical properties of graphite.” Carbon3: 1-6.
Kane, J. et al (2011). “Microstructural characterisation and pore structure analysis of nuclear graphite.”
Journal of Nuclear Materials415 189-197.
Nightingale, R. E. (1962). “Nuclear graphite”. London, Academic Press.
Ollion, J. et al (2013) “TANGO: A Generic Tool for High-throughput 3D Image Analysis for Studying Nuclear Organization.” Bioinformatics29(14):1840-1.
Palenstijn, W. J., K. J. Batenburg, et al. (2011). "Performance improvements for iterative electron tomography reconstruction using graphics processing units (GPUs)." Journal of Structural Biology 176(2): 250-253.
Smith, M. C. (1964). “Effects of prestrain on the tensile properties of graphite.” Carbon 2:269-274. Taylor, J. E. L., Hall, G. N. and Mummery, P. M. (2015) “The effects of loading stresses on the pore
structures of nuclear grade graphites.” Manuscript in preparation.