ABSTRACT
BAILEY, TIFFANI NICOLE. Tailored Surfaces: Modifying Chemical and Physical Properties at the Liquid/Solid Interface to Address Optimizing Surface Chemistry
Applications. (Under the guidance of Dr. Chris Gorman and Dr. Jan Genzer.)
The research presented in this PhD thesis focuses on surface modification techniques to enhance potentially useful behavior of materials on surfaces. The principal objectives of this work include (1) investigating the physico-chemical phenomena at the liquid/substrate interface to enhance current methods of moving meso- scale liquid droplets (2) developing a polymer brush gradient on silicon to enhance the efficiency in binding and detection of probe molecules and (3) tailoring a poled substrate by electrostatically binding polar molecules to form a molecular assembly. Research was conducted by varying the physical properties of a liquid in motion (including, surface tension, viscosity) and the characteristics of the substrate upon which the liquid moves. The latter will include both physical and “chemical” roughness (i.e., variation of chemical functionalities present at the surface unit) of the substrate.
We also identified an efficient method of increasing DNA immobilization and hybridization. A polymer brush molecular weight gradient was used as a platform for DNA attachment. Fluorescence microscopy was used to obtain relative fluorescence intensity values indicating DNA hybridization and attachment to the polymer backbone. The microscopy technique provided evidence indicating an increase in DNA attachment to the polymer backbone as the polymer chain length increased.
DEDICATION
This thesis is dedicated to my parents, Professor Ronnie and Mrs. Terry Bailey. Thank you for always making me feel like there was no limit to anything I ever wanted to
iii
BIOGRAPHY
Tiffani Nicole Bailey was born in Portsmouth, VA on May 16, 1980 to Ronnie and Terry Bailey. At the age of 1, she and her family moved to the place she considers home in Greensboro, NC. Tiffani has one younger brother, Ronnie Terence Bailey. Tiffani graduated
from Dudley Math, Science and Technology Academy in 1998. She attended Hampton University in Hampton, VA to pursue a degree in Chemistry. As an undergraduate, Tiffani was a member of the American Chemical Society, American Society for Pharmacology and Experimental Therapeutics, Beta Kappa Chi National Scientific Honor Society, Delta Sigma
Theta Sorority, Inc and the Student Government Association. She was also the recipient of awards from the Office of Naval Research, Virginia Air and Space Grant Consortium, National Science Foundation, and the National Organization for the Advancement of Black
Chemists and Chemical Engineers. The author studied abroad in places such as: Oxford University in Oxford, England at the Edgerton University in Kenya, Africa. In 1998, she graduated with honors from Hampton University with a Bachelors of Science in Chemistry.
In the fall of 2002, Tiffani started her graduate career in Chemistry at North Carolina State University located in Raleigh, North Carolina. Under the guidance of Dr. Chris Gorman and Dr. Jan Genzer, Tiffani conducted inter-disciplinary research focused on tailoring surfaces by
ACKNOWLEDGMENTS
First and foremost in the words of K.K. Wong “ I would like to thank God for giving the scientific community such wonderful insights into His creation.” I am grateful for having the
opportunity to be used as a vessel.
I would like to thank my advisors Dr. Chris Gorman and Dr. Jan Genzer (Dr.G). Dr. Gorman, I am pleased to have had the chance to work under your leadership. I have learned how to conduct research, analyze the data, and most of all “make my research tell a story”. Your words of wisdom have helped me become a better chemist. Thank you for your support and guidance. Dr.G, even though I am not a chemical engineer you welcomed me into your group 4 years ago without any hesitation. You have been more than just a boss but a person whom I truly admire as a scientist, professor, and mentor. Thank you for the leadership and the laughs. In addition to my advisors, I would also like to thank all of the past and present members of the Gorman and Genzer groups for your support and assistance.
To my committee members Dr. Ed Bowden and Dr. Christine Grant, I thank you for your assistance and for challenging my abilities to become a better scientist. Dr. Grant words cannot express how thankful I am to have come across your path. Thank you for everything. I would also like to acknowledge the encouragement and support from Dr. Dave Shafer the Assistant Dean of the Graduate School.
v
Lamberth, Dr. Henry Collins, and Dr. Valarie Guthrie, who have supported and encouraged me to pursue a degree in Chemistry because of their own love for the field. Programs such as the NC A&T Saturday Academy, Greensboro Area Math and Science & Education Center Programs, NC A&T Engineers Starter Program, Bennett College Pre-College Program, Florida A & M University Actuarial Science Program and the Ronald E. McNair Program were very instrumental in exposing me to the S.T.E.M. (Science, Technology, Engineering, and Mathematics) disciplines and keeping me in the “pipeline” since the age of 7 years old. While at Hampton University, I had the pleasure of crossing paths of the following instrumental chemistry professors, Dr. Isai Urasa, Dr. Willie Darby, and Drs. Edmond and Grace Ndip, Dr. Ward Mavura and Dr. Joseph Williams.
A special thanks to Tashni-Ann Coote and Ibrahim Bori, friends and colleagues who kept me motivated and determined that we would all would see the finish line in the end. Thank you Shani Smith, Michelle Bowman, and Courtney Hinson for your support during my years as a graduate student.
TABLE OF CONTENTS
List of Tables……….. viii
List of Figures………. xii
List of Schemes………. xiii
Chapter 1: General Introduction and Project Objectives………... 1
1.1 Meso-scale Liquid Transport via Surface Tension Gradient 1.1.1: Surface Wettability and Modifications……… 1
1.1.2: Motion of Liquid on a Chemical gradient ……….. 7
1.2 Surface Modifications: Surface Tethered Polymers 1.2.1 Polymer Thin Films……….. 9
1.2.2 Surface Based Polymerization……….. 10
1.3 Surface Modification: Charge Modification 1.3.1 Polled Lithium Niobate………. 11
1.4 References……….. 13
Chapter 2: Liquid Transport: Modification of Surface Topography to Reduce Friction at the Liquid/Substrate Interface 2.1 Project Goals and Motivation………... 15
2.2 Introduction……….. 15
2.3 Results and Discussion………. 19
2.4 Conclusions………... 24
2.5 Implementation / Experimental 2.5.1 Preparation of Porous Silicon……….. 25
2.5.2 Preparation of F8H2 Gradient on Porous and Flat Surface…. 26 2.5.3 Characterization of the Porous Silicon Surface……… 27
2.5.4 Measurement of Contact Angles and Drop Velocity………… 27
2.6 References……….. 29
Chapter 3: Liquid Transport: Effects of Surface Tension and Viscosity on a Viscous Droplet in Motion 3.1 Project Goals and Motivation……… 31
3.2 Introduction 3.2.1 Mechanisms to Induce Droplet Motion……… 32
3.2.2 Droplet Contact Line Dynamics and Composition………….. 34
3.3 Results and Discussion 3.3.1 Viscous Drop Motion on a Tilted Non-Wettable Solid and Chemical Gradient……….. 36
vii
3.5.1 Surface Preparation……… 49
3.5.2 Contact Angle Measurements……… 49
3.5.3 Measurements of Drop Velocities and Sizes……… 50
3.5.4 Equipment………. 51
3.6 References………..……… 52
Chapter 4: Tailored Surfaces: Polymer Brush Gradients Synthesized via ATRP as a Platform for DNA Immobilization 4.1 Project Goals and Motivation……….. 54
4.2 Introduction……….. 56
4.3 Results and Discussion 4.3.1 Surface Modification and Characterization……….. 58
4.4 Conclusions………71
4.5 Implementation / Experimental 4.5.1 Materials………... 72
4.5.2 ATRP Synthesis of a Surface Initiated Polymerization Gradient………..72
4.5.3 Covalent coupling via 1,1’-carbonyldiimidazole (CDI) reaction……….. 74
4.5.4 Capture Probe Immobilization and DNA Hybridization…….. 74
4.5.5 Instrumentation………. 75
4.6 References……….. 77
Chapter 5: Controllable Nano Patterned Polar Surfaces for Molecular Pattern Formation and Transfer 5.1 Project Goals and Motivation……… 79
5.2 Introduction 5.2.1 Ferroelectric Materials……….. 80
5.2.2 Self Assembly of Polar Materials………. 82
5.3 Results and Discussion 5.3.1 Single Faced Poled Lithium Niobate……… 83
5.3.2 Periodic Poled Lithium Niobate ………... 88
5.4 Conclusions……….. 92
5.5 Experimental 5.5.1 Materials………... 93
5.5.2 Surface Passivation………... 93
5.5.3 Instrumentation………. 94
5.6 References……….. 95
Chapter 6: Summary and Outlook 6.1 Systematic Study of Pore Size for Water Motion on Wettability Gradients. 97 6.2 Movement of liquids containing suspended particles……… 98
6.3 Systematic study on the Weight Capacity of DNA in a Polymer Brush…... 99
LIST OF FIGURES
Figure 1.1 Illustration of a droplet in contact with air and a solid substrate………..2
Figure 1.2 Simplified schematic showing general formation of a
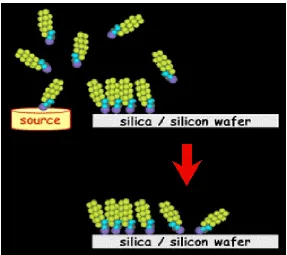
self-assembled monolayer……… 4 Figure 1.3 Illustration of the diffision source molecules to the silica/silicon wafer
from a molecular gradient………..5
Figure 1.4 Illustration of two types of polymer flm formation: grafting onto, and
grafting from……… 9 Figure 2.1 (a)Cross sectional scanning electron microscopy image of porous
silicon. The diagram depicts the outline of the porous region after etching. (b) Relative fluorine concentration on the porous substrate decorated with the gradient in F8H2 self-assembled monolayer as determined from the combinatorial near-edge x-ray absorption fine
structure spectroscopy experiments……….20 Figure 2.2 Advancing (solid symbols) and receding (open symbols) contact
angles of deionized water as a function of the position on the F8H2 molecular gradient created on top of a flat (a) and porous (b) silicon substrate. The volume of the probing liquid was 4 (), 6 (z),
8 (S), 10 (T), and 12 (¡) µl……… 21 Figure 2.3 Capillary number (Ca=v/v*) as a function of the normalized
drop radius (R*=R.∂cos(θ)/∂x) associated with motion of a
droplet of deionized water along the F8H2 molecular gradient created on top of a flat (open symbols) and porous (solid symbols) silicon substrate. During the course of the experiment the drop velocity was collected at multiple positions on the sample. The data presented in Figure 3 have been compiled from the drop velocity data collected at the constant contact angle of water equal to: 70º (V), 65º (U),
60º (1), 100º (), and 80º (z). The lines are meant to guide the eye……..23 Figure 3.1 Diagram represents competing forces acting on a drop: weight or
gravitational forces(A) and capillary forces (B).The weight of the drop is responsible for a downward pull of the droplet, while the
ix
Figure 3.2 Image depicts a 30µL ethylene glycol droplet moving across a
fluorinated gradient on Si. A trail is left behind as the droplet traverses
the gradient substrate………...37 Figure 3.3 Graph depicting variations in surface tension (▲) and viscosity (■) for
aqueous solutions containing various weight percentages of sucrose at 25oC. Both an increase in surface tension and viscosity are shown as the sucrose concentration is increased………...38 Figure 3.4 A graph depicting the relationship between the volume of H2O droplets
(3, 5, 10, 15, and 30µL) and the tilt angle of a fluorinated
homogeneous monolayer on Si substrate required to move them. The graph shows the tilt angle required to induce motion was achieved at
15µL and 30 µL………...40
Figure 3.5: The advancing (• ) and receding ( ■ ) positions of droplets containing varying sucrose concentrations plotted as a function of time. The sucrose concentrations are (A) 0 %, (B) 10 wt %, (C) 20 wt % and
(D) 60 wt %, respectively………42 Figure 3.6: Graph of droplet velocity vs. time for droplets in motion on a
60o tilted substrate. The insert shows a photograph of a 20-wt %
sucrose droplet in motion. Droplets contained (♦) 0 wt %, (■) 10 wt %, (▲) 20 wt % and (×) 60 wt % sucrose in water. Lines are drawn through the symbols merely as a guide to the eye. Velocity is measured
immediately at the onsite of motion during liquid/ substrate interaction……43 Figure 3.7: Graph of droplet velocity vs. time graph for droplets in motion on an
F8H2 gradient. Droplets contained (♦) 0 wt %, (■) 10 wt %,
(×) 22wt %, (●) 36 wt % and (▲) 42 wt % sucrose in water. Faster motion for the 22 wt% solution resulted in collection of fewer points.
Lines are drawn through the symbols merely as a guide to the eye…………44 Figure 3.8: Graph of velocity vs viscosity on a 60o tilted substrate. 30uL droplets
of 0, 10, 22, 36, 42, 50, 58 and 60wt% of sucrose were used……….45
Figure 3.9: Depicts Ca vs Boα of 30uL droplets moving on varying inclination
angles (20,40and 60o )………..47
Figure 3.10: Depicts an angle tilt apparatus. The figures include dimensions and set up…51 Figure 4.1: Provides the dry thickness polymer brush profile using ellipsometry
Figure 4.2: FT-IR spectra of hydroxy stretching region plotted as a function of time. Hydroxyl groups were monitored for pHEMA (a),
pHEMA/CDI 2hrs (b), pHEMA/CDI 6hrs (c) and pHEMA/CDI 27hrs (d)…62 Figure 4.4: FTIR spectra of a pHEMA brush attached to a Si substrate before
and after reaction with fluoresceinamine……….64 Figure 4.5: Graph showing fluorescence intensity vs dry pHEMA thickness plot
for fluoresceinamine attachment to a functionalized pHEMA gradient……..65 Figure 4.6: Fluorescence micrographs (top) and corresponding intensity
depicts a.unreacted pHEMA and b-d pHEMA after grafting with DNA probe and complimentary strand via CDI coupling for
63.5 (nm), 37.0 (nm), 21.3 (nm)………..68 Figure 4.7: Graph shows fluorescence intensity vs polymer thickness
data for hybridization of complimentary () and
non-complimentary ( ) DNA on target DNA modified polymer
gradient. The single data point at zero. Dry pHEMA thickness
indicates the Background for both samples……….69
Figure 4.8: Atomic force microscopy images DNA coated Gold nanoparticles in a low (22-38nm) and high molecular weight polymer brush (62-74nm). In the low molecular weight regime the density of particles is 18.205 µm3 vs that of the high molecular weight
regime of 7.843µm3……….71
Figure 4.9: Illustrates the apparatus designed to systematically vary molecular weight and or grafting density on a substrate……….73 Figure 5.1: Illustration is shown of the domain directions of a periodically poled
lithium niobate. The Eapp arrow indicates the direction in which the
electric field is applied……….81 Figure 5.2: X-ray photoelectron spectra at a takeoff angle of 90o of poled lithium
niobate positively and negatively charged surfaces after vapor phase exposure to bromo acetic acid (Br2CH2CO2H). Representative peaks of Nb and Br are indicated. The Br2CH2CO2H self assembled monolayer was formed under the following conditions
(temperature 120oC, vapor pressure 60 torr for 1hr). The Br/Nb (+)
/ Br/Nb (-) intensity ratio was 3.9 to 1………85 Figure 5.3: X-ray photoelectron spectra at a takeoff angle of 90o of poled lithium
xi
of Nb and Br are indicated. The Br/Nb (+) / Br/Nb (-) intensity ratio
was .749/.45………86
Figure 5.4: X-ray photoelectron spectra at a takeoff angle of 90o of poled lithium niobate positively and negatively charged surfaces after vapor phase exposure to bromo acetic acid (Br2CH2CO2H). Representative peaks of Nb and Br are indicated. The Br2CH2CO2H self assembled monolayer was formed under the following conditions(temperature 100oC, vapor pressure 105 torr for 1 hr). The Br/Nb (+) / Br/Nb (-) intensity ratio was .295/.137……….87
Figure 5.5: Diagram of periodic poled LiNbO3 as purchased. Illustration (left) indicates the spacing and charge between each periodically poled domain. The right illustration provides the aerial view of the entire periodically poled sample on a single lithium niobate surface………88
Figure 5.6: TOF-SIMS images of a. Br, b. CH, c. H, d. OH (negative)………....90
Figure 5.7: TOF-SIMS images of a. H, b. Br, c. OH, d. C (negative)………..91
LIST OF TABLES
Table 3.5.1: Contact angle measurements (o) of deionized water, sucrose and glucose…..50
xiii
LIST OF SCHEMES
Scheme 4.1: Schematic illustration of oligonucleotide attachment via carbonyldiimidazole coupling to surface anchored polymer. DP
represents DNA capture probe. DC represents the complimentary strand to DP with a fluorophore attachment………...55 Scheme 4.2: Depicts the synthetic route to forming
poly(hydroxyethylmethylmethacrylate)………...59 Scheme 4.3: Schematic formation of carbonyldiimidizaole attachment to the
polymer brush backbone………..63 Scheme 5.1: Illustration of the process used to create electrostatic interaction
Chapter 1: General Introduction and Project Objective:
The work presented in this PhD dissertation is centered on surface modification techniques used to enhance potentially useful behavior of material on surfaces. The topics discussed include liquid transport on a surface and surface tethered polymers used for DNA binding. This dissertation will also explore the possibility of selective binding of polar molecules to polarized, ferroelectric surfaces as a new motif for self-assembly. These three areas of research are each unified by a simple concept: tailoring the surface to optimize behaviors in surface chemistry applications.
1.1: Meso-scale Droplet Motion Via Surface Tension Gradient
1.1.1: Surface Wettability and Modifications
Wetting is among the many properties of a surface that can be tailored for a specific application1 The wettability of a surface by a liquid is defined by the point of contact
between a droplet on a horizontal surface. The spreading parameter of a liquid on a substrate (S) relates to the wettability of the substrate and the wettability of the substrate by the liquid
is related to the interfacial energies (γ ) at the interfaces between the solid(s), liquid (l) and air
(v) interface (1) as given by equation 1 below. 1
S = γsv - (γsl + γlv ) (1)
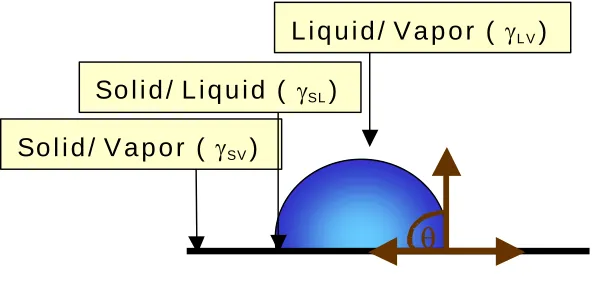
distinct droplet shape is produced which can be defined by the contact angle that the droplet makes at three-phase boundary between the solid, liquid and vapor (Figure 1.1)
Liquid Solid/ Vapor ( γSV)
Solid/ Liquid ( γSL)
Liquid/ Vapor ( γLV)
θ
Figure 1.1: Illustration of a droplet in contact with an air and a solid substrate. Θ represents a
static contact angle.
Young’s equation correlates the surface tensions at the solid –liquid (γ sl), solid-vapor (γ
sv), and liquid-vapor (γ lv) phase to the equilibrium contact angle (θe) (2).
cosθ γ γ
γ
e
sv sl
lv
= − (2)
This equilibrium contact angle assumes a flat, defect-free, non-reconstructing surface. Most “real” surfaces have chemical or physical defects or a combination of both. In order to assess the defects in terms of contact angle, the difference between the advancing and receding
contact angles is considered .3,4 The advancing contact angle (θa) is measured by inflating the
Conversely, removing liquid from the droplet and measuring the contact angle provides the receding value (θr). The difference between the advancing and receding contact angles is
called the contact angle hysteresis (CAH). CAH is thus a measure of the “ideality” of the
surface. “Perfect surfaces” have CAH≈0. In contrast, large positive CAH values (the
advancing CA is always higher than the receding (CA) indicate that the surface contains some physical or/and chemical heterogeneity.4
Substrate
Head Groups Carbon Chain
Backbone
Tail Groups
Substrate
Head Groups Carbon Chain
Backbone
Tail Groups
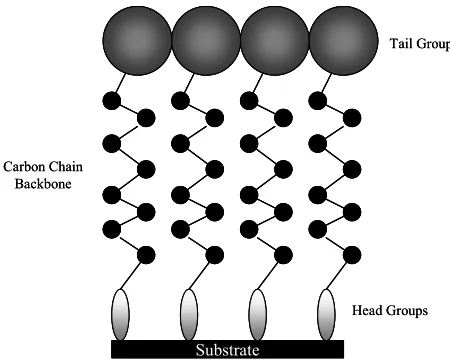
Figure 1.2: Simplified schematic showing the general formation of a self-assembled monolayer
The organization of the self-assembling molecules in SAMs is governed by the interplay between the packing of the molecules on the substrate, the interaction of the molecular head groups with the substrate and any interactions between the molecular terminal groups both with each other and with any liquids of vapors in contact with the SAM-modified surface.
Alkanethiol molecules are commonly used in the fabrication of a self-assembled monolayer. These molecules are comprised of an alkyl chain with a sulfur end group. Sulfur chemically bonds to gold and silver surfaces. Therefore when the alkanethiol comes in contact with either surface, the molecules self assemble to form a monolayer.
produces a monolayer by simply placing the substrate into the reactant solution for a controlled period of time. The vapor deposition technique consists of a substrate strategically positioned near the reactant solution. The substrate can be placed either upside-down (thus facing the source of the diffusing molecules) or along side of the source. In the work described in this thesis, the latter method will primarily be used to make an in-plane homogeneous SAM layer. Further, the vapor deposition approach can be modified to vary the molecular coverage across the surface of the substrate (Figure 1.3). In this technique, the substrate will be placed horizontally next to a diffusing source comprising the SAM precursors. As the molecules leave the diffusing source, they form a concentration gradient in the vapor phase, which subsequently “imprinted” onto the substrate thus forming a monolayer with position-dependent concentration of molecule in the SAM.
Molecular gradients are of interest because of the wide variety of applications which can be used such as selective adsorption, 11,12 gradient templating, 13-16 controlled motion of liquid droplets, 9,17 particle sorting, 18 and many others. Thus developing techniques that lead to the formation of molecular gradients have been extensively reported.11, 19-21 These include vapor deposition, soft lithography techniques and mechanical distribution techniques 7,8 Choi and Newby developed a contact printing technique that produced a micrometer-scale gradient surface using an elastomeric stamp.6 Creation of a “double molecular gradient” has also been shown by Genzer et al.7 Double molecular gradients are formed using two sources of reactants, which diffuse across a single substrate.
1.1.2 Motion of Liquid on Gradients
Wettability gradients can facilitate the motion of liquids across a substrate as the result of the variability in the interfacial energy between the substrate and the liquid.8If the droplet of liquid is large enough to experience a sufficient variability across it, an imbalance of surface tension forces on opposite sides of a droplet will promote its movement to the region of lower interfacial energy.1 For droplet motion to occur, it is not only imperative to design a proper wettability gradient but also to have a low contact angle hysteresis. Droplet motion should occur when “the minimum receding contact angle at one edge of the drop is greater than the maximum advancing contact angle at the other edge”. 8 A large hysteresis
increases the difference between the advancing and receding edge of the drop, which, in turn, slows down or completely inhibits the movement of the droplet.
In 1992 Chaudhurry and Whitesides were able to create an imbalance of surface tension forces on a droplet9 by producing a wettability gradient that propelled the water droplet up an inclined plane. The gradient was prepared using a silicon substrate and n-octyldecyl trichlorosilane (OTS) SAM with the vapor deposition technique. Bain and Ondarcuhu reported that rapid motion of liquids over longer distances was achievable if a wettability gradient was created dynamically by a chemical reaction at the liquid/solid interface. 10,11
developed an electrochemical method using a redox-active surfactant based on ferrocene. A reduction of ferrocinium to ferrocene lowered the hydrophilicity of the surface, thus generating a surface tension gradient. The surface tension gradient then could be used to pump liquids reversibly along a channel. 12 In a second example of a dynamically adjustable gradient, Ichimura and coworkers used a photoresponsive molecular gradient and ultraviolet (UV) light to develop a reversible method for droplet motion.13 Both the direction and velocity of the droplet in motion were controlled by varying the direction and steepness of the gradient in light intensity. A surfactant containing a light sensitive azobenzene moiety was physisorbed to a substrate. Exposure to UV light caused the azobenzene moiety to isomerize between its cis and trans forms. Azobenzene has one of two isomeric states (cis or trans) depending on the wavelength of light used to illuminate the surface. When UV radiation of 365nm was shined on the monolayer, the trans isomer absorbed this light and was transformed to the cis isomer. This process could be reversed. The cis isomer could be transformed to the trans isomer by applying a wavelength of 436 nm.
In another example, Daniels, et al reported an increase in the velocity of a drop on a surface due to a wettability gradient in the presence of condensation.13 More specifically, the coalescence of droplets in conjunction with the fast removal of heat from steam condensing on a gradient surface resulted in droplet speeds ranging from 20 to 40 µm/s. These
1.2: Surface Modifications: Surface Tethered Polymers
1.2.1: Polymer Thin Films
In the discussion above, small molecules of discrete size were used as the components of a thin film. An alternative for the modification of a surface is to alter its physico-chemical properties is the application of a thin polymer film. These tailored surfaces are used, for examples, for corrosion resistance, responsive materials, and photolithographic masks.25 Polymer thin films can be physisorbed or chemisorbed to a material surface. Polymer films from solution can be obtained by using spin casting or dip-coating methods. Another approach is growth of the polymer film off of the surface using a surface-bound polymerization initiator that can react with monomer molecules exposed to it (See Figure 1.4) Both techniques are widely used and have different capabilities and attributes.
1.2.2: Surface Based Polymerization
Surface tethered polymers consist of polymers with reactive end groups being grafted onto or from surfaces, resulting in a “polymer brush”. Polymer brushes formed by grafting “onto” a substrate are generally prepared via chemical bond formation between reactive groups on the surface and reactive end groups on the polymer chain. This technique has the advantage of a well-characterized chain length of the grafted polymer. However, due to steric hindrance of the reactive surface sites, this technique provides low grafting density of the polymer chains to the surface. Polymer brushes grafting “from” or surface- initiated polymerizations are used to overcome the low grafting density. In order to form high surface density tethered polymer chains, surface-bound polymerization initiators formed via self-assembled monolayers are exposed to a monomer solution, resulting in a high surface density of tethered polymer chains.
To achieve maximum control over brush density and composition, a controlled polymerization is highly desirable. Several controlled polymerization techniques have been used to grow polymer brushes including living ring opening polymerization, living cationic polymerization, reversible addition- fragmentation chain transfer polymerization and atom transfer radical polymerization.26 Of these, controlled living radical polymerizations have become the most favored route due to less stringent experimental conditions as well as the compatibility with a wide range of functional monomers. Section 4.2.1 discusses atom transfer radical polymerization in detail.
The conformation of the surface tethered polymers can be very important in governing the behavior of the polymer coating in a given application and depends upon the environment around the polymer brush. Good solvent conditions (favorable interaction between the monomer and solvent molecules) form an expanded coil. The favorable interactions between the molecules supercede that of the loss of entropy due to chain stretching. Inversely, polymer brushes in poor solvents form a collapsed globule. There is an intermediate between good and poor solvent environments, which takes the shape of a mushroom conformation. However, in applications it is not always useful or possible to control polymer conformation with environmental variables. Thus, it is desirable to design a system that dictates the conformation by controlling the molecular weight and the grafting density of the polymer chains to the surface. To this end, Tomlinson et al designed a gradient substrate to vary the properties of the polymer surface continuously across the substrate between two extreme values.27 They used a solution draining method of exposing the initiated surface to the monomer solution, thus forming a gradient of initiator density. The steepness of the gradient was determined by the reaction time of the polymerization. The system can be used to vary molecular weight and grafting density on a single sample. In Chapter 4, this system will be used to vary the polymer brush thickness in preparation for DNA attachment.
1.3: Surface Modifications: Charge Modification
1.3.1: Polled Lithium Niobate
nonlinear optical properties, which are of increasing interest as the area of integrated optics continues to expand. Lithium niobate is already being recognized as a metal oxide of choice for several industries because high quality single crystals can be grown reproducibly. Single crystals of LiNBO3 are uniaxal crystals, with a polarization vector that can align in two
1.4: References
1. DeGennes, P.; Brochard-Wyart, F.; Quere, D. Capillarty and Wetting
Phenomena; Springer Press: NY, 2002. 2 Brochard, F. Langmuir 1989, 5, 432.
3. Ulman, A. An Introduction to Ultrathin Organic Films; Academic Press: CA, 1991.
4. Dertinger, S.; Jiang, X.; Li , Z.; Murthy, V.; Whitesides, G. M. Proc Natl Acad
Sci 2002, 99, 12542-12547.
5. Chaudhurry, M. K.; Whitesides, G. M. Science 1992, 256, 1539.
6. Bain, C. D.; Burnett-Hall, R.; Montgomerie Nature 1994, 372, 414.
7. Ruardy, T. G.; Schakenraad, J. M.;van der Mei, H. C.; Busschner. H. J. Surf. Sci. Rep. 1997, 29, 3.
8. Clare, B. H.; Efimenko, K.; Fischer, D. A.; Genzer, J.; Abbott, N.L. Chem. Mater. 2006, 18, 2357
9. Bhat, R. R.; Fischer, D.A.; Genzer, J. Langmuir 2002, 18, 4142 10. Plummer, S. T.; Bohn, P. W. Langmuir 2002, 18, 4142
11. Bhat, R. R.; Chaney, B. N.; Rowley, J.; Liebmann-Vinson, A.; Genzer, J. Adv Mat., 2005, 17, 2802
12. Bhat, R.R.; Tomlinson, M. R.; Genzer, J. Macromol. Rapid Commun. 2004, 25,270
13. Daniel, S.; Chaudhury, M.K.; Chen, J.C. Sience 2001,291 633
16. Genzer, J. Molecular gradients: Formation and applications in soft condensed matter science. In Encyclopedia of Materials Science; Buschow, K. H. J., Cahn, R.W., Flemings, M.C., Ilschner, B., Kramer, E. J., Mahajan, S., Eds,; Elsvevier: Oxford, 2002
17. Genzer, J. ; Bhat, R.R.; Wu, T.; Efimenko, K. In Molecular gradient nanoassemblies; Nalwa, H. S., Ed.; American Scientific Publishers: Stevenson Ranch, CA, 2004.
18. Genzer, J. J. Adhe. 2005, 81 ,417
19. Genzer, J.; Fischer, K.; Efimenko, K. Applied Physics and Letters 2003, 82, 266. 20. Bain, C. ChemPhysChem 2001, 2, 580.
21. Choi, S.; Newby, B. Langmuir 2003, 19, 7427.
22. Ondarcuhu, T.; Domingues Dos Santos, F. Phys.Rev.Lett. 1995, 75, 2972. 23. Shin, J. Y.; Abbott, N. L. Langmuir 1999, 15.
24. Ichimura, K.; Oh, S. K.; Nakagwa, M. Science 2000, 288, 1624.
25. Garbassi, F., Morra, N., Occhiello, E., Polymer Surfaces: From Physics to Technology, ( J. Wiley & Sons, New York)
26. General Reference of polymerization techniques
Chapter 2: Liquid Transport: Modification of Surface Topography to Reduce Friction at the Liquid/Substrate Interface
This chapter has appeared in publication form
Petrie, R.; Bailey, T.; Gorman, C.; Genzer, J. Langmuir, 2004,20 9893-9896
2.1 Project Goals and Motivation
In this chapter, the motion of water droplets on surfaces decorated with molecular gradients comprising semi fluorinated (SF) organosilanes is described. SF molecular gradients deposited on flat silica substrates facilitate faster motion of water droplets relative to the specimens covered with an analogous hydrocarbon gradient. Further increase in the drop speed is achieved by advancing it along porous substrates coated with the SF wettability gradients. The results of our experiments are in quantitative agreement with a simple scaling theory that describes the faster liquid motion in terms of reduced friction at the liquid/ substrate interface.
2.2 Introduction
the lower contact angle because of the imbalance of surface energies acting on various parts of the droplet and the tendency of the droplet to establish a new equilibrium. Chaudhury and Whitesides demonstrated this concept of controlled drop motion driven by variable wettability originating from the substrate. They showed that a liquid drop can move along a wettability gradient and in some circumstances can even climb up an inclined plane.1 In their seminal paper, Chaudhury and Whitesides also recognized the importance of contact angle hysteresis, i.e., the difference between the advancing and receding contact angles, on the drop motion. Specifically, they identified that liquid movement occurs when the receding contact angle of the back (receding) edge of the drop is larger than the advancing contact angle of the front (advancing) edge of the drop. However, contact angle hysteresis will serve to reduce the difference between the advancing and receding edge of the drop, therefore possibly slowing or halting drop motion. To overcome the latter problem, Daniel and Chaudhury used an external force by supplementing the chemical gradient driving force with an in-plane vibration of the drop.2 They demonstrated that substrate vibration helped to overcome the relatively large contact angle hysteresis (≈20°) thus increasing the drop velocity up to ≈5
times.
Recently, Daniel and coworkers provided more insight about the various molecular parameters that influence the motion of liquid drops on chemically heterogeneous surfaces.3
They argued that the drop velocity (v) is related to the surface tension of the liquid (γ), the radius of the droplet on the surface (R), and the position-dependent change of wettability: 2,3,4
( )
dx d R v
s
θ η
γ cos
≅ . (1)
In Equation (1) θ is the contact angle of the liquid with the substrate and ηs represents a
capillary number as Ca=v/v*=vη/γ, where v* equals the surface tension (γ) divided by the
liquid bulk viscosity (η), Equation (1) can be rewritten as:
( )
K R*dx cos d R K
Ca = ⋅ θ = ⋅ , (2)
where the coefficient K accounts for the corrections to η due to the frictional forces at the
liquid/solid interface, and
( )
dx cos d RR* = θ . Daniel and coworkers demonstrated the general
validity of Equation (2) by studying the motion of droplets of various liquids on surfaces covered with a molecular gradient made of self-assembled monolayer of H3C (CH2) 9SiCl3
(H10-SAM) prepared on flat silica-covered substrates. Data of Ca vs. R* from 4 different liquids had approximately identical slopes, indicating that K was very similar in all cases studied and was presumably dictated primarily by the surface energy of the substrate. They also established the effect of the contact angle hysteresis on the droplet motion. Daniel and coworkers showed that in the Ca vs. R* plot the hysteresis appeared to cause only a change in the intercept in the data but not the slope. By utilizing this approach, the researchers were able to visually separate the effect of friction and contact angle hysteresis on drop motion. Specifically, the findings of Daniel and coworkers indicate that, regardless of the hysteresis, the velocity of the droplet will increase (hence the slope in the Ca vs. R* plot increases) when the friction at the liquid/solid interface decreases.
move faster, relative to the motion of a droplet moving on an analogous hydrocarbon surface. Moreover, the friction may be further decreased at the liquid/solid interface by utilizing substrates with small pores that cannot be wet by a moving liquid. Quéré and Bico have shown that wettability at the liquid/solid interface can be lowered if air is trapped below the liquid in the holes of the rough surface. In such a situation, the liquid positions itself on the surface in a similar fashion as an Indian “fakir” lying on the points of a bed of sharp nails.16,
17, 18 The contact angle (θ*) of a “fakir” droplet residing on such physically rough substrates
is given by: 16
( )
1(
cos( )
1cosθ* =− +φ θ +
s
)
, (3)where φs is the fraction of the liquid/solid interface below the drop. Such a situation should
facilitate a decrease in the friction and a corresponding increase in velocity of the droplet because of the decreased contact area at the liquid/solid interface.
2.3 Results and Discussion
PSi
PSi Si
Si
25 20 15 10 5 0
-10 -8 -6 -4 -2 0 2 4 6 8 10
x (m m
) y
(mm)
a. b.
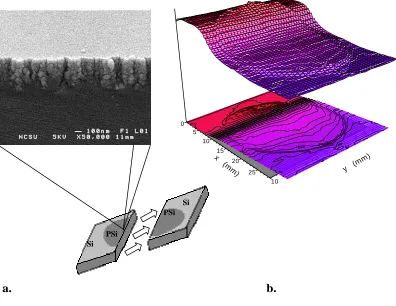
Figure 2.1: (a) Cross sectional scanning electron microscopy image of porous
silicon. The diagram depicts the outline of the porous region after etching. (b) Relative
fluorine concentration on the porous substrate decorated with the gradient in F8H2
self-assembled monolayer as determined from the combinatorial near-edge x-ray absorption fine
structure spectroscopy experiments.
Given the previous emphasis on contact angle hysteresis, a comparison of the
wettability of both the flat and porous surface was established using contact angle
measurements. In Figure 2.2 we plot the advancing (θa) and receding (θr) contact angles of
deionized water on both the flat and porous gradient surface. These angles were determined
with the aid of imaging software from dynamic water contact angles measured at various
contact angle hysteresis (CAH). In this work, CAH is defined as (cos θa – cos θr). The
experimental values for CAH averaged across the substrate are 0.44 (±0.025) and 0.58
(±0.023) for the flat and porous substrates, respectively. Thus, the CAH is slightly higher on
the porous substrate than on the flat substrate. This fortuitous behavior allows us to determine whether friction or CAH is most important in governing drop velocity across the gradient.
0 2 4 6 8 10 12
20 30 40 50 60 70 80 90 100 110 120 130
0 2 4 6 8 10 12
a) Unetched Si b) Porous Si
θ DI
W
(deg)
Position on substrate (mm)
Figure 2.2: Advancing (solid symbols) and receding (open symbols) contact angles of deionized water as a function of the position on the F8H2 molecular gradient created on top of a flat (a) and porous (b) silicon substrate. The volume of the probing liquid was 4 (), 6 (z), 8 (S), 10 (T), and 12 (¡) µl.
Because v* (=γ/η) is the same in all our experiments, the slope of the Ca (=v/v*) vs.
R* plot provides a direct measure of the drop velocity. These slopes can be assessed from Figure 2.3, which shows the dependence of the capillary number on R* for water droplets of
various volumes (4 -12 µL) moving across flat (open symbols) and porous (solid symbols)
substrates covered with the F8H2-SAM gradient. First, we compare the velocities of water droplets moving on flat substrates decorated with F8H2 gradients to those of the analogous
hydrocarbon gradient.3 The slopes in the Ca vs. R* plots are ≈0.015 and ≈0.007 for the F8H2
specimen and the hydrocarbon gradient, respectively, revealing the velocity of water drop is approximately twice as high as the F8H2 substrate relative to that on the H10 gradient. Next, we use the same analysis to determine how incorporating porosity into the substrate affects the drop velocity. The data in Figure 2.3 reveals that water droplets move faster along the F8H2 gradient created on the porous substrate relative to the F8H2 gradient on flat silica. The graph of Ca vs. R* shows that the slope corresponding to the motion on the porous
0.18 0.20 0.22 0.24 0.26 0.28 0.30 0.0000
0.0005 0.0010 0.0015 0.0020 0.0025 0.0030 0.0035 0.0040
Ca
R*
Figure 2.3: Capillary number (Ca=v/v*) as a function of the normalized drop radius (R*=R.∂cos(θ)/∂x) associated with motion of a droplet of deionized water along the F8H2
molecular gradient created on top of a flat (open symbols) and porous (solid symbols) silicon substrate. During the course of the experiment the drop velocity was collected at multiple positions on the sample. The data presented in Figure 2.3 have been compiled from the drop velocity data collected at the constant contact angle of water equal to: 70º (V), 65º (U), 60º (1), 100º (), and 80º (z). The lines are meant to guide the eye.
for the data collected on porous and flat substrates reveals that the CAH is approximately the same in both cases. This observation is in accord with our earlier conclusion, namely that the CAH on the porous substrate is similar to or slightly larger than that on the flat substrate (cf. Figure 2.3). Hence, the rapid increase of the drop velocity on the porous substrate relative to that on the flat surface must originate from a different effect, namely the reduced frictional forces at the liquid/substrate interface (cf. Equation 2).
2.4 Conclusions
Although there are some controversies regarding the friction of fluorinated surfaces,
14,15 self-assembled monolayers made of fluorine-containing species are believed to provide
surfaces with lower surface energy and lower friction. Our results seem to confirm the notion that the F8H2 surfaces possess lower friction and thus facilitate higher speeds of water droplets. Reduced friction at the liquid/substrate interface is also responsible for the observed faster motion of water droplets on porous substrates, relative to flat surfaces. Using
the water contact angle on a homogeneous F8H2-SAM on the flat substrate (θ = 102o) and
the corresponding contact angle of an F8H2-SAM on the rough substrate (θ* = 125o), the
fraction of the liquid/substrate interface below the drop (φs) is ≈0.5 (cf. Equation 3). Based
on the work of Beake and Leggett, who established that the frictional forces on substrates made of mixed self-assembled monolayers scaled approximately linearly with the cosine of the contact angle, 20 we expect that the frictional forces between the drop and the textured substrate will reduce ≈1/φs times.21 Hence, the slope in the Ca vs. R* plot for motion on the
2.3, the slopes are 0.035 and 0.015 for the rough and flat substrates, respectively, which gives a ratio of ≈2.3, in reasonable agreement with the predicted value of ≈2 (1/φs).
In spite of the simplicity of this scaling model (for convenience, we have neglected any additional contributions to the friction, such as the line tension at the air/liquid/solid interface), our analysis strongly suggests that the decreased contact area between the liquid and the porous substrate leads to the decreased frictional forces between the droplet and the substrate and results in the faster motion of droplets on the rough substrates relative to that on flat specimens. Combining chemical gradients with surface roughness offers a powerful method for controlling the movement of liquids on surfaces. For example, applications of rough surfaces for liquid movement may facilitate enhanced liquid removal capabilities. Advancements have been made in applying a thin non-wettable coating on windshields to remove rain droplets on vehicles, aircrafts, and virtually any glass surface. By tailoring the porosity of the glass this could in turn remove moisture droplets and contaminants at a faster pace and with greater efficiency. More in depth studies are underway to better understand the mechanism of motion for rough substrates.
2.5 Implementation / Experimental
2.5.1 Preparation of Porous Silicon
The cell compartment that contains the silicon and the etching solution is illuminated with 50mW/cm2 of white light from a fiber optic light source (Model I-150, Coherent, Inc.). While illuminated, about 4.6 mA/cm2 of constant current is passed through the cell chamber for one minute. After the etching process, the porous silicon sample is washed with absolute ethanol and dried under a nitrogen stream.
2.5.2 Preparation of F8H2 Gradient on Porous and Flat Surface
Our method closely follows that suggested by Chaudhury and Whitesides.1 First, the substrate (porous or flat) was treated in an ultraviolet/ozone (UVO) chamber (Model 42, Jelight Company, Inc) for 20 minutes in order to generate a large number of the surface-bound hydroxyl groups necessary for the attachment of the semifluorinated organosilane molecules. A mixture of heptadecafluoro-1, 1,2,2-Tetrahydrodecyl trichlorosilane (95%, F8H2, Gelest, Inc.) and paraffin oil (1:3 w/w) was placed in a small container, which was positioned near the edge of the UVO-treated silicon substrate. During the gradient formation, the system was maintained in an enclosed chamber with controlled temperature
(22-24°C) and humidity (40-50%). As the F8H2 molecules evaporated, they diffused in the
2.5.3 Characterization of the porous silicon surface
Combinatorial near-edge x-ray absorption fine structure (NEXAFS) spectroscopy measurements provided information about the spatial concentration of fluorine on the porous substrate.18 The experiments were performed at the National Synchrotron Light Source at Brookhaven National Laboratory. The samples were placed onto a four-degree of freedom goniometer, which allowed X-Y in-plane scanning of the sample in the soft x-ray beam. The partial electron yield (PEY) signal originating from the specimen was collected as a function the X and Y coordinates at the fixed angle between the sample surface and the electric vector
of the x-ray beam (=55°) at the three different energies of the x-rays: 680 eV (K pre-edge of
fluorine), 692 eV (1s →σ*C-F), and 720 eV (K post-edge of fluorine). The plot in Figure 1b
was generated by standard normalization of the PEY data using the pre-, post-edge, and the
1s →σ*C-F data.19
The morphology of the porous silicon specimens was probed using a scanning electron microscope (SEM, model Hitachi S-3200). Prior to the SEM experiment, the sample was sputter-coated with gold.
2.5.4 Measurement of contact angles and drop velocity
camera is that is was relatively slow speed and only had the ability to capture about 15 frames per second. The slow speed of the CCD camera resulted in the estimation of the position of the drop and thus created relatively wide scatter of the velocity data in the v/v* vs. R* plot.
Acknowledgments
2.6 References
1) Chaudhury, M.K.; Whitesides, G.M. Science 1992, 256, 1539.
2) Daniel, S.; Chaudhury, M.K. Langmuir 2002, 18, 3404.
3) Daniel, S.; Sircar, S.; Gliem, J.; Chaudhury, M.K. Langmuir 2004, 20, 4085.
4) Greenspan, H.P. J. Fluid Mech. 1978, 84, 125.
5) Ondarcuhu, T.; Veyssie, M. J. Phys. (Paris) II 1988, 1, 75.
6) Brochard, F. Langmuir 1989, 5, 432.
7) Domingues Dos Santos, F.; Ondarcuhu, T. Phys. Rev. Lett. 1995, 75, 2972.
8) Ichimura, K.; Oh, S.-K.; Nakagawa, M. Science 2000, 288, 1624.
9) Daniel, S.; Chaudhury, M.K.; Chen, J.C. Science 2001, 291, 633.
10) Lee, S.-W.; Laibinis, P.E.; J. Am. Chem. Soc. 2000, 122, 5395.
11) Suda, H.; Yamada, S. Langmuir 2003, 19, 529.
12) Choi, S.-H.; Zhang-Newby, B-m. Langmuir 2003, 19, 7427.
13) Bain, C. ChemPhysChem 2001, 2, 580.
14) Perry, S.S.; Lee, T.R. Langmuir 1999, 15, 3179.
15) DePalma, V.; Tillman, N. Langmuir 1989, 5, 868.
16) Bico, J.; Thiele, U.; Quéré, D. Coll. Surf. A 2002, 206, 41.
17) Quéré, D.; Lafuma, A.; Bico, J. Nanotechnology 2003, 14, 1109.
19) Genzer J.; Fischer D. A.; Efimenko K. App. Phys. Lett. 2003 82, 266
20) Beake, B.D.; Leggett, G.J. Phys. Chem. Chem. Phys. 1990, 1, 3345.
21) Here we neglect any additional contributions to the friction arising from the line tension.
Chapter 3: Liquid Transport: Effects of Surface Tension and Viscosity on a Viscous Droplet in Motion
3.1 Project Goals and Motivation
In today’s society, there is growing interest in fundamental information on the physical parameters such as wetting and transport behavior of fluids that are made of two or more components. Physical properties such as surface tension and viscosity influence engineering and product design in many industrial applications such as food engineering, cosmetics, detergents, and coatings. Surface tension and viscosity are of importance because they affect the shape and hydrodynamic behavior of liquid droplets on surfaces. A low surface tension droplet on a substrate is indicative of strong molecular attractions at the liquid/solid interface and weak intermolecular forces within the liquid, which induce drop spreading. Viscosity describes a fluid’s internal resistance as a result of interactions between liquid molecules. As stated previously, viscosity is a force that impedes droplet motion. Thus, the motion of a droplet on a hydrophobic surface is expected to increase as surface tension increases but decrease with increasing viscous force. Because liquid motion is important in a variety of processes, many research efforts have been centered on modifying the surface tension and viscosity of a solution with the intent of controlling this behavior.
to control the motion of the droplet by adding an appropriate amount of an additive to the liquid.
Although chemical additives are commonly used to modify both the surface tension and viscosity of a solution, they also alter the composition of a homogeneous liquid. Introducing a chemical additive to a solution creates new molecular interactions within the combine solution, which can lead to changes in the molecular behavior at the liquid solid interface. This chapter will detail results on the effects of surface tension and viscosity of droplets in motion and provide insight on how homogeneity within a droplet affects its motion.
3.2 Introduction
3.2.1 Mechanisms to Induce Droplet Motion
The effect of both viscous and surface tension forces on the hydrodynamic droplet velocity has been predicted theoretically. Huethrost and Mara derived expressions for viscous and surface tension forces that oppose droplet movement down an inclined surface.2
Their theoretical models provided a basis for experimental studies on drop motion on an incline. Subramanian et al. also provided a theoretical analysis of hydrodynamic resistance using the wedge approximation and lubrication theory.3 They concluded that the approximations for hydrodynamic force could be used to predict the quasi-steady state speed, independent of the driving force used to initiate the motion of the droplet.
modifications can be made on the substrate. In order to evaluate the effects of surface tension and viscosity on a droplet in motion, we address both mechanisms of induced motion. Within the scope of this paper, two general approaches to droplet motion will be pursued using a chemical gradient and tilted plane.
A common driving force for droplet motion involves creating a wettability gradient by chemically modifying a substrate. This phenomenon was first identified by Greenspan and Brochard4,5 and demonstrated experimentally by Chaudhury and Whitesides.6 Subsequently, several experiments have been reported using thermal, electrochemical, mechanical and photochemical methods to affect speed by which the droplet travels on a static wettability gradient.7-13 Recently, Yamada and Tada developed a method for reversible droplet motion by dynamically controlling the wetting gradient on a thin film electrode by applying an in-plane bias voltage to the substrate.14 This work illustrated an electrochemical driving force for liquids of varying viscosities.
In this chapter, both a tilted plane and a chemical gradient will be used to induce the motion of droplets on a substrate so that the impact of both surface tension and viscosity on velocity can be correlated. By varying the concentration of sucrose in water, we have the ability to increase both the drop viscosity and the surface tension. Using droplet motion, it is documented here how the interplay between surface tension and viscosity influences the velocity of a multi-component viscous drop.
3.2.2 Contact Line Dynamics and Drop Composition of a Moving Droplet
Droplet motion can be coaxed as well as pinned by several factors affecting contact line dynamics.16-19 Natural processes such as raindrop motion on a hydrophobic glass windowpane exhibit droplet motion, which occurs by overcoming surface energy boundaries. Several types of droplet motion can often be seen simultaneously on the same window. These regimes include deformed drops of various shapes as well as drops that break up into lines of much smaller isolated drops. Observation of sliding droplets is a good indicator of a clean (e.g. defect free) windowpane surface. Contamination or marring on the windowpane
results in a spatial variation in the equilibrium contact angle θe.
The Contact angle θe is formed within the liquid at the contact line, where the solid
substrate, the liquid and the gaseous phase meet.16 A simple two-dimensional force balance
Figure 3.1: Diagram represents competing forces acting on a drop: weight or gravitational forces (A) and capillary forces (B). The weight of the drop is responsible for a downward pull of the droplet, while the capillary forces affect the internal flow within the droplet.
θ
A
B
The shape and size of the droplet also dictate droplet motion. Capillary (πrγ (cos θr
-cos θa) and gravity forces (g) dictate the shape and area of contact with the solid of a
stationary droplet on a horizontal substrate and inclined plane. In order for the droplet to retain a spherical shape, its radius must be smaller than the millimetric capillary length (k
-1).17 If not gravity will flatten the droplet. Second, smaller droplets often exhibit pinning on
the solid due to contact angle hysteresis (∆θ= θa-θr), with θa and θr the advancing and
receding contact angles. Pinning occurs when the capillary force is larger than the
gravitational force action on the drop (4/3πR3ρgsinα), where R is the radius of the deposited
drop and α is the tilting angle of the solid.
maintain a constant velocity. However, due to the size and hysteretic effects of smaller droplets, large fluctuations in velocity are often observed.17
Controlling the degree of incline of the substrate with respect to the size of the droplet can be used to transition from a pinned droplet to a moving droplet. A low inclination angle can cause the droplet to remain pinned because of a dynamic critical phenomenon that occurs when the energy barrier due to a defect is not overcome.17 High angles of inclination cause the droplet to move beyond hysteric effects that cause pinning.
Our approach is to determine the optimal angle to incline a plane so that, when droplets rolled down it, gravitational forces overcome pinning. Systematic experiments were conducted to determine the optimal angle incline. In this chapter varying droplets are used down such an incline that the droplets reach a steady velocity determined by the balance between the rate of energy dissipation due to internal forces and the rate of change in gravitational potential energy.
3.3 Results and Discussion
varying viscosities as they travel across the chemical gradient on porous Si. Ethylene glycol was used because it is a homogeneous low surface tension liquid that is commercially available in varying viscosities. In a preliminary experiment conducted with droplets of ethylene glycol on a molecular gradient prepared on porous silicon, we noticed that these drops left material behind as they traveled across the gradient (Figure 3.2). It thus appeared that this liquid wetted the pores as it moved. This wetting is attributed to the lower surface tension of ethylene glycol compared to water. When water drops were studied the trail was not observed.
Figure 3.2: Image depicts a 30µL ethylene glycol droplet moving across a fluorinated
gradient on Si. A trail is left behind as the droplet traverses the gradient substrate.
determining the relationship between viscosity and surface tension in droplet motion and how they affect velocity.
Maintaining a high surface tension is important because it minimizes spreading on a surface. Aqueous sucrose solutions were used because of the ability to modify their viscosity
while maintaining a high surface tension. The physical properties of sucrose/water solutions containing varying weight percentages of sucrose have been reported. Figure 3.3 shows the variation in the viscosity and surface tension of aqueous sucrose solutions as the concentration of sucrose increases. The viscosity of these solutions can be varied substantially, from 1.03 cS at 1 wt% sucrose to 45.5 cS at 60 wt% sucrose. Increasing the weight percentage of sucrose also increases the surface tension of the solution. However, this increase is comparably small (a change of 5.2 %).
10
20
30
40
50
60
0
72
74
76
78
80
0
10
20
30
40
50
60
70
80
γ
( dynes/cm)
Sucrose Wt%
η (
cS)
Figure 3.3: Graph depictng variation in surface tension ( γ , ▲) and viscosity ( η ,■) for aqueous solutions containing various weight percentages of sucrose at 25oC. Both an increase in surface tension and viscosity are shown as the sucrose concentration is increased. Values are taken from a published book of tables.21
To induce droplet motion, two types of substrates were used. In each case, these substrates were functionalized with semi fluorinated molecules of heptadecafluoro-1,1,2,2,-tetrahydrodecyl trichlorosilane (F8H2) that were vapor deposited on silica substrates to create a hydrophobic surface. From our previous work we have found self-assembled
monolayers made of fluorine-containing species provide surfaces with low friction.15 A
component homogenous monolayer. In a second set of experiments, a gradient in which the number of molecules varied in a given area was formed.
0 5 10 15 20 25 30
50 100 150 200 250 300 350 400
60o 70o
360o 360o
A
ngle T
ilit
(d
eg)
Volume of Droplet (µL)
360o
Figure 3.4: A graph depicting the relationship between the volume of H2O droplets
(3, 5, 10, 15, and 30 µL) and the tilt angle of a fluorinated homogeneous monolayer on Si
substrate required to move them. The graph shows the tilt angle required to induce motion
was achieved at 15 µL and 30 µL.
homogeneous F8H2 homogeneous monolayer and tilting the substrate until the droplet rolled off of the substrate. Results from Figure 3.4 indicate for the particular conditions used, the threshold volume required for droplet motion was not reached below 15uL. Droplets with volumes of 15 and 20uL showed movement at 70 and 60o angle tilts. This data shows the physical parameters for the droplet motion on incline experiments. The tilt angle indicates the “slip” angle at which the droplet began to move. A value of 360o indicates the drop on the substrate could be completely rotated without motion.
A 60o inclined plane was used to create a gravitational potential and provide an
0.1 0.2 0.3 0.4 0.5 0.0 0.1 0.2 0.3 0.4 0.5
1 2 3 4 5 6 7 8
Po
s
it
io
n
(
m
m
)
0.1 0.2 0.3 0.4 0.5
Time (s)
0.1 0.2 0.3 0.4 0.5
B
C
D
A
Figure 3.5: The advancing ( •) and receding (■) positions of droplets containing varying sucrose concentrations plotted as a function of time. The sucrose concentrations are (A) 0 %, (B) 10 wt %, (C) 20 wt % and (D) 60 wt %, respectively
0 10 20 30 40
0 0.1 0.2 0.3
Time (s)
Velocity (mm/s)
Figure 3.6: Graph of droplet velocity vs. time for droplets in motion on a 60o tilted substrate. The insert shows a photograph of a 20 wt % sucrose droplet in motion. Droplets contained
(♦) 0 wt %, (■) 10 wt %, (▲) 20 wt % and (×) 60 wt % sucrose in water. Lines are drawn
through the symbols merely as a guide to the eye. Velocity is measured immediately at the onsite of motion during liquid/ substrate interaction.
the higher activation energy for viscous flow caused by the sucrose hydrogen bonding network.22 As the sucrose concentration was raised further to 42 wt %, the velocity of the droplet continued to decrease.
0 10 20 30 40 50 60 70 80
0 0.1 0.2 0.3
Time (s)
Velocity (mm/s)
Figure 3.7: Graph of droplet velocity vs. time graph for droplets in motion on an F8H2
gradient. Droplets contained (♦) 0 wt %, (■) 10 wt %, (×) 22 wt %, (●) 36 wt % and (▲) 42 wt % sucrose in water. Faster motion for the 22 wt % solution resulted in collection of fewer points. Lines are drawn through the symbols merely as a guide to the eye.
Figure 3.8 shows the velocity measured for different aqueous sucrose droplets moving on a 60o tilted plane. Two regimes can be observed. For droplets containing lower
0 10 20 30 40 50 0
5 10 15 20 25 30 35
Velo
city (mm/s)
Viscosity (cS)
Figure 3.8: Graph of velocity vs. viscosity on a 60o tilted substrate. 30 µL droplets of 0, 10,
22, 36, 42, 50, 58 and 60 wt % of sucrose were used.
Kim et al were the first to suggest that steady sliding velocity of a “partially wetting” viscous drop on a specified surface can be determined by the linear relationship between capillary number and bond number in a low velocity regime.24 Liamat et.al determined the
Ca (Uη/γ) vs Boα relationship can be used to express the theory that the sliding velocity U
increases with increasing substrate inclination angle (α).25 This non-dimensionalized plot is
used because the capillary number is based on the drop velocity U and the bond number used
in the expression is the bond number tangential to the inclined surface, Boα = Bosinα (where
Bo =ρgr2/σ).
From our experimental results for a 30 µl droplet on 20, 40 and 60o inclined planes the Ca
vs. Boα values of these droplets were calculated and are shown in Figure 3.9. Figure 3.9
shows 0, 10, 20, 40 and 60 wt % sucrose droplets mostly increase in Ca as the Boα increases.
It is also important to note the steep increase in Ca for 60 wt % sucrose. Although, 60 wt % sucrose droplets move slower than 0, 10, 20, and 40 wt % sucrose, the dynamic viscosity value is much larger for 60 wt % sucrose contributing to the increase in Ca. The dynamic viscosity value for 60 wt % is also higher than the sliding velocity used to calculate the capillary number.
0 . 0 0 . 5 1 . 0 1 . 5 0 . 0
0 . 5 1 . 0 1 . 5 2 . 0 2 . 5 3 . 0 3 . 5 4 . 0 4 . 5 5 . 0 5 . 5 6 . 0
x 1 0- 3
B o n d N u m b e r , B o
Ca
pilla
ry Numbe
r, Ca
Figure 3.9: Depicts Ca vs Bo of 30 µL droplets moving on varying inclination angles (20, 40 and 60o). The data is represented as followed: 0 wt % (■), 10 wt % (y) 20 wt % (S), 40 wt
3.4 Conclusions
This work presents a study on drop motion of a multicomponent liquid with competing interfacial effects. The following trends were shown in this work:
(1) A decrease in the velocity of a moving drop (on an incline and gradient) was observed at 36 wt % sucrose concentration.
(2) A high range of velocity was observed until viscous force dominance. This observation could be due to the increase in surface tension with increasing percentage of sucrose. This theory is difficult to address because the molecular behavior of the droplet on the surface is different from that of the bulk solution. Sucrose molecules in general are repelled by the water/ air interface, which leaves a thin periphery of water/ air molecules that surrounds the bulk fluid. This concept explains why polysaccharides, such as sucrose and glucose, can raise the apparent surface tension of water by a modest but non-negligible amount, when dissolved at fairly elevated concentrations. How this behavior affects a droplet in motion has not been reported.
3.5 Implementation/ Experimental
3.5.1 Surface Preparation
Silicon wafers (Sb-doped, 0.01- 0.02ohm-cm) were obtained from Silicon Valley Microelectronics. Strips of 35-40mm with no visible scratches were cut and cleaned from a silicon wafer. The strip was rinsed thoroughly with acetone, methanol, and deionized water (DI) and then placed in a sonic bath containing DI water for 10 minutes to ensure the removal of any debris and particles on the strip surface. The strip was then placed under ultraviolet ozone (Ultraviolet Ozone Chamber Model 42, Jelight Company, Inc) for 10 minutes to create hydroxyl groups on the Si surface. Finally the surface was dried with a jet of nitrogen and immediately used in preparation for self assembled monolayer formation. A 3:1 mixture of mineral oil and (heptadecafluoro-1, 1,2,2, Tetrahydrodecyl) trichlorosilane (F8H2) from Gelest was prepared. Silane vapor deposition was used to distribute diffusion molecules to the hydroxlyated silicon surface. In preparation for the full coverage monolayer the silicon sample was fully exposed to the silane for a diffusion time of 3 minutes. For the gradient, only one region of the hydroxylated silicon wafer was exposed to the silane for 1.5 minutes. On the gradient substrate, locations on the surface that were closer to the silane source became relatively more hydrophobic (less wettable).
3.5.2 Measurement of Contact Angles