DOI: http://dx.doi.org/10.26483/ijarcs.v8i7.4527
Volume 8, No. 7, July – August 2017
International Journal of Advanced Research in Computer Science
RESEARCH PAPER
Available Online at www.ijarcs.info
ISSN No. 0976-5697
SENTIMENTAL ANALYSIS USING LEAST SQUARES TWIN SUPPORT VECTOR
MACHINE
N. Saranya
MSc(SS).,MCA.,M.Phil. Assistant Professor,
PG Department of Computer Science, Sree Saraswathi Thyagaraja College,Pollachi.
Dr. R. Gunavathi
MCA.,M.Phil.,Ph.D.
Head, Department of Computer Application, Sree Saraswathi Thyagaraja College,Pollachi.
Abstract: Sentiment analysis is field of text mining in which reviews are in form of unstructured data so opinions can be extracted from overall opinion. This paper works on finding approaches that generate output with good accuracy. Least squares twin support vector machine (LSTSVM) is a quite new version of support vector machine (SVM) based on non-parallel twin hyperplanes. LSTSVM is an extremely efficient and fast algorithm for binary classification and its parameters depend on the nature of the problem. The goal of this paper is to improve the accuracy through LSTSVM. A result on several benchmark datasets is applied to train a sentiment classifier inorder to demonstrate the accuracy of the proposed algorithm. N-grams and different weighting scheme were used to take out the most classical features. It also analyzes Chi-Square weight features to select informative features for the classification. Experimental analysis reveals that by using Chi-Chi-Square feature selection in LSTSVM may provide significant improvement on classification accuracy.
Keywords: Chi-Square Weight, Least Squares Support Vector Machine (LSTSVM), Support Vector Machine (SVM).
1.INTRODUCTION
n web technology, large amount of data is available for the internet users. These users uses the resources in the web also give their feedbacks to organize and analyze their views for better decision making about their products and services. Due to a large collection of opinions on the Web, some form of summary of opinions is needed. Sentiment Analysis is to find the result about opinion of user with reference to various topics or in text consideration [18], [19]. It determines whether a piece of writing is positive, negative or neutral. In machine learning methods sentiment classification accuracy is affected by decision function used. Here, Support vector machine (SVM) is a useful technique for data classification to evaluate positive and negative opinions [2].
In large-scale, SVM is affected due to high computational complexity of quadratic programming problem (QPP) [6]. To improve the performance Least squares twin support vector machine (LSTSVM) is used with SVM. The method of LST is used for features extraction as well as dimensionality reduction with fine accuracy of text categorization and less computational overhead [11] [8]. A twin support vector machine (TWSVM) which also aims at seeking two nonparallel hyperplanes which is close among the two classes and at the same time leave from the other. The idea of solving two smaller-sized QPPs rather than a single larger-sized QPP in SVM makes the learning of TWSVM four times faster than SVM. To improve the learning speed of TWSVM, after combining the spirit of TWSVM [8] and LSSVM [17], least squares twin support vector machine (LSTSVM) [16] is proposed to replace the QPPs in TWSVM with a linear system by using a squared loss function instead of the hinge one.
In this paper the main aim is to investigate the algorithm of SVM and improve further its performance by using
LSTSVM in terms of accuracy. This work present experiments using machine learning open source data mining software tool. The experiments using benchmarks datasets [7][8] with a number of different term-weighting schemes for feature extraction and Chi-square for feature selection. Support Vector Machine (SVM) has been used for the classification process [12]. The result was measured using Precision, Recall, Accuracy, F Measure and AUC for evaluating the efficiency of the proposed method.
This paper is organized as follows; Section 2 explains the related works performed by other researchers in this field; Section 3 describes the proposed method LSTSVM algorithm to perform the experiment; and Section 4 is the primary results and discussion obtained from the experiments.
2.RELATEDWORKS
provide constraints to QPP, while in TWSVM patterns of one of the two classes provide constraints to each QPP. TWSVM has been applied to various real life applications, for example, disease diagnosis, software defect prediction, intrusion detection, emotion recognition, image annotation, speaker identification etc. [24-32]. Kumar et al. proposed LSTSVM, a binary classifier, that solves two linear problems instead of two QPPs and determines two non-parallel hyper-planes one for each class. The main purpose is to improve accuracy and identify key features for each sentiment class [13]. In order to address these issues, a suitable method of feature selection is required to extract the useful features before the classification is done. If the features used are reliable and robust then the classification performance can be increased. Excessive numbers of features not only increase computational time but also degrade classification accuracy. As a consequence, feature selection plays a critical role in text classification problems to speed up the computation as well as improving the accuracy [14].
3.BASICCONCEPTS
This section provides the brief introduction of traditional SVM, TWSVM and LSTSVM. The format of training set for binary classification is given below:
D = {(x1, y1), (x2, y2),…,(x1, y 1
)} (1)
Where represents the ith data sample or pattern in n-dimensional real space R and {+1,-1} represents class label. ‘l’ represents number of patterns in training dataset. Suppose positive and negative class contains l1 and l2 patterns correspondingly and l=l1 + l2.
A. Support Vector Machine
SVM uses following decision function to classify the patterns:
f(x) = sgn ((w.x)+b) (2)
SVM divides the patterns of two classes by constructing a hyper-plane that provides clear separation between them [5]. The equation of hyper-plane is given below:
W.X + b=0 (3) The above hyper-plane lies in between following planes: WT.X + b = 1 and WT.X + b = -1 (4) Where a normal vector is in n-dimensional real space R and is a bias term.
SVM solves following QPP in order to obtain the value of normal vector and bias:
s.t Yi((W.Xi)+b) ≥1-ξi
and ξ1 ≥ 0 (5)
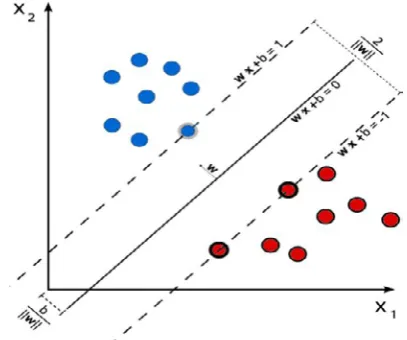
[image:2.595.335.539.53.223.2]Where i=1,…,l, and the notation and C>0 denote slack variables and penalty parameter respectively. Slack variables determine the degree of misclassification of data sample. The above QPP is solved by taking its dual form. In SVM, all patterns provide constraint to QPP i.e., SVM dual formulation depends upon the number of all patterns in the training set. For ‘l’ training patterns, the complexity of SVM is O (l3) [4]. Figure 1 shows the geometric representation of the binary SVM.
Figure 1. Geometric Representation of Binary Support Vector Machine
B. Twin Support Vector Machine
TWSVM uses following decision function in order to classify the patterns of two classes:
(6)
TWSVM performs the classification task by generating two hyper-planes which are not parallel but obtained by optimizing a pair of QPPs as:
(7)
s.t
(8)
Where matrices X1 ⋲ Rl1xn and X2⋲ Rl2xn include the patterns
of positive and negative class correspondingly, are penalty parameters for misclassified samples,e1⋲ Rl1and e2⋲ Rl2 are
the vectors of 1’s ξ ⋲ Rl2and η ⋲ Rl1 are slack variables due to negative and positive class correspondingly. TWSVM determines the following two noparallel hyper-planes in n-dimensional space:
XTW1+b1=0 and X T
W2+b2=0
(9)
Figure 2. Geometric Representation of Binary Twin Support Vector Machine
C. Least Squares Twin Support Vector Machine (LSTSVM) LSTSVM constructs two-non parallel hyper-planes by optimizing a pair of linear equations instead of a pair QPPs as
s.t
(10)
s.t
LSTSVM solves a pair of linear equations rather than QPPs due to equality constraints as opposed to inequality constraints as in TWSVM. After solving above equations, we can calculate the parameters of hyper-plane as:
(12)
and (13)
Where, H= and G= . Further, hyper-plane parameters (w1,b1) and (w2,b2) are helpful to generate two non-parallel planes by using equation 9. A class is assigned to a new pattern depending upon which of the plane lies nearest to it as:
[image:3.595.388.491.345.558.2](14)
Where | . | denotes the perpendicular distance of the pattern from the plane. LSTSVM also classifies the non-linearly separable patterns by using kernel function and determines two kernel generated surfaces in higher-dimension as:
K(xT,DT)μ1+γ1 = 0 and K(x T
,DT)μ2+γ2 = 0 (15)
Where ‘K’ is any kernel function and D=[X1 X2]T. The
optimization problems of non-linear LSTSVM are formulated as:
s.t (16) and
s.t (17)
Hyper-plane parameters are calculated as:
(18)
Where P= [k (X1,DT)e] Q= [k (X2 , DT) e] and the class is
evaluated as
4.PROPOSEDMETHODOLOGY
The paper works on to improve accuracy by using LSTSVM on benchmark datasets by Pang Corpus [7] and Taboada Corpus [8].The framework consists of preprocessing, feature extraction, feature selection and classification stages. The obtained measure is explained in the following section.
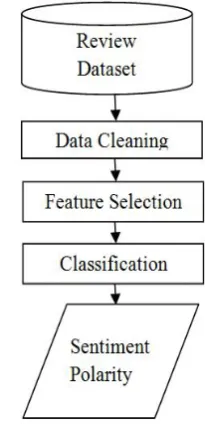
Figure 3. Sentiment Analysis Process Flow
A. Sentiment analysis
Sentiment analysis process works on consumer reviews are in form of unstructured data. The process involves unstructured dataset is converted into structured form. By using feature selection method it extracts features from structured review. Then the classification technique is applied on extracted features to classify them into its sentiment polarity either positive or negative [20].
Data cleaning
implemented [10]. In many existing papers NLTK is used with python to preprocess the dataset.
Following various methods are used in sentiment analysis as a part of preprocessing [15].
• Convert upper to lower case letter, remove Punctuation which are unwanted, remove New Line, remove special character, remove ASCII code, remove extra white spaces etc.
• Stemming: M.F. porter stemmer is most widely used algorithm which stems the word.
• Negation rule: this method removes negation word which reverses meaning of word in review.
• Conjunction rule: This method extracts meaning from review using grammatical rule.
Datasets Description
Two label datasets 2000 positive and negative Movie Review Datasets from those400 positive and negative SFU Review Corpus Datasets are used for the experiments. • Pang Corpus: The corpus performs classify movie
reviews collected from IMDb.com. The collection consists of 2000 reviews (1000 positive samples and 1000 negative samples).
• Taboada Corpus: It includes 400 opinions collected from the website Epinion-s.com divided into 200 reviews classified as ”suggested” (positive) and 200 as ”not recommended” (negative). The datasets contains reviews about product and services such as movies, books, cars, phones and etc.
Feature Extraction and Selection
A mixture of feature selection methods are TF-IDF(Term Frequency–Inverse Document Frequency), IG(Information Gain), MI(Mutual Information), Feature Vector, Unigram, Bigram and N- gram methods. Two feature selection techniques CountVectorizer and TF-IDF are discussed in TF-IDF score is to be taken into consideration to balance most weighted and less weighted word. Chi square method gives good result for both positive and negative class. Mutual information, Chi-square, TF-IDF and Information Gain techniques are used to select feature from high dimensional data Minimum support threshold is used to extract aspect. TF-IDF feature selection is used. Feature Vector is constructed from feature set. Unigram feature extraction technique has been used to extract feature and feature vector list is produced. Opinion words are extracted using Wilson lexicon list. Unigram, Bigram, Unigram with bigram and Unigram. As part of feature selection Pos tagging technique are used to extract features and emotions are taken as noisy label to improve the accuracy level [13]. Most Widely used feature selection methods have been defined below.
Term Frequency Inverse Document Frequency (TFIDF) • It is defined by multiplying value of frequency of word
in review (TF) and frequency of word in whole corpus (IDF).
TF-IDFi =ti,j* log(N/dfi)
TF-IDFi is the weight of a term i. ti,j is the frequency of term i in sample j. N is the total number of samples in the corpus. dfi is the number of samples containing term i. • Binary Occurrences(BO) - occurrences as a binary
value
The resulting vector is not normalized.
• Term Occurrences (TO) - the absolute number of occurrences of a term vij = fij. The resulting vector is not normalized.
• Chi-square measures observed count and expected count and analyzed how much deviation occurs between them. In text feature selection, these two events correspond to occurrence of particular term and class, respectively. CHI2 information can be computed using formula below:
B. Text Classification Method Selection using Least
Squares Twin Support Vector Machine (LSTSVM) algorithm
LSTSVM has four parameters c1, c2, sigma1 and sigma2 which should be set by the user where c1 and c2 represent the amount of error for each class and sigma1 and sigma2 measure the impact of error on each hyperplane [24], [25]. These four parameters are highly dependent on the nature of the problem which means that for different problems, they would have different optimum values. From the figure.4 algorithm of LSTSVM is applied for classification.
Figure 4: Algorithm of LSTSVM for Classification C = [c1, c2] and sigma = [sigma1, sigma2] c ← c0;
sigma ← sigma0;
Acc = MyLSTSVM (dataset, classes, method, c0, sigma0); cbest ← c; sigmabest ← sigma; Accbest ← Acc;
iteration ← 0; iterationmax ← Constant Value (e.g. ∞); While iteration < iterationmax
{
cnew = c − 0.01 + (0.02) ∗ randn(1, 2);
sigmanew = sigma − 0.0001 + (0.0002) ∗ randn(1, 2);
AccN ew = MyLSTSVM(dataset, classes, method, c0, sigma0); if exp((AccN ew − Acc) ∗ iteration) > rand(1, 1)
{
c ← cnew ; sigma ← sigmanew ; Acc ← AccN ew;
cbest ← cnew ; sigmabest ← sigmanew ;
iteration ← iteration + 1;
}
}
5.SIMULATIONRESULTSANDDISCUSSIONS
Effectiveness Measures
Four effective measures used based on confusion matrix output, which are True Positive (TP), False Positive (FP), True Negative (TN), and False Negative (FN).
• Precision(P) = TP/(TP+FP) Recall(R) = TP/(TP+FN) • Accuracy(A) = (TP+TN)/(TP + TN + FP + FN) • AUC (Area under the (ROC) Curve) =
1/2.((T-P/(TP+FN))+(TN/(TN+FP))
• F-Measure(Micro-averaging) = 2.(P.R)/(P+R)
The effectiveness of text categorization is measured using the F-measure which is a combined effectiveness measure determined by precision and recall, accuracy, and AUC. The area under the ROC curve (AUC) has become a wide measurement of performance of supervised classification rules. The simple form of AUC is only applicable to the case of two classes.
6.SIMULATIONRESULTS
Two parts of dataset is used, one for training and the other for testing where 70% parts used for training and 30% parts for testing to review its accuracy. In this approach three different weighting schemes were used to generate the word vectors as word frequency in text and in the entire corpus (TFIDF), Binary Occurrence (BO) and Term Occurrence (TO). The comparison between Least Square Twin Support Vector Machine (LSTSVM) and Support Vector Machine (SVM) is used for this experiment to classify the testing datasets as positives or negatives in unigram model inoder to find out higher accuracy for better results.
Table 1, 2 shows the comparison of training and testing results in terms of AUCs on Taboada Corpus. In Table 1 and 2 AUCs of LSTSVM is higher with unigram model. The highest AUC value from Table 1 obtained for LSTSVM is 0.884 as compared to SVM it is 0.840. In terms of weighting scheme, TFIDF performs better in this experiments compared to Binary Occurrences (BO) and Term Occurrences (TO).
TABLEI
TABOADA CORPUS 10-FOLD CROSS-VALIDATION TRAINING RESULTS
Weighti ng Scheme
Classificat
ion Accura cy (%) Precisi on (%) Reca ll (%) AU C TFIDF
LSTSVM 80.67 80.56 80.1
2 0.88 4
SVM 75.57 76.15 79.3
3 0.84 0
BO
LSTSVM 72.11 71.42 84.7 4
0.82 1
SVM 67.32 65.21 90.4
2 0.78 1
TO
LSTSVM 64.62 62.53 92.6 3
0.73 4
SVM 61.41 61.80 95.5
0 0.75 6
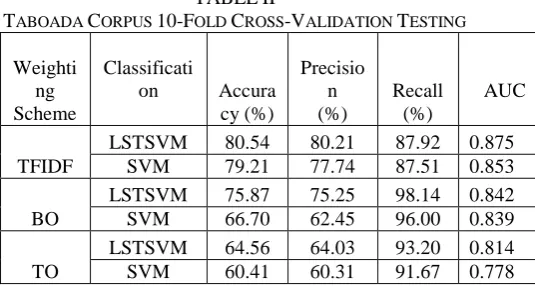
TABLEII
TABOADA CORPUS 10-FOLD CROSS-VALIDATION TESTING
Weighti ng Scheme
Classificati
on Accura cy (%) Precisio n (%) Recall (%) AUC TFIDF
LSTSVM 80.54 80.21 87.92 0.875 SVM 79.21 77.74 87.51 0.853
BO
LSTSVM 75.87 75.25 98.14 0.842 SVM 66.70 62.45 96.00 0.839
TO
LSTSVM 64.56 64.03 93.20 0.814 SVM 60.41 60.31 91.67 0.778 Table 2 list the AUCs of SVM during the testing process. It shows the value of LSTSVM AUC is 0.875 with unigram model in TFIDF weighting scheme and the accuracy also achieved is higher with 80.54% as compared to SVM the obtained AUC is 0.853 with 79.21% of accuracy.
TABLE III
PANG CORPUS 10-FOLD CROSS-VALIDATION TRAINING RESULTS Weig hting Sche me Classificat
ion Accur acy (%) Precis ion (%) Recall (%) AUC TFID F
LSTSVM 86.57 87.28 85.69 0.971 SVM 86.24 85.45 81.16 0.913
BO
LSTSVM 87.79 84.46 84.92 0.987
SVM 85.63 84.52 84.78 0.943
TO
LSTSVM 83.33 82.58 85.72 0.925
LSTSVM 82.15 80.63 86.34 0.857
In pang corpus, table 3 show the results of the AUCs for training process of LSTSVM based on unigram models are superior when achieving 0.987 and accuracy 87.79% with BO weighting scheme. While in SVM the obtained AUC is 0.943 with 87.79% of accuracy. The obtained results are consistent with training results where the highest AUCs and accuracy obtained with unigram models in BO weighting scheme using LSTSVM.
In Table 4, the highest AUC is 0.973 and accuracy is 86.97%in LSTSVM than the SVM where the AUC is 0.938 with 84.40 of accuracy.
TABLEIV
PANG CORPUS 10-FOLD CROSS-VALIDATION TESTING RESULTS Weighti ng Scheme Classificat ion Accurac y (%) Precisio n (%) Reca ll (%) AU C TFIDF
LSTSVM 83.53 82.22 83.7
5
0.89 4
SVM 80.65 79.51 81.7
4
0.86 8
BO
LSTSVM 86.97 86.78 85.4
4
0.97 3
SVM 84.40 86.59 83.4
7
[image:5.595.320.588.61.204.2] [image:5.595.40.288.539.751.2]TO
LSTSVM 82.55 83.09 82.3
4
0.89 5
LSTSVM 79.71 80.11 78.4
6
0.88 2 From this overall result, unigrams outperformed bigrams when performing the sentiment classification of movie reviews. Binary Occurrences (BO) weighting scheme plays a crucial role in extracting the most representative features as an input to the classifier for Pang Corpus by means of using LSTSVM than the SVM results obtained. Meanwhile, unigram models and TFIDF weighting scheme play an important role for the classifier performance in Taboada Corpus.
TABLEV
THE CLASSIFICATION RESULTS AFTER CHI-SQUARE FEATURE-SELECTION WITH RESPECT TO FMEASURE ON
TABOADA CORPUS FROM 10FOLD CROSS VALIDATION RESULTS Weightin g Scheme Feature Selection classificati on Accura cy (%) Precisi on (%) Reca ll (%) AUC TFIDF
LSTSVM 73.59 0.884 0.65
3 0.691
SVM 70.17 0.853 0.62
5 0.626
BO
LSTSVM 95.49 0.964 0.93
7 0.95
SVM 92.56 0.927 0.91
4 0.928
TO
LSTSVM 90.41 0.915 0.90
2 0.904
SVM 89.33 0.914 0.90
5 0.915 Table 5 and 6 that the F-measure of LSTSVM based on Chi-square without feature selection is improved compared to SVM experiment are given above. Table 5 indicates the comparison of feature selection methods with respect to F-measure on Taboada Corpus, respectively. The obtained LSTSVM value of F-measure is 0.95 and the accuracy is 95.49% which is higher than the results obtained from SVM of F-measure is 0.928 and the accuracy is 92.56%.
TABLEVI
THE CLASSIFICATION RESULTS AFTER CHI-SQUARE FEATURE-SELECTION WITH RESPECT TO F-MEASURE ON PANG CORPUS FROM 10FOLD CROSS VALIDATION RESULTS
Weightin g Scheme Feature Selection classificati on Accura cy (%) Precisi on (%) Reca ll (%) AUC TFIDF
LSTSVM 88.09 0.882 0.88
1 0.88
SVM 85.12% 0.876 0.85 0.82
5
BO
LSTSVM 92.67 0.921 0.91
18 0.92
SVM 91.44% 0.914 0.91
4
0.91 4 TO LSTSVM 87.53 0.867 0.87 0.877
2
SVM 86.17% 0.863 0.86
2
0.86 2 Table 6 lists the F-measure of LSTSVM on Pang Corpus based on Chi-Square feature selection. It indicates the results are superior as compared to SVM where the LSTSVM value of F-measure is 0.92 and accuracy is 92.67%.From the above results shows that the process of selecting the features based on their chi-squared in LSTSVM statistics value helped in the text, allowing a high performance of the classifier that could be comparable to topic categorization. It also shows that the calculated accuracies by using LSTSVM achieved higher.
7. CONCLUSION
The LSTSVM algorithm provides good classification performance. Here, benchmark datasets were used to train a sentiment classifier based on Least Twin Square Support Vector Machine (LSTSVM) that uses unigram model in different weighting scheme as an input to the classifier. From the observations, it can be concluded that unigrams outperform for both datasets while Binary Occurrences (BO) and TFIDF weighting scheme plays a vital role in extracting the most classical features for Pang Corpus and Taboada Corpus. The results also shows that by using chi-square feature selection in LSTSVM will significantly improved the classification accuracy for both datasets. Experimental results on data sets with different sizes have demonstrated that the algorithm LSTSVM achieves higher accuracies compared to SVM classification algorithm.
8.REFERENCES
[1] Feldman, R., 2013. Techniques and applications for sentiment analysis. Communications of the ACM, 56(4), pp.82-89. [2] Mostafa, M.M., 2013. More than words: Social networks’ text
mining for consumer brand sentiments. Expert Systems with Applications, 40(10), pp.4241-4251.
[3] Pang, B. and Lee, L., 2004, July. A sentimental education: Sentiment analysis using subjectivity summarization based on minimum cuts. In Proceedings of the 42nd annual meeting on Association for Computational Linguistics (p. 271). Association for Computational Linguistics.
[4] Taboada, M., Anthony, C. and Volt, K., 2006, May. Methods for creating semantic orientation dictionaries. In Proceedings of the 5th Conference on Language Resources and Evaluation (LREC’06) (pp. 427-432). [5] C. Corinne and V. Vapid, “Support-vector networks”,
Machine learning, vol. 20, no. 3, (1995), pp. 273-297.
[6] Sale, M.R., Martin-Valdivia, M.T., Montejo-Ráez, A. and Ureña-López, L.A., 2011. Experiments with SVM to classify opinions in different domains. Expert Systems with Applications, 38(12), pp.14799-14804.
[7] Uysal, A.K. and Gunal, S., 2012. A novel probabilistic feature selection method for text classification. Knowledge-Based Systems, 36, pp.226-235.
[8] Martinez Camera, E., Valdivia, M., Teresa, M., Peres Ortega, J.M. and Urea Lopez, L.A., 2011. Technical de classification de opinions palisades a un corpus en Espanola.
[9] Liu, B., 2012. Sentiment analysis and opinion mining. Synthesis lectures on human language technologies, 5(1), pp.1-167.
Empirical methods in natural language processing-Volume 10 (pp. 79-86). Association for Computational Linguistics. [11]Miller, G.A., 1995. Word Net: a lexical database for English.
Communications of the ACM, 38(11), pp.39-41.
[12]Treaty, A., Agrawal, A. and Rath, S.K., 2015.Classification of Sentimental Reviews Using MachineLearning Techniques. Procedia Computer Science,57, pp.821-829.
[13]S. Gunal and R. Edizkan, “Subspace based feature selection for pattern recognition,” Information Sciences, vol. 178, no. 19, pp. 3716–3726, 2008.
[14]T. L.Ladha, “Feature selection methods and algorithms,” International Journal on Computer Science and Engineering (IJCSE), vol. 3, p. 5, 2011.
[15]A. K. Uysal and S. Gunal, “The impact of preprocessing on text classification,” Information Processing & Management, vol. 50, no. 1, pp. 104 – 112, 2014.
[16]C. Cortes and V. Vapnik, “Support-vector networks,” Machine Learning, vol. 20, no. 3, pp. 273–297, 1995.
[17]T. Joachims, “Text categorization with support vector machines: Learning with many relevant features,” in Machine Learning: ECML-98, ser. Lecture Notes in Computer Science, C. Nedellec´ and C. Rouveirol, Eds. Springer Berlin Heidelberg, 1998, vol. 1398, pp. 137–142.
[18]B. Pang, L. Lee, and S. Vaithyanathan, “Thumbs up?: Sentiment classification using machine learning techniques,” in Proceedings of the ACL-02 Conference on Empirical Methods in Natural Language Processing - Volume 10, ser.
EMNLP ’02. Stroudsburg, PA, USA: Association for Computational Linguistics, 2002, pp. 79–86.
[19]E. Martinez Camara, V. Martin, M. Teresa, J. M. Perea Ortega, and L. A. Urena Lopez, “Tecnicas de clasificacion de opiniones aplicadas a un corpus en espanol,” Procesamiento de Lenguaje Natural, vol. 47, pp. 163–170, 2011.
[20]F. Sebastiani, “Machine learning in automated text categorization,” ACM Comput. Surv., vol. 34, no. 1, pp. 1–47, Mar. 2002.
[21]Mangasarian O. L. and Edward W. W., “Multi-surface proximal support vector classification via generalized eigenvalues”, IEEE Transaction on Pattern Analysis and Machine Intelligence, vol. 28, no. 1, (2006), pp.69–74. [22]J. R. Khemchandani and S. Chandra, “Twin support vector
machine for pattern classification”, IEEE Transaction on Pattern Analysis and Machine Intelligence, vol. 29, no. 5, (2007), pp. 905–910.
[23]T. Divya and S. Agarwal, “Twin Support Vector Machine: A review from 2007 to 2014”, Egyptian Informatics Journal, vol. 16, no. 1, (2015), pp. 55-69.
[24]T. Divya and S. Agarwal, “Hybrid Feature Selection Based Weighted Least Squares Twin Support Vector Machine Approach for Diagnosing Breast Cancer, Hepatitis, and Diabetes”, Advances in Artificial Neural Systems, vol. 2015, (2015).