Volume 3, No. 1, Jan-Feb 2012
International Journal of Advanced Research in Computer Science
RESEARCH PAPER
Available Online at www.ijarcs.info
ISSN No. 0976-5697
Watermark Authentication using Haar, Biorthogonal and Discrete Meyer Transform
Shivani Garg* Mtech Student
Computer Science and Engineering BBSBEC Fatehgarh Sahib, India
Ranjit Singh Assistant Professor
Computer Science and Engineering BBSBEC Fatehgarh Sahib, India
Abstract:With the revolution of information technology and Wide Area Networking, data has become less and less private where the access of media as well as the attempts to change and manipulate the contents of media data has become a common a common case.Digital Watermarking is an important issue in the field of multimedia security protection. The digitization of the world has expanded the concept of watermarking in order to be used in authenticating ownership claims and protecting proprietary interests. . It is essential to have techniques for authentication of the content. This paper aims to use the Discrete Wavelet Transformation as watermarking technique and showing the results after applying Haar wavelet, Biorthogonal wavelet and Discrete Meyer Transformation. The results presented here shows that Biorthogonal wavelet is more robust than other two other wavelet transformations.
Keywords:Watermarking, Pseudo Noise Sequence, Haar wavelet, Biorthogonal Wavelet, Discrete Meyer Wavelet,PSNR,Correlation Coefficient.
I. INTRODUCTION
Digital watermarking is the process of embedding information into a digital signal which may be used to verify its authenticity [1] or the identity of its owners. A given set of data (images) can be easily tampered without even being detected. To avoid this and maintain the originality of the image a watermark like signature, a set of words, may be embedded into the image. If the image is now being tampered it can be easily detected as the pixel values of the embedded data would change and not match the original pixel values. To obtain better imperceptibility as well as robustness, the addition of the watermark is done in a transformed domain. DCT and DWT are two such popular transforms, operating in the frequency domain. Frequency-based techniques are very robust because the watermark is actually spread through out the image, not just operating on an individual pixel. This is just one of the many advantages of embedding the watermark in a transformed domain as opposed to watermarking in the spatial domain.
Pseudonoise sequences are also used for watermarking because of their very good correlation properties, noise like characteristics and resistance to interference. Each data bit of the watermark is represented by a large number of bits, out of which a significant portion may be lost without losing the watermark thoroughly. This method ensures the survival of watermark because of redundancy. Pseudonoise sequences are a good tool for watermarking. In this paper the watermark is embedded and extracted by using haar wavelet, biorthogonal wavelet and discrete Meyer wavelet transformation. From the results it is found that the performance of biorthogonal wavelet is better than haar wavelet and discrete wavelet transformation.. Moreover, the proposed approach has no need of the original image to extract watermark. This paper is organized as follows. Section II describes the Discrete wavelet transform Section III proposes the watermarking embedding and extraction algorithm. Section IV presents the results and discussions. Finally the conclusion is provided in section V.
II. DISCRETEWAVELETTRANSFORMATION
In this paper the technique used for watermarking is Discrete Wavelet Transformation [2]. The original image is split into four non-overlapping multi-resolution sub-bands .The four quadrants contain approximation sub-band (LL), horizontal detail sub-band (LH), vertical detail sub band (HL) and a diagonal detail sub-band (HH) [3]. The sub-band LL1 represents the coarse-scale DWT coefficients while the sub-bands LH1, HL1 and HH1 represent the fine-scale of DWT coefficients. This process can be repeatedly applied on the approximation sub-band to generate the next coarser scale of wavelet coefficients [4]. The process continues until some final scale is reached. The message is inserted in the high frequency sub bands (HL, LH and HH) because embedding watermarking in these places can’t be easily detected as people are not easily conscious of it [5]. So the watermark is embedded in the high frequency region. This paper provides the comparison of haar , biorthogonal and discrete Meyer wavelets. The haar wavelet is the simplest one and having linear phase but it is not smooth and regular. The highly important linear phase constraint corresponding to symmetric wavelets may be maintained by relaxing the orthogonality constraint and using biorthogonal wavelets [6]. Biorthogonal and Discrete Meyer wavelet have the properties of perfect reconstruction, orthogonal and symmetrical.
III. WATERMARKEMBEDDINGAND EXTRACTIONALGORITHM
A. Watermark Embedding:
b. The discrete wavelet transformation is applied on the host image to convert the host image into wavelet transform coefficients.
c. Then the watermark dependent noise is generated by the use of PN Sequence of size equal to each of the column of transform coefficients.
d. If the pixel in the watermark vector is zero then the PN sequence with appropriate gain factor is added to the horizontal and vertical subbands [8], else it is subtracted. Iw (x, y) = I (x, y) + k × W (x, y)
Where,
Iw(x, y) denotes the watermarked image. I (x, y) denotes the actual cover image.
W(x, y) denotes a pseudo random noise pattern that is added to the image.
K denotes the gain factor.
e. Modulo function determines the column in which PN sequence is added or subtracted
f. Key and the gain factor are fixed before the generation of PN sequences.
g. Perform inverse wavelet transformation to get the watermarked image.
B. Watermark Extraction:
a. Read the Watermarked image and apply DWT. b. Create a message vector of all one’s.
c. The PN sequences are generated with the same key as used during the embedding process.
d. The modulo function is again created to determine the column for which the correlation is checked.
e. The correlation is calculated between the generated PN sequence and the horizontal & vertical sub band columns.
f. Calculate average correlation and set mean correlation as threshold [8].
g. If the average correlation exceeds the threshold then 0 is recovered otherwise 1 is recovered.
h. Reshape the extracted sequence and display recovered watermark.
IV. RESULTSANDDISCUSSIONS
The host image of size 512 X 512 and the watermark of size 32 X 64 is taken. Performance is evaluated by calculating Peak Signal to noise ratio (PSNR) and signal to noise ratio (SNR) between original image and watermarked image. Another parameters are also used that tells the difference between original watermark and the extracted watermark. These parameters include Standard Correlation (SC), Bit Error Rate (BER), Correlation Coefficient (CRC), Accuracy Rate (AR), Root mean square error (RMSE) and Normalized Correlation (NC). The results are observed by varying the gain factor for each wavelet transformation. Further results are produced by varying the watermark size and number of levels. Figure 1 and 2 represents original image and original watermark respectively
.
Figure 1
Figure 2
(a)
(c)
Figure 3 Watermarked Image (a)Dmey (b)Haar (c)Bior.24
(a)
(b)
(c)
Figure 4 Extracted Watermark (a)Dmey (b)Haar (c)Bior.24
Figures 3 displays the watermarked image generated after applying the Discrete Meyer, haar and Biorthogonal wavelet transformations. As we can see that the watermarked image generated possesses both the properties of watermark i.e. Robustness and Imperceptibility. Figure 4 displays the extracted watermark. It is clear that watermark quality is good and readable without any distortion.
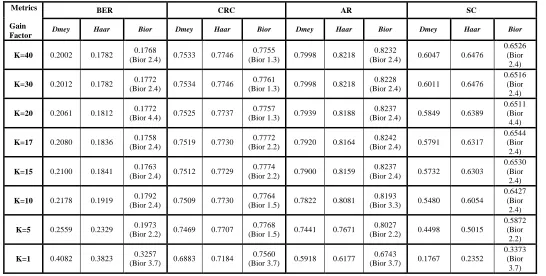
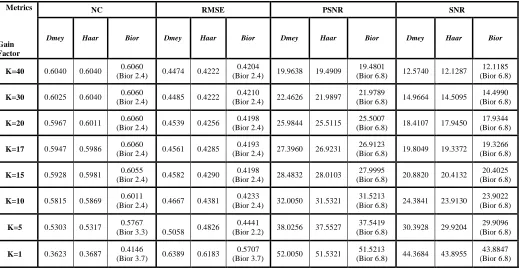
[image:3.612.36.582.418.694.2]The following tables I, II, III, IV, V, and VI presents the experimental results based on calculations done. Table I and IV shows that whenever we vary the gain factor, Biorthogonal wavelet is giving the least value of BER and RMSE as compared to other two wavelets. And the Biorthogonal wavelet gives the high value of SC, NC, AR, PSNR, SNR and CRC among the other wavelets. It reveals that Biorthogonal produces better results if we change the gain factor. Table III and V tells the effect of watermark size on the performance of three wavelets. Biorthogonal and haar wavelet is having the minimum value of BER and RMSE than discrete Meyer wavelet. For CRC, AR and SC, again biorthogonal and haar wavelet produces better results. NC is better in Biorthogonal wavelet whereas PSNR and SNR results are good in discrete Meyer wavelet. Table II and VI shows the effect of levels. At each level biorthogonal wavelet gives the smallest value of BER and RMSE than other two wavelets. Performance of biorthogonal is better in case of CRC, AR, SC and NC. At level 1 and 2, discrete Meyer wavelet achieves higher PSNR and SNR than other two wavelets.
Table 1 performance of dmey, haar and biorthogonal wavelet based on BER,CRC,AR and SC
Metrics
Gain Factor
BER CRC AR SC
Dmey Haar Bior Dmey Haar Bior Dmey Haar Bior Dmey Haar Bior
K=40 0.2002 0.1782 0.1768
(Bior 2.4) 0.7533 0.7746
0.7755
(Bior 1.3) 0.7998 0.8218
0.8232
(Bior 2.4) 0.6047 0.6476
0.6526 (Bior
2.4)
K=30 0.2012 0.1782 0.1772
(Bior 2.4) 0.7534 0.7746
0.7761
(Bior 1.3) 0.7998 0.8218
0.8228
(Bior 2.4) 0.6011 0.6476
0.6516 (Bior
2.4)
K=20 0.2061 0.1812 0.1772
(Bior 4.4) 0.7525 0.7737
0.7757
(Bior 1.3) 0.7939 0.8188
0.8237
(Bior 2.4) 0.5849 0.6389
0.6511 (Bior
4.4)
K=17 0.2080 0.1836 0.1758
(Bior 2.4) 0.7519 0.7730
0.7772
(Bior 2.2) 0.7920 0.8164
0.8242
(Bior 2.4) 0.5791 0.6317
0.6544 (Bior
2.4)
K=15 0.2100 0.1841 0.1763
(Bior 2.4) 0.7512 0.7729
0.7774
(Bior 2.2) 0.7900 0.8159
0.8237
(Bior 2.4) 0.5732 0.6303
0.6530 (Bior
2.4)
K=10 0.2178 0.1919 0.1792
(Bior 2.4) 0.7509 0.7730
0.7764
(Bior 1.5) 0.7822 0.8081
0.8193
(Bior 3.3) 0.5480 0.6054
0.6427 (Bior
2.4)
K=5 0.2559 0.2329 0.1973
(Bior 2.2) 0.7469 0.7707
0.7768
(Bior 1.5) 0.7441 0.7671
0.8027
(Bior 2.2) 0.4498 0.5015
0.5872 (Bior
2.2)
K=1 0.4082 0.3823 (Bior 3.7) 0.3257 0.6883 0.7184 (Bior 3.7) 0.7560 0.5918 0.6177 (Bior 3.7) 0.6743 0.1767 0.2352
0.3373 (Bior
Table 2
Metrics
Levels (K=17)
BER CRC AR SC
Dmey Haar Bior Dmey Haar Bior Dmey Haar Bior Dmey Haar Bior
1 o.2080 0.1836 0.1758
(Bior 2.4) 0.7519 0.7730
0.7772
(Bior 2.2) 0.7920 0.8164
0.8242
(Bior 2.4) 0.5791 0.6317
0.6544 (Bior 2.4)
2 0.3501 0.2524 0.2480
(Bior 4.4) 0.7108 0.7825
0.7825
(Bior 1.1) 0.6499 0.7476
0.7520
(Bior 4.4) 0.2661 0.4668
0.4701 (Bior 4.4)
3 0.3922 0.3770 0.3687
(Bior 4.4) 0.7118 0.7234
0.7278
(Bior 4.4) 0.6211 0.6230
0.6313
(Bior 4.4) 0.2229 0.2460
0.2595 (Bior 4.4)
Table 3
Metrics
Watermark Size (K=15)
BER CRC AR SC
Dmey Haar Bior Dmey Haar Bior Dmey Haar Bior Dmey Haar Bior
20 x 50 0.2100 0.1640 0.1660
(Bior 1.3) 0.6818 0.7329
0.7305
(Bior 1.3) 0.7900 0.8360
0.8340
(Bior 1.3) 0.6492 0.7172
0.7142 (Bior
1.3)
30 x 50 0.1787 0.1480 0.1493
(Bior 1.3) 0.7380 0.7723
0.7707
(Bior 1.3) 0.8213 0.8520
0.8507
(Bior 1.3) 0.6869 0.7367
0.7346 (Bior
1.3)
32 x 64 0.2100 0.1841 (Bior 2.4) 0.1763 0.7512 0.7729 (Bior 2.2) 0.7774 0.7900 0.8159 (Bior 4.4) 0.8218 0.5732 0.6303
0.6530 (Bior
2.4)
40 x 80 0.1259 0.1009 0.0859
(Bior 3.1) 0.8806 0.9006
0.9024
(Bior 3.1) 0.8741 0.8991
0.9141
(Bior 3.1) 0.6572 0.7286
0.7553 (Bior
[image:4.612.51.570.465.734.2]3.5)
Table 4 Performance of dmey,haar and biorthogonal wavelet based on NC,RMSE,PSNR and SNR
Metrics
Gain Factor
NC RMSE PSNR SNR
Dmey Haar Bior Dmey Haar Bior Dmey Haar Bior Dmey Haar Bior
K=40 0.6040 0.6040 0.6060
(Bior 2.4) 0.4474 0.4222
0.4204
(Bior 2.4) 19.9638 19.4909
19.4801
(Bior 6.8) 12.5740 12.1287
12.1185 (Bior 6.8)
K=30 0.6025 0.6040 0.6060
(Bior 2.4) 0.4485 0.4222
0.4210
(Bior 2.4) 22.4626 21.9897
21.9789
(Bior 6.8) 14.9664 14.5095
14.4990 (Bior 6.8)
K=20 0.5967 0.6011 0.6060
(Bior 2.4) 0.4539 0.4256
0.4198
(Bior 2.4) 25.9844 25.5115
25.5007
(Bior 6.8) 18.4107 17.9450
17.9344 (Bior 6.8)
K=17 0.5947 0.5986 (Bior 2.4) 0.6060 0.4561 0.4285 (Bior 2.4) 0.4193 27.3960 26.9231 (Bior 6.8) 26.9123 19.8049 19.3372 (Bior 6.8) 19.3266
K=15 0.5928 0.5981 (Bior 2.4) 0.6055 0.4582 0.4290 (Bior 2.4) 0.4198 28.4832 28.0103 (Bior 6.8) 27.9995 20.8820 20.4132 (Bior 6.8) 20.4025
K=10 0.5815 0.5869 0.6011
(Bior 2.4) 0.4667 0.4381
0.4233
(Bior 2.4) 32.0050 31.5321
31.5213
(Bior 6.8) 24.3841 23.9130
23.9022 (Bior 6.8)
K=5 0.5303 0.5317 0.5767
(Bior 3.3) 0.5058 0.4826
0.4441
(Bior 2.2) 38.0256 37.5527
37.5419
(Bior 6.8) 30.3928 29.9204
Table 5
Metrics
Watermar k Size (K=15)
NC RMSE PSNR SNR
Dmey Haar Bior Dmey Haar Bior Dmey Haar Bior Dmey Haar Bior
20 x 50 0.4500 0.4500 0.4500
(Bior 1.3) 0.4583 0.4050
0.4074 (Bior 1.3)
29.42
54 28.8396
28.9221
(Bior 6.8) 21.8173 21.2356
21.3175 (Bior 6.8)
30 x 50 0.5013 0.5020 0.5020
(Bior 1.3) 0.4227 0.3847
0.3864 (Bior 1.3)
27.89
61 27.4998
27.5365
(Bior 6.8) 20.3000 19.9076
19.9439 (Bior 6.8)
32 x 64 0.5928 0.5981 0.6055
(Bior 2.4) 0.4582 0.4290
0.4198 (Bior 2.4)
28.48
32 28.0103
27.9995
(Bior 6.8) 20.8820 20.4132
20.4025 (Bior 6.8)
40 x 80 0.7078 0.7159 0.7309
(Bior 3.1) 0.3549 0.3177
0.2932 (Bior 3.1)
27.53
19 27.0944
27.1154
(Bior 6.8) 19.9394 19.5066
19.5274 (Bior 6.8)
Table 6
Metrics
Levels (K=17)
NC RMSE PSNR SNR
Dmey Haar Bior Dmey Haar Bior Dmey Haar Bior Dmey Haar Bior
1 0.5947 0.5986 0.6060
(Bior 2.4) 0.4561 0.4285
0.4193
(Bior 2.4) 27.3960 26.9231
26.9123
(Bior 6.8) 19.8049 19.3372
19.3266 (Bior 6.8)
2 0.4321 0.4902 0.5122
(Bior 4.4) 0.5917 0.5024
0.4980
(Bior 4.4) 31.3513 29.8968
32.2122
(Bior 2.6) 23.7330 22.2857
29.9569 (Bior 4.4)
3 0.3600 0.3716 0.3799
(Bior 4.4) 0.6077 0.6140
0.6072
(Bior 4.4) 30.3312 32.9216
36.2056
(Bior 2.8) 22.6974 25.2976
28.5749 (Bior 2.8)
V. CONCLUSION
We proposed a watermarking algorithm which makes use of PN sequence. The three different wavelets namely Haar wavelet, Discrete Meyer Wavelet and Biorthogonal Wavelet It from the wavelet families are applied. The results are calculated based on these three wavelets. It is concluded from the above calculations that Biorthogonal wavelet produces better results than haar and discrete Meyer wavelet in case we vary gain factor or we change the watermark size. It is also displaying better results if the number of levels is increased.
VI. REFERENCES
[1]. S.Radharani, Dr. M.L. valarmathi. “A study on watermarking schemes for image authentication ” International Journal of Computer Applications, volume 2-No.4, June 2010
[2]. Vaishali S.Jabade, Dr. Sachin R. Gengaje,”Literature Review of wavelet based digital image watermarking techniques” International journal of Computer Applications” volume 31-No. 1, October 2011.
[3]. Franco A. Del Colle and Juan Carlos Gomez, "DWT based Digital Watermarking Fidelity and Robustness Evaluation", Journal of Computer Science & Technology, vol. 8, no. 1, April 2008.
[4]. Yusnita Yusof and Othman O. Khalifa, (2007), Digital Watermarking For Digital Images Using Wavelet Transform, IEEE.
[5]. Li, C.T. and Si, H. (2007) Wavelet-based fragile watermarking scheme for image authentication, J. Electron. Imaging, Vol. 16, Issue 1, Pp. 17-22.
[6]. Suhad Hajjara,Moussa Abdallab,Amjad Hudaib,”Digital image watermarking using localized biorthogonal wavelets” European journal of scientific research,vol. 26 No. 4 pp. 594-608,2009
[7]. Stefan, K. and F. A. Petitcolas (Editors), 2000. Information hiding techniques for steganography and digital watermarking. Artech House Books.