Volume 8, No. 3, March – April 2017
International Journal of Advanced Research in Computer Science
RESEARCH PAPER
Available Online at www.ijarcs.info
ISSN No. 0976-5697
Scalable Geo Web Techniques using Spatial Data Mining for Air Pollution
Dharmendra Singh M. Tech Scholar Department of CSE
Jamia Hamdard New Delhi-110062, India
Md. Safdar Tanweer and Md Tabrez Nafis
Assistant Professor Department of CSE Jamia Hamdard New Delhi-110062, India
Abstract: This paper proposes to bolster Geo Web Techniques and spatial data mining techniques for air pollution in Delhi-NCR for real time analysis and identification of relationship among the pro &anti pollutant objects effecting in a specific zone of area. A Geo Web based solution is proposed by provisioning of feature and attribute data services over the web. The functional constituents are collection, transformation, Spatial Data Mining, OGC Web Services i.e. Web Map Service (WMS),Web Feature Service (WFS) ,Web Coverage Service (WCS) query and Geo Web Publishing elements. The collecting element provisioned to access the onsite monitored data through a interface with sources of actual data sets . It need to transform the data into the required spatial format and mining component give an interface to the end user.
Spatial information mining systems can be connected to different fields' specifically human services, metrological information, activity examination, client insight, transport administration, urban arranging and utilities industry. Albeit spatial data mining does not yet belong to the most commonly used spatial information analysis, it was found effective to detect solid relationship among geological feature objects.
Keywords : Spatial Data Mining, Geo Web, Web Map Service (WMS) , Ambient Air Quality
1. INTRODUCTION
Air pollution is the basically composition of chemicals, particles, biological materials, or other harmful materials into the earth’s surface. Air pollutants are airborne particles and gasses that occur in concentrations that endanger the health and well being of organisms thus disrupting the orderly function of the environment .Air pollution thus occurs when the air contains gases, dust, fumes in harmful amounts[3].
Delhi –NCR metropolitan urban communities have high discharge of air poisons which is corrupting the encompassing air quality step by step . As per the Air Quality Index published by Central Pollution Control Board(CPCB) on his website ( http://cpcb.nic.in) the air quality index value for Delhi , Faridabad, Gaziabad, Gurugram was recorded as 349,382,149 as average on November 13-2016 , 311,374,257 as average on November 14-2016 & 372,388,194 as average on November 15- 2016. The prominent pollutant agent mentioned in the report is PM2.5 and PM10. Basically, Particles matter (PM), or airborne particles, include dust, dirt, soot, and smoke.
A few particles are specifically transmitted into the air, for instance, autos, trucks, buses, manufacturing plants, construction sites, and wood burning consuming. Other particles are framed noticeable all around when gasses from burning fuel reacts with sunlight and water vapor. Such gasses, from inadequate ignition in engine vehicles, at power plants and in other mechanical procedures, contribute in a roundabout way to particulate contamination. This overwhelming air contamination has extraordinarily influenced the general wellbeing, particularly respiratory issues. The outcomes demonstrated that number of patients experiencing respiratory sickness, heart maladies and asthma in healing centers expanded when the air contamination got most exceedingly awful.
Presently it is got to be distinctly imperative to control the Air Pollution in exceedingly Polluted Area of the City [12].
To visualize and experience the influential information about the distribution example of the air contaminations, Scalable Geo Web Solution using spatial data mining is proposed.
2 PROBLEM STATEMENTS
We aware that Air Pollution is a profoundly escalating issue. Every corner of the world has recognized as big problem. It immersing every last corner of the world generally because of the human exercises like colossal industrialization, vehicular activity initiated by gigantic measure of fuel consumption and all different exercises like construction, urbanization, power generation[15]
The gigantic buildings influence the stream of the air quantity resulting bringing about trade of air and scrambling or spreading of pollutants. The urban areas and metropolitan ranges urges high human introduction to the unsafe substances due to the raised populace and vehicular movement[15].
The fleeting uniqueness of the grouping of the pollutant amid 24 hours fluctuates with the topographic and meteorological elements, for example, altitude, which defines the nearby wind direction and speed heading at a given space and time[15].
1161
sampled information. Interpolation mostly results in maps[15]
The pollution in air can bring about different wellbeing perils and there is a noteworthy danger of unending and respiratory sicknesses, however the observing of the air quality sullying is difficult. Geo spatial Technologies work and oversee spatial and factual information and furnish us with the outcomes giving us the connection between's the air quality and human wellbeing. Along these lines, GIS and Geo spatial Technologies can be broadly utilized for monitoring air quality[15].
In perspective of above , Scalable Geo Web techniques not just help to pictured the air contamination, air pollution levels, static and dynamic sources of pollution , spatially dispersed over the Delhi-NCR area additionally give the improve Web Services i.e WMS/WFS/WCS as a standard gateway for different agencies to upgrade the innovative work in the domain .These web services provide many technological benefits, which includes Application & Data Integration, Versatility , Code re-use and Cost saving.
3. BACKGROUND REVIEW
We review the various air monitoring models, emission catalog, air feature modeling and activity arrange advance models. The vast majority of them are need based and delivers the inquiries incompletely to determine general science based air quality administration in urban and modern groups .
The work [3] [4] [10][12] provides a building blocks for environmental information system that can be presented by an interoperability system that allows them to be used via different subsets and its combinations in support GIS/Geo Web applications.
The work [12] accentuate that it is crucial to control and moderate the Air Pollution in exceedingly Polluted Area of the City. Due to set limited environment monitoring points within the city spatial interpolation tool in GIS predicts the pollution fixations at unmonitored points. we can get vital information about the dissemination case of the air defilements. The paper(R. S. Kanakiya et. al 2015) survey the Air Quality Data for the fundamental toxins like PM10, PM2.5, Ozone, and NOx is spoken to in GIS for whole city of Pune.
In [3], an air defilement observing application system for determining and investigating air contamination data was made remembering the ultimate objective to give information about the nature of air we breathe.Two modern situations were utilized as contextual analyses in particular Ife steel plant and Ibadan Asphalt Company. The application was created utilizing Microsoft visual studio for the customer side and UI while MYSQL was utilized for the database. Framework flowchart was utilized to plan the application modules. Important information was collected from the data acquisition systems in Ile-Ife and Ibadan to build up the application. The application when actualized will empower clients living and working in the region of study to know the degree at which the air is contaminated, estimate the air information and store the examined information in a social database which will be refreshed intermittently for investigation.
The agent based approaches were discussed in [4][14]. An online web base arrangement is proposed the effect of meteorological and air poison segments on air tainting. It makes use of three sorts of agents: Collect , Coordinate and Query Mining agent. Query mining agent associate with the client, get client inquiries and mining demand, and convey the outcomes. Coordinate agent help to set up the information assets for the questioning undertakings.. Collect agent access the heterogeneous collections of online resources.
In paper [8] classifiers are broadly discussed for noise pollution classification, which can be further implemented on classification of source data sets during the pre processing .
The paper [1] proposed a spatial-temporal data mining based city air quality pulsation examination system. By introducing remote detecting data source and joining a couple of spatial-temporal data mining strategies.
In paper [5], we specifically study the spatial knowledge discovery problems involving proximity relationships between clusters and features.
A study on spatial data mining as a tool for improvement of geo-graphical models was made in [13]. In this, author examined the usability of the spatial data mining technique for the enhancement of an existing geo models for rescue process. The main focus of spatial data mining is set on the discovery of interesting patterns of information embedded in large geographical databases. After explanation of spatial data mining techniques, this thesis explains about association rule mining in more detail. Discovered spatial association rules may perceive constructive relationship between spatially distributed objects. Once the relations are acknowledged, the obtainable spatial model can be extended by the variables with strongest relations to the modeled fact.
The paper [7] highlights recent theoretical and applied research in spatial data mining and knowledge discovery. A brief analysis in [9] , [11] provide statistical demonstration of air pollutants in Delhi NCR similarly in [2] study of variation in Air Quality with GIS approach was examined for Burdwan town.
National Ambient Air Quality Standards(Source CPCB web site)
Table -1 AQI Standards
Pollutant Type
Standard Concentration
Averaging Time
SO2 Primary 80 µg/m3 24-hour
SO2 Primary 50 µg/m3 annual
PM10
Primary and
Secondary 100 µg/m3 24-hour
PM2.5 Secondary 40 µg/m3 24-hour
PM2.5 Primary 60 µg/m3 annual
CO Primary 4 µg/m3 1-hour
CO Primary 2 µg/m3 8-hour
O3
Primary and
Secondary 180 µg/m3 1-hour
O3
Primary and
1162
NO2
Primary and
Secondary 40 µg/m3 annual
Pb
Primary and
Secondary 0.5 µg/m3 annual
NH3 Primary 100 µg/m3 Annual
Benzene Primary 5 µg/m3 Annual
Arsenic Primary 6 ng/m3 Annual
Nickel Primary 20 ng/m3 Annual
One of the major issues encountered in the process of action plan development is availability of good data, accessibility as also adequacy of spatial, temporal and chemical information. The opportunity to discover, access and understand air quality data from various sources for examining, processing, overlaying and displaying would offer an added dimension to the air quality management processes in the country.
The ‘Scalable Geo Web Techniques using Spatial Data Mining’ vision provides a structure for environmental data to be easily available through an interoperability framework that allows them to be used via various subsets and combinations in support specific research and decision applications.
4. PROPOSED MODEL / SOLUTION
4.0 FRAME WORK:
Scalable Geo Web Techniques using Spatial Data mining means collecting multi-source time-space data, spatial interpolation, incorporating different data mining strategies to find the pulsation features of the city, discover the internal factors of environmental issues, Geo Visualization of Air Pollution and providing gate way through OGC Web Services i.e. WMS,WFS,WCS to researchers ,scientists for further research & analysis. It incorporates the accompanying procedure: data acquisition, data preprocessing, data mining and results displaying. Scalable Geo Web Techniques using Spatial Data Mining framework is as given underneath:
Fig.1 Framework
4.1 Data Acquisition:
The single source of data problem commonly be present in air pollutant dispersion models, monitoring method, we use multi-source data to carry out air quality pulsation analysis[1]. The key data source take account of:
Geo -meteorological data, Geo-pollution data, Pollution Source Data and Site Monitoring Data i.e. Traffic Condition, Towers, Fountains & other factor data which dynamically effecting air pollution.
4.11 Geo- Metrological Data:
We can get different meteorological information from metrological department; it incorporates the thickness of pollutants, air temperature, wind speed, humidity wind heading etc. By means for spatial interpolation and modeling, we can obtain the time-space map of air quality parameters; we utilize it as the input and validations[1].
4.12 Geo-Temporal Pollution Data :
We can get various Air pollution data by air quality monitoring stations. DPCC presently manage six monitoring stations, at the same time as CPCB runs nine, although there are overlaps in terms of locations. One more group SAFAR, under the Ministry of Earth Sciences, controls another eight stations. it includes theSO2, NO2,O2,Pb,Ag, CO,PM2.5,PM10 etc. as per standards notified by the Government of India.
4.13 Pollution Source Data:
Air pollutants incorporate point source pollutants and natural causes. In the city ecological unit, mostly incorporates industrial pollution, living contamination, sand and dust, traffic source and so on. For point source data, apart from position, it should contain the physiochemical factor relating to the pollutant dispersion. Let take a chimney stalk for case in point, we require the data about location, pollutant nature, chimney height, radius, gas temperature, fumes speed, emission of pollutants and so on .With respect to living pollution information, we apply a spatial grid cut, compute the net emission within the grid. For sand and dust Information, we make a time-space model according to metrological station and wind information to get the pollutant distribution[1].
4.14 Site Monitoring Data:
Air pollutants may include mobile source pollutant. For traffic pollutant, we use the vehicle- mounted GPS tracks data to acquire the pollutant location, combined with vehicle pollutant emissions information to compute the pollutant distribution. We can also use the Standard APIs and make functions to calculate the number of Vehicles in particular zone. For fountains we should have on site survey records about timings, fountain height, radius etc. Fountains are always helpful to minimize the Particulate Matter in Air Pollution. Other parameters also can be recorded time to time monitoring the sites.
4.15 Library of Maps.
Standard Maps with all attributes are base of the application. The rich set of Maps 1:50K, 1:250K, 1:1000K can be used. The main source of the maps is Survey of India (SOI). Bhuwan API are also can be used to put the Geo Spatial Layers of Air Pollution concentration.
4.2 Spatial-Temporal Data Mining:
1163
[image:4.595.39.284.95.186.2]examples and find inner elements which may impact the air quality and the relations between these elements [1].
Fig. 2 Spatial Data Mining
4.21 SPATIAL DATA MINING TECHNOLOGIES The techniques we lead spatial data mining will specifically influence the nature of discovered learning. The fundamental hypotheses for spatial data mining incorporates likelihood hypothesis, prove hypothesis, probability, clustering analysis ,spatial statistics, rules presentation, fuzzy data sets, neural networks, genetic algorithms, visualization, decision tree spatial analysis, spatial online investigative mining. These techniques are not isolated connected, to discovery an uncommon sort of learning; we frequently need to incorporate a few speculations and strategies as indicated by our exceptional needs.
The implementation of machine learning and artificial intelligence can improve automation which may decrease the participation degree of human-computer interaction [1].
4.3 RESULTS PRESENTATION
Visual mapping can show our data mining knowledge and results in a visual way, make the Original abstract results concise, and deepen our understanding about features, relations, patterns and trends about the knowledge[6].
Further, appropriate visual results with geo referenced layers of maps can be accessed through standard OGC Web Services (WMS, WFS,WCS). This will extend the interoperability. These OGC Web Services offer a standard HTTP interface for requesting a geospatial map image. The advantage of this is WMS customers can ask for map featured data from different WMS servers. The standard ensures that these pictures can all be overlaid on each other as they really would be actually.
Numerous servers and clients support WMS. That will open the gate for research and analysis for further extensions.
5. METHODOLOGY
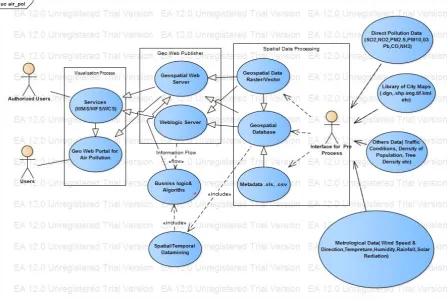
Use Case Diagram for the Scalable Geo Web Techniques using Spatial Data Mining in given Figure 2.
Fig. 2 Use Case Diagram for the Scalable Geo Web Techniques using Spatial Data Mining
5.1 INTERFACE FOR PRE PROCESS
Interface for Pre Process will work as data acquisition engine for multi sources data which will injected
[image:4.595.75.523.380.680.2]1164
monitoring stations. The Spatial data is processed in Raster/Vector format.
The classifiers are also can be used to classify the input data according to the certain rules. [8]
CODE LIST REGISTERS FOR AIR QUALITY INDEX (Source CPCB website)
5.2 SPATIAL DATA PROCESSING
Spatial data processing functions are the common base to all GIS services. It is very resource intensive. Spatial data processing utilizes huge volumes of geo data to answer specific queries. The output may be numeric, a code, a list of products or of course, a map. For the ‘Scalable Geo Web Technologies using Spatial Data Mining for Air pollution’, we make use of Oracle Spatial for data processing. The data which we get from different agencies and after preprocessed. These data required to be process using specific processing tools (e.g. FME, Oracle Map Builder) through which the process data converted to the specific format. These converted data import into the Spatial table in which spatial indexing for each table has to be done in oracle database.
5.3 PROCESSED DATA VERIFICATION
[image:5.595.316.556.54.191.2]Processed data must be checked and update before service creation. In oracle map builder the data source is created using oracle spatial tables from oracle database. In spatial database table there are different information divided into different parts of map builder (e.g. Geometry Theme, Annotation Themes) and this information is coming from Geometry Tables, Annotation table.
Fig. 3 Pre-viewing the created India theme on raster layer OSM(Open Street Map)
Fig. 4 Viewing the Theme attributes theme on raster layer OSM(Open Street Map)
5.4 WEB SERVICES CREATION
Before web services creation, middleware tools require for deployment of Map Viewer. In map viewer, oracle spatial data source is connected for further service creation. In web logic map viewer is deploy on port 7001. Path of the map viewer is http://IP-address-of-server:7001/mapviewer
5.5 VISUALISATION PROCESS
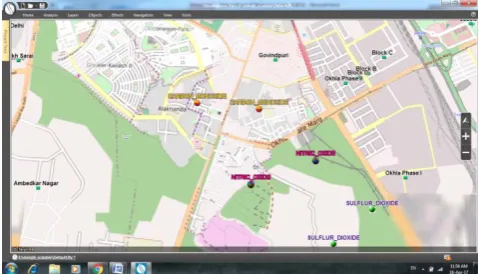
[image:5.595.36.284.135.247.2]Created layers and Services are visualized in any third part GIS tool i.e. QGIS. It is easily to identify the location with details attribute table.
[image:5.595.318.564.353.502.2]Fig. 4 The attribute values of pollution Data shown through QGIS
[image:5.595.37.284.568.693.2]1165
Fig. 6 displaying of different point layers of pollution data through QGIS
6. RESULTS & DISCUSSIONS
The visual results of Scalable Geo-Web techniques using data mining for air pollution in Delhi-NCR can assist in making of strategies to control the air pollution. Real time Analysis may also assist to evaluate the impact of existing policies i.e. Odd-Even Approach in Delhi-NCR. The border areas are also marked for the actual flow of air pollution. The citizens may visualize the surrounding environment. The public can also estimate and forecast the air quality and meteorological condition by providing some parameters.
WMS/WFS/WCS Geo Services will work as HTTP interface for new development for Research & Analysis for Scientists. The beneficiaries of the techniques would Research community and other GEO service sharing groups .These services can be extended for new innovative applications by other departments & government. This can be also toggle with Bhuvan(GOI).
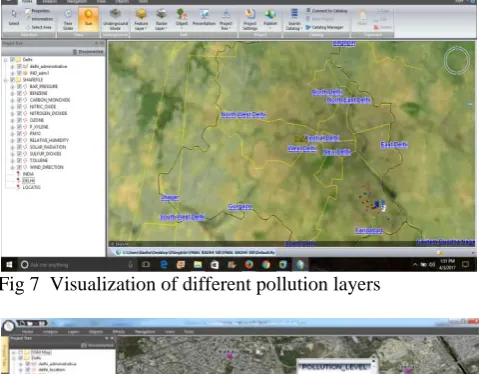
The visual results of the different layer of pollution data in figure 7& 8. Here each layer of pollution data is showing on the appropriate location on the map windows.
Fig 7 Visualization of different pollution layers
Fig 8 Pollution point layer with attribute
7. CONCLUSIONS
The quality of the air is very vital to our health and to all other living beings. Delhi-NCR is facing so many types of pollution. The main concerned is to visualize the air pollution and reason/source of pollution for each geographical zone. Scalable Geo-Web Application using data mining for air pollution in Delhi-NCR can perform the analysis of pollutant information to calculate air quality index and forecast data. The system will also open the gate for extension for new research & design using the WMS/WFS/WCS OGC web services. The ultimate goal is to help end users search and use local and global air quality data available through Scalable Geo-Web techniques using data mining for air pollution to improve decision making.
8. REFERENCES
[1] Xiang Li Ling Peng, Tianhe Chi, Jing Shao, Shaolong Cui , “City Environment pulsation research based on Spatial-temporal Data Mining-Air quality as an example”, International Conference on Advances in Energy and Environmental Science (ICAEES 2015), DOI: 10.2991/icaees-15.2015.74
[2] Subrata Chattopadhyay, Srimanta Gupta, Raj Narayan Saha , “Spatial and Temporal Variation of Urban Air Quality: A GIS Approach” , Journal of Environmental Protection, ,2010,vol 1, pp. 264-277 doi:10.4236/jep.2010.13032 [3] E. O. Ofoegbu, M. A. Fayemiwo, and M. O. Omisore, “Data
Mining Industrial Air Pollution Data for Trend Analysis and Air Quality Index Assessment using A Novel Back End AQMS Application Software” (International Journal of Innovation and Scientific Research 2014, Vol. 11 No. 2 Nov. 2014, pp. 237-247
[4] S. Sathappan, Dr. D.C. Tomar, “A Novel Application of Spatial Data Mining in Air Pollution”, (IJITR) INTERNATIONAL JOURNAL OF INNOVATIVE TECHNOLOGY AND RESEARCH Volume No.4, Issue No.1, 2016
[5] Edwin M. Knorr and Raymond T. Ng. “Finding Aggregate Proximity Relationships and Commonalities in Spatial Data Mining”, IEEE TRANSACTIONS ON KNOWLEDGE AND DATA ENGINEERING, VOL. 8, NO. 6, DECEMBER 1996
[6] Jawaiei Han Michelle Kamber, “Data Mining Concepts and Techniques”, Morgan Kaufmann Publishers, 2001
[7] Diansheng Guo , Jeremy Mennis , “Spatial data mining and geographic knowledge discovery—An introduction”, Elsevier, Computers, Environment and Urban Systems 33 (2009) ) pp. 403–408
[8] Safdar Tanweer , Abdul Mobin and Afshar Alam, “Environmental Noise Classification using LDA, QDA and ANN Methods”, Indian Journal of Science and Technology, Vol 9(33), DOI: 10.17485/ijst /2016 / v9i33 /95628, September 2016
[9] Naresh Kumar, Andrew D. Foster, “Air quality interventions and spatial dynamics of air pollution in Delhi and its surroundings”, Int. J. Environment and Waste Management, Vol. 4, Nos. 1/2, 2009.
[10] S. Enrique Puliafito, Miguel A. Gantuz, Carlos M. Puliafito, “A GIS MODEL FOR URBAN AIR QUALITY ANALYSIS”, (Mec´anica Computacional Vol. XXIII, pp. 1787-1806 ,2004)
[image:6.595.37.277.477.664.2]1166
[12] Kanakiya, R.S., Singh, S.K. and Shah, U., “GIS Application for Spatial and Temporal Analysis of the Air Pollutants in Urban Area”, International Journal of Advanced Remote Sensing and GIS 2015, Volume 4, Issue 1, pp. 1120-1129,
[13] V. Karasov, “Spatial data mining as a tool for improving geographical models” , Dept. Surveying, Helsinki Univ. Technol., 2005.
[14] Vincent Ng, Stephen CF chan, Sandra Au “Web agents for Spatial Mining on Air Pollution”,(IEEE ,Year: 2001 ,Pages: 293- 298, DOI: 10.1109/CSCWD.2001.942274 [15] Jothika Nair, Roshni Chopra, “Spatial exploration of air