UCL
Catalytic Combustion without Reactant
Premixing
Marcello Murru
U niversity College L ondon A pril, 2003
All rights reserved
INFORMATION TO ALL U SE R S
The quality of this reproduction is d ep en d en t upon the quality of the copy subm itted.
In the unlikely even t that the author did not sen d a com plete manuscript
and there are m issing p a g e s, th e se will be noted. Also, if material had to be rem oved, a note will indicate the deletion.
uest.
ProQ uest 10015031
Published by ProQ uest LLC(2016). Copyright of the Dissertation is held by the Author.
All rights reserved.
This work is protected against unauthorized copying under Title 17, United S ta tes C ode. Microform Edition © ProQ uest LLC.
ProQ uest LLC
789 East E isenhow er Parkway P.O. Box 1346
A C K N O W L E D G M E N T S
I wish to express my gratitude to my principal supervisor, Dr. Asterios Gavriilidis, for granting me the opportunity to carry out this exciting research, and for his support throughout the project. I also wish to thank my secondary supervisor. Dr. Eric Fraga for his support, and the Engineering and Physical Sciences Research Council (EPSRC) for sponsoring this work.
A lbertino Prabowo deserves a special mention in this acknowledgments for actively con tributing in the preparation of catalysts experiments and for dem onstrating his friendship. I wish to express my gratitude to “Prof. Rigopoulos” for all the enlighting conversations about numerical m ethods and to Kevin Reeves for always trying to “see w hat he could do” .
In the following long list (A lbertino’s style) I want to th an k all the people who gave a less “technical” still invaluable contribution to this achievement.
My parents and my sister for being always ready to support me when I needed it.
“L ’amico R osetti” and “Pezzasinuu piccolo” for behaving w ith me like only brothers would do.
“Sgallett” and “11 Santuom o” , “Ralfopoulos” and “T ia B ania” to whom I wish a long and happy life together.
Jane, M artin, Claire and Duncan for helping me understand and appreciate English culture and traditions and in most cases showing me their best aspects.
C O N T E N T S
L ist o f fig u r e s... v
List o f t a b l e s... xii
1. In tro d u c tio n... 1
2. Literature r e v i e w... 5
2.1 Gas turbines ... 5
2.1.1 Mechanisms of nitrogen oxide production... 6
2.1.2 Nitrogen oxide emission c o n tr o l... 8
2.1.2.1 Selective Reduction of N O x ... 9
2.1.2.2 Lean premix te ch n o lo g y ... 10
2.1.2.3 Injection of w ater into the gas turbine com bustor (wet con trol) 10
2.2 C atalytic C o m b u s tio n ... 11
2.2.1 C urrent applications of catalytic com bustion ... 14
2.2.2 Monolithic systems for catalytic gas turbine c o m b u s to r s ... 15
2.2.2.1 C atalytic Stabilised Combustion ( C S T ) ... 16
2.2.2.2 Hybrid d e s i g n ... 17
2.2.2.3 Staged catalytic combustion ... 19
2.2.3 P d and P t catalysts for m ethane c o m b u s t io n ... 21
2.3 Inorganic M embrane R e a c to rs ... 29
2.3.1 Reaction and s e p a r a tio n ... 31
2.3.2 Membranes for controlled addition of r e a c t a n t s ... 32
2.3.3 Membrane reactors as catalytic f i l t e r s ... 33
2.3.4 C atalytic membrane reactor w ithout reactant p re m ix in g ... 34
2.3.4.1 Membrane reactors in catalytic c o m b u s tio n ... 36
2.3.4.2 Modelling of catalytic membrane reactors w ithout reactant p rem ix in g ... 37
2.3.5 Membrane sealing ... 40
2.4 C atalyst p r e p a r a tio n ...41
2.4.1 Im pregnation of c a t a ly s t ... 41
2.5 Diffusion m o d e l s ...48
3. Model for diffusion controlled reactions... 55
3.1 In tro d u c tio n ...55
3.2 Model d escrip tio n ... 56
3.3 Governing e q u a t io n s ... 56
3.4 Results and d is c u s s io n ... 65
3.5 C o n c lu sio n s... 70
4. M athem atical modelling o f membrane r e a c to r... 72
4.1 In tro d u c tio n ...72
4.2 Physicochemical and design d a t a ... 73
4.3 Governing e q u a t io n s ... 75
4.3.1 Fluid phases b a l a n c e s ... 78
4.3.2 M embrane model equations for isobaric systems using Pick’s law . . 80
4.3.3 M embrane model equations using D G M ...82
4.3.3.1 Mass and heat b a la n c e s ... 82
4.3.3.2 Dimensionless correlations for the calculation of heat and mass transfer c o e ffic ie n ts ... 88
4.4 Numerical m e th o d s ...90
4.4.1 Shooting methods of Nag library routine D 0 2 H B F ... 92
4.4.2 Time dependent solution using ODE subroutine ... 93
4.4.3 Finite differences using custom made p ro g ra m m e ... 96
4.4.3.1 Finite difference solver testing and v a lid a tio n ... 102
4.5 Validation of m o d e l s ... 103
4.5.1 Comparison between ID and 2D model of monolithic reactors . . . . 103
4.5.2 Simulation of membrane reactor e x p e r im e n ts ... 107
4.6 Results and d is c u s s io n ... 108
4.6.1 Axial and radial tem perature and concentration p r o f il e s ... 109
4.6.2 Effect of calculation m ethod of mass transfer resistances (Fick, Gen eralised Fick)...113
4.6.3 Effect of structural properties of porous m embrane on reactor per formance ...115
4.6.4 Effect of inlet tem perature on reactor p e rfo rm a n c e ... 117
4.6.5 R eactor operation in presence of radial pressure g r a d i e n t s ... 118
4.6.6 Performance under typical gas turbine conditions and comparison with catalytic m o n o lith s ...121
_______________________Contents________________________________________ ^
5. Preparation o f c a ta ly s t... 129
5.1 In tro d u c tio n ...129
5.2 M embrane p r e p a r a tio n ... 131
5.2.1 Experim ental procedure of Si0 2 d e p o s i t i o n ... 131
5.2.2 Freeze d r y i n g ... 133
5.3 M embrane c h a r a c te r is a tio n ...133
5.3.1 SEM a n a ly s is ... 134
5.3.2 M ercury p o ro sim e try ... 134
5.3.3 Perm eability tests ...135
5.4 C atalyst im p re g n a tio n ... 136
5.4.1 Palladium catalysts ... 136
5.4.2 P latinum c a t a l y s t s ... 137
5.5 C atalyst characterisatio n... 137
5.5.1 Atomic absorption spectroscopy...137
5.5.2 Electron microprobe. EDX quantitative a n a l y s i s ...139
5.6 Results and d is c u s s io n ... 139
5.6.1 Drying with heat or freeze d r y i n g ? ... 139
5.6.2 Effect of Si02 deposition m e th o d ... 141
5.6.3 Silica top layer i n h i b i t i o n ...151
5.6.4 Effect of im pregnating conditions on catalyst loading and distribution 155 5.7 C o n c lu sio n s... 158
6. Experim ental investigation o f catalytic combustion in a m em brane reactor . . . . 160
6.1 In tro d u c tio n ... 160
6.2 Experim ental s e t - u p ...162
6.2.1 Set-up c o n fig u ra tio n ... 162
6.2.2 Membrane sealing ...164
6.2.2.1 Radial s e a l i n g ... 164
6.2.2.2 Axial s e a l i n g ...166
6.2.3 Heating and insulation of membrane r e a c to r ...168
6.2.4 Open and dead end co n fig u ratio n...171
6.2.5 Gas an aly sis...172
6.3 M embrane reactor e x p e r im e n ts ... 175
6.3.1 Pore size and operability of m embrane reactor ... 176
6.3.2 Open end c o n fig u r a tio n ... 176
6.3.2.1 Effect of heat supplied and inlet m ethane concentration . . 1 7 7 6.3.2.2 Effect of trans-m em brane pressure gradients ...182
6.3.3 Behaviour of platinum supported on modified a-A l2 0 smem branes . 185 6.3.4 Dead end configuration ... 187
6.5 C o n c lu sio n s ...194
7. Conclusions and future work ... 195
7.1 M embrane reactors as potential gas turbine com bustors...196
7.1.1 O ptim al catalyst d is tr i b u tio n ... 197
7.2 Possible shapes and arrangem ents of a multichannel catalytic ceramic mem brane reactor w ithout reactants prem ixing... 198
B I B L I O G R A P H Y... 201
A pp en dix 220 A. Palladium and platinum loading m easurement through A tom ic absorption . . . .2 21 B. Data and correlations used for the theoretical s tu d y o f the m em brane reactor . . 223
C.
Generalised P ick’s law and film t h e o r y... 227D. F O R T R A N 90 source code o f finite difference solver... 232
E. F O R T R A N 90 mem brane reactor programme ... 246
LIST OF FIGURES
2.1 Schematic of a conventional gas tu rbine... 6 2.2 Current m ethods of NOx control (Ismagilov and Kerzhentsev, 1990) . . . . 9 2.3 C atalytic rate curve with gas phase reaction (Pfefferle and Pfefferle, 1987). 12 2.4 Schematic profiles of tem perature and NOx emissions in a com bustor (Arai
and Machida, 1991)... 13 2.5 M onolith channel schematic for catalytic stabilised com bustion (Pfefferle
and Pfefferle, 1 9 8 7 )... 16 2.6 Hybrid combustor configuration according to Ozawa et al. (1998a)... 18 2.7 Staged catalyst design (Dalla B e tta e t ah, 1995b) and schematic of XONON® tech
nology applied to a Kawasaki gas tu rb in e... 20 2.8 Arrhenius plot for reaction over the P d and the PdO catalyst states
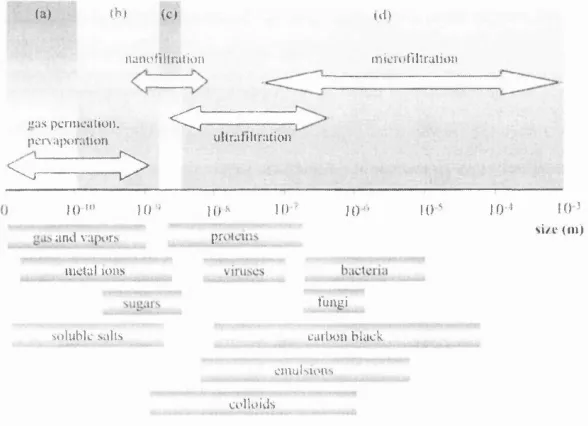
(Lyu-bovsky and Pfefferle, 1999b)... 27 2.9 Classification of membranes based on their pore size (Sanchez-Marcano and
Tsotsis, 2002)... 30 2.10 Configuration of membrane reactor for combined reaction and separation
(Sanchez-Marcano and Tsotsis, 2002) ... 32 2.11 Layout of membrane reactor for controlled distribution of oxygen along the
catalyst bed (Hou et ah, 2001) ... 33 2.12 Application of membrane reactor as a catalytic filter for pollutants abate
ment (Coronas and Santam aria, 1999)... 33 2.13 Configuration of membrane reactor w ithout reactant premixing for the com
bustion of propane (saracco and Specchia, 1995)... 34 2.14 a) molar fraction profiles of two generic reactants predicted by th e simplified
model for the theoretical of Saracco et ah, 1995. b) Molar fraction profiles of reactants and products calculated w ith the model developed by Neomagus et ah (2000) in the case of catalytic combustion of m ethan e... 39 2.15 Velterop B.V. ceramic-to-metal sealing...41 2.16 Possible distribution of active component in spherical pellets...43 2.17 fleet of Co-impregnant on the D istribution of Active Com ponent (M aatm an,
1959)... 45 2.18 The effect of precursor concentration and drying rate in active component
2.19 Pictorial representation of interaction between different molecules in a bi nary system (Taylor and Krishna, 1 9 9 3 ) ... 50 2.20 Representation of gas diffusion in a porous medium according to assump
tions of the DGM K rishna and Wesselingh (1997)... 51 2.21 Mason and Malinauskas electrical circuit parallel as a mnemonic device for
combining different transpo rt mechanisms (Mason and Malinauskas, 1983). 52 3.1 Tem perature and molar fractions profiles along th e m embrane radius for
infinitely fast reactions... 57 3.2 Schematic of membrane reactor referenced in the m odelling... 57 3.3 Axial tem perature profile. Inlet tem perature of tu b e and shell side 723K.
Tube side radius is 1mm and 0 = 2.33. Overall m ethane inlet molar fraction is 2.5%, inlet velocity tube side = 15m/s and e / r = 0.04... 65 3.4 Axial profiles of m ethane and oxygen molar fractions in th e gas phases and
conversion. Inlet tem perature of tub e and shell side is 723K. Tube side radius is 1m m and 4> = 2.33. Overall m ethane inlet molar fraction is 2.5%, inlet velocity tube side = 15m /s and e / r = 0.04... 66 3.5 Dimensionless position of reaction radius along the axial coordinate.Inlet
tem perature of tube and shell side is 723K and 0 = 2.33. Overall methane inlet molar fraction is 2.5%, inlet velocity tub e side = 15m /s and e / r = 0.04. 0 corresponds to the tube side surface and 1 to the shell side. R t is the inner membrane radius...67 3.6 Dependence of conversion and outlet shell (Ts) and m em brane tem perature
(Tr) on internal membrane radius with 0 =2.33. Overall inlet methane molar fraction is 2.5%, inlet velocity shell side is 15m /s and e / r = 0.04. . . 67 3.7 Dependence of conversion and outlet shell (Ts) and m em brane tem perature
(Tr) on internal membrane radius w ith (j) =3.0. Inlet overall m ethane molar fraction is 2.5%, inlet velocity shell side is 15m /s and e / r = 0 . 0 4 ... 68 3.8 Dependence of conversion and outlet shell (Ts) and m em brane tem perature
(Tr) on internal membrane radius w ith (j) =4.0. Inlet overall m ethane molar fraction is 2.5%, inlet velocity shell side is 15m /s and e / r = 0.04... 68 3.9 Dependency of conversion and outlet tem peratures from param eter e /r .
Geometry of the membrane is fixed for all runs. R t= lm m , 0 = 2.33, in let velocity shell side equal to 15m/s, inlet tem perature 723K and overall methane molar fraction equal to 2.5% ... 69 3.10 Effect of inlet velocity on conversion and outlet tem p erature for methane
List o f Figures
3.11 Effect of inlet overall m ethane molar fraction. M embrane internal ra-d iu s= lm m , (f) =2.33, inlet velocity 15m/s, inlet tem perature 723K and e / r =0.04... 71 4.1 Axial tem perature profiles in a monolithic reactor. Comparison between
G roppi’s and Yu Yao kinetics. In the legend, f and s refer to fluid and solid phase respectively... 74 4.2 3D schematic of membrane r e a c t o r ... 75 4.3 2D schematic of membrane r e a c t o r ... 76 4.4 Dependency of asym ptotic values of Nu from the ratio R m s/R e in annular
passages. D ata from Lundberg et al. ( 1 9 6 3 ) ... 90 4.5 Interpolation algorithm of axial integration m e th o d ... 91 4.6 Block diagram of tim e dependent p r o g r a m m e ... 94 4.7 Finite difference solution for Pe = 20 and 50 102 4.8 Schematic of monolithic r e a c t o r ...103 4.9 Comparison between 3 models. Tg and Ts indicate tem peratures of gas and
solid respectively. G. F. stands for generalised Fick’s law and F. for Fick’s law... 107 4.10 Param eters used for the modelling; e / r = 0.402, knudsen coefficient Kq =
3.08 • 10-9 108
4.11 Shell and tub e side tem peratures and conversion profiles along the reacto r’s main axis. = tem perature of the tube side, Tg = tem perature of the shell side, T^ = tem perature of the m em brane... 109 4.12 Tem perature profiles calculated using the simplified model of chapter 3 at
the same conditions of figure 4.11... 110 4.13 Radial molar fraction profiles in A) inlet section axial coordinate z = 0, B)
middle section z = 0.05 and C) outlet section z = 0 .1m ... I l l 4.14 Radial tem perature profiles at various axial positions. Same conditions of
figure 4.11 were used. Continuous lines refer to tem perature differences (left axis) and dashed lines to reaction rates (right axis)... 112 4.15 Comparison between Fick’s and generalised Fick’s law. A indicates th a t
mass transfer coefficients are calculated using Fick’s law and B generalised Fick’s law. The number refers to the component whose equations are dis carded in th e boundary conditions; 1 for N2 and 2 for CH4. e / r = 0.098, Ps — Pt = lOOmbar and inlet tem perature is 673K... 114 4.16 Effect of changes in the porous structure of the membrane on conversion
(conv), outlet solid tem perature (T^) and shell side tem perature (Tg). . . .1 1 6 4.17 M ethane conversion and gas and solid outlet tem peratures as a function of
4.18 Gas and solid outlet tem peratures with the application of pressure differ ences across th e membrane. Tube side pressure was kept to lObar and shell side pressure progressively increased, A P = Pg — P t... 118 4.19 Effect of different permeabilities in presence of lOOmbar pressure difference
applied across the membrane on outlet gas and solid tem peratures and conversion... 119 4.20 Effect of radial pressure gradients in a thick m em brane...120 4.21 Radial molar fraction and reaction rate profiles at different pressure differ
ences applied across the membrane. A positive pressure difference indicates higher pressure in the shell side as A P = Pg — P t...122 4.22 Schematics of monolith and m em brane...123 4.23 Axial tem perature profiles of a membrane reactor w ith hydraulic diameter
(shell side) of 1mm. Overall inlet m ethane molar fraction is 2% and inlet velocity of air is 8m /s, Inner radius is 0.5mm, outer m em brane radius is 1mm and reactor shell radius is 1.5mm... 124 4.24 Axial tem perature profiles of monolith w ith the same hydraulic diam eter
(A) and cross sectional area (B) of the membrane in figure 4.23. Inlet conditions are the same of figure 4 .2 3 ... 125 4.25 Comparison between monolithic (case B) and m embrane reactor at different
m ethane inlet molar fraction... 125 4.26 Comparison between monolithic and membrane reactor at different m ethane
inlet molar fraction...126 4.27 Comparison between monolithic and membrane reactor at different m ethane
inlet molar fraction...127 5.1 Experim ental procedure o f ’’old batch” m e m b ra n e s ...132 5.2 Experim ental procedure o f ’’new batch” m em branes... 132 5.3 P latinum distribution for oven dryed (a) and freeze dried (b) samples. . . . 140 5.4 EDX m apping of cross section of P t supported on Si0 2 /A l203 catalytic
membrane prepared by freeze drying...140 5.5 Perm eability of several membranes at the end of each cycle of Si02 deposition. 143 5.6 SEM line scan of a cross section of membrane A* after 3 cycles, a- Picture
of th e line location across the whole section, b- Q uantitative graph of silica percentage... 145 5.7 SEM line scan of a cross section of membrane A* after 5 cycles, a- Picture
of the line location across the whole section, b- Q uantitative graph of silica percentage...145 5.8 SEM line scan of a cross section of membrane A* after 6 cycles, a- Picture
List o f Figures ix
5.9 SEM line scan of a cross section of membrane A* after 6 cycles, a- Picture of the line location 20/rm from the outer surface, b- Q uantitative graph of silica percentage...146 5.10 SEM line scan of a cross section of membrane A* after 6 cycles, a- P icture
of the line location 20/rm in the centre of the section, b- Q uantitative graph of silica percentage... 146 5.11 SEM line scan of a cross section of membrane A after 6 cycles, a- P icture
of the line location near th e outer surface, b- Q uantitative graph of silica percentage... 146 5.12 SEM line scan of a cross section of membrane H after 10 cycles, a- Picture
of the line location 10/rm from the outer surface, b- Q uantitative graph of silica percentage...147 5.13 SEM line scan of a cross section of membrane H after 10 cycles, a- P icture
of the line location 60/rm in the centre, b- Q uantitative graph of silica percentage... 147 5.14 SEM pictures of a cross section of an unmodified membrane from the new
batch, a- O uter zone, b- Central zone... 148 5.15 SEM pictures of: a- O uter zone of a cross section of an unmodified mem
brane from the new batch, b- outer zone of the cross section of membrane A (6^^ cycle) ...148 5.16 SEM pictures of membrane A (6*^ cycle), a- C entral zone of the cross
section, b- E xternal surface tilting th e SEM stag e... 149 5.17 SEM pictures of a cross section of m embrane A* (7^^ cycle), a- O uter zone.
b- Central zone...149 5.18 SEM pictures of membrane A* (7*^ cycle), a- E xternal surface, b- Internal
surface... 149 5.19 SEM pictures of membrane A (6^^ cycle) after grinding the external and
internal surfaces, a- E xternal surface, b- O uter zone of a cross section. . . . 150 5.20 SEM picture of central zone of cross section of membrane A (6^^ cycle) after
grinding...150 5.21 SEM pictures of: a- External surface of membrane B (10^^ cycle), b- Ex
ternal surface of membrane C (10^^ c y c l e ) ...152 5.22 SEM pictures of a cross section of m embrane C (10^^ cycle): a- O uter zone.
b- Central zone...152 5.23 SEM pictures of: a- External surface of m embrane D (10*^ cycle), b- Ex
ternal surface of membrane E (10*^ c y c l e ) ...153 5.24 SEM pictures of a cross sections of membrane E (10^^ cycle): a- O uter zone.
b- Central zone...153 5.25 SEM pictures of: a- E xternal surface of membrane F (10*^ cycle), b- Ex
5.26 SEM pictures of: a- E xternal surface of membrane H (10*^ cycle), b- Ex
ternal surface of membrane I (7^^ cycle)...154
5.27 M ercury porosim etry analyses of outer and central zone of membrane H. . . 155
5.28 Effect of im pregnation tim e on catalyst loading... 156
5.29 Effect of P d concentration in im pregnating solution on catalyst loading. . . 156
5.30 Radial palladium distribution of membrane B1 and B 2 ... 157
5.31 Radial palladium distribution of membrane B 3 ... 157
5.32 Radial platinum distribution for oven dried and freeze dried membranes. . . 158
6.1 Experim ental setup. MFC = mass flow controller, Vi = toggle valve, P C = pressure controller, 4PV = 4 way valve, lOPV = 10 port valve and DM = differential manometer. All the stream s connected to the various ’vent’ converge to the same exhaust... 162
6.2 Schematic of membrane reactor... 164
6.3 D etail of membrane reactor ’radial’ se a lin g ... 165
6.4 Tem perature path of oven treatm ent of enamelled m e m b ra n e s ... 166
6.5 New reactor “axial double hot-cold sealing” ... 167
6.6 Heating with furnace and insulation of membrane reactor w ith silica wool . 169 6.7 M embrane reactor preheating w ith heating cables...170
6.8 Tem perature profile of membrane reactor w ith preheating using heating cables... 170
6.9 10-port Valeo valve. A position: sample 1 is injected and analysed in the column. B position: sample 2 is injected. Courtesy of V a le o ... 174
6.10 Tube and shell side tem perature profiles for membrane reactor when the voltage applied to the heaters was 78V. T em perature recorded during a reaction ru n ...177
6.11 M ethane conversion and outlet tem perature tub e side. Voltage applied to heaters was 78V... 178
6.12 A) M ethane conversion of membrane reactor and relevant tem peratures. Voltage applied to the heaters is 85V. B) CO concentration in the outlet w ith the relevant tem peratures... 179
6.13 A) M ethane conversion of membrane reactor and relevant tem peratures. Voltage applied to the heaters is 90V. B) CO concentration in the outlet w ith th e relevant tem peratures... 179
6.14 A) M ethane conversion of membrane reactor and relevant tem peratures. Voltage applied to the heaters is 96V. B) CO concentration in the outlet w ith the relevant tem peratures... 180
List of Figures xi
6.16 M ethane slip from tube to shell side for inlet m ethane m olar fraction of 0.122.181 6.17 Convective flow rate through membrane vs. trans-m em brane pressure dif
fer ernce. Results obtained under reaction conditions w ith 90V applied to
the heaters...184
6.18 Conversion of methane with trans-m em brane pressure gradients applied. 90V were applied to the heaters and inlet m ethane molar fraction was 0.22. 184 6.19 CO (A) and H2 (B) production as a function of the pressure difference applied across the m em brane...185
6.20 Conversion of a Platinum membrane varying heat supplied to the reactor. Inlet m ethane (tube side) and oxygen (shell side) molar fractions were 0.222 and 0.20 respectively. Tube side fiowrate 90m l/m in and shell side fiowrate 200m l/m in ... 186
6.21 Slip of m ethane from tube to shell side for a platinum supported mem brane.Inlet m ethane (tube side) and oxygen molar fractions were 0.222 and 0.2 respectively, tube side fiowrate 90m l/m in and shell side fiowrate 200m i/m in... 187
6.22 Stabilisation of conversion for a run at constant inlet tem perature. Shell side Flow rate (0 2 +H e) was 660m l/m in and tu b e side (CH4) 20 m l/m in. Inlet tem perature was 460°C ...188
6.23 Effect of inlet tem perature on m ethane overall conversion for dead end configuration... 188
6.24 Experim ental setup used for kinetic and stability study of m ethane com bustion. T h = thermocouple, 3PV = 3 way valve, lOPV = 10 way valve, MFC = mass flow controller... 189
6.25 Kinetic experiments using a lean m ixture. Inlet molar fraction of m ethane 3.5% balance air. A line refers to the aged catalyst and B to the fresh one. 192 6.26 Kinetic experiments using a m ethane rich m ixture. Inlet molar fraction of m ethane 31.4%, balance air... 192
7.1 F lat plates configuration c a t a l y s t ... 198
7.2 Hexagonal configuration of multichannel catalyst...199
7.3 a) Hexagonal-rhomboidal configuration of multichannel catalyst, b) Reduc tion of the rhomboidal channel cross section varying th e angle a...200
7.4 Square configuration c a t a l y s t ...200
7.5 Tubular configuration c a ta ly s t...201
A .l Palladium calibration curve for AAS linear range... 221
A .2 Platinum calibration curve for AAS linear range... 222
2.1 Level of NOx emissions for various control strategies (adapted from
Stam-bler, 1993)... 8
2.2 Design criteria and operating conditions of gas turbine com bustors (Forzatti and Groppi, 1999)... 15
2.3 Tested performances of hybrid combustor (Ozawa et al., 1 9 9 8 a )...18
2.4 Tested performance of XONON® com bustor... 21
2.5 M ethane kinetic rates on P d catalysts...24
2.6 M ethane kinetic rates on P d cataly sts...25
2.7 Summary of modelling works on catalytic inorganic m em brane reactors w ithout reactant premixing... 38
4.1 Conditions of base case for membrane reactor modelling... 75
4.2 Consistency of system of differential equations...88
4.3 Consistency of solution in tube side boundary. (The shell side can be treated in an analogous way)... 96
5.1 Resume of the various m ethods for preparation of m em branes...133
5.2 Pressure drop across membranes with different preparation m ethods for each cycle of deposition. Constant O2 flow rate lOOml/min. Values with the asterisk were measured with the pressure gauge... 142
5.3 Membrane permeability for each cycle of deposition of membranes with different preparation methods. Constant 0 2 flo w rate lOOml/min...142
5.4 Loading of samples B l, B2 and B 3 ... 157
6.1 CC conditions for gas analysis of open and dead-end experim ents... 175
6.2 Differences between the experimental conditions of th e present work and the ones by Saracco et al. (1995) and Neomagus at al.(2000). * C atalyst loading in Saracco et al. (1995) and Neomagus et al. (2000) refers to the weight of deposited qALOgwh ich, in turn has a loading of 4 w t% ... 183
6.3 Turnover numbers for lean and rich combustion experim ents. C atalyst load ing was 0.1 wt% for all the sam ples...193
A .l AAS Standard C u rv e ...221
List of Tables xiii
B.2 Coefficients of polynomials for calculation of heat capacities according to
equation B.7. Cp is expressed [J mol“ ^K ~^] 225
In recent years, environmental issues have received large attentio n by the international community and restrictive measures have been specifically planned for the reduction of pollutants in the atmosphere. Several scientists have foreseen a global climate change due to the increase of some gaseous pollutants (greenhouse effect) in th e atmosphere th a t will have a trem endous im pact on the near future. In order to address the problem of global warming, the world leaders m et in Kyoto, Japan in December 1997 and developed a plan to reduce pollutants emissions. According to well established theories, CO2 is the prim ary concern for the greenhouse effect. Since this gas is a product of combustion of any fuel th a t contains carbon, a restrictive measure on its emission has direct consequences on industrial application whereby fossil fuels are burned. Therefore, power plants, th a t can be regarded as having a major im pact on the environment, are prim arily affected by the new legislation.
A nother reason for concern is the reduction of the global am ount of oil th a t, according to some estim ations is due to be extinguished in about 50 years if the present rate of consumption is maintained.
In view of this dram atic perspective, a reduction of energy consum ption and a rational ization of the energy production m ethods are needed. N atural gas, due to its availability and its lower environmental im pact as compared to th a t of oil, represent a route for the solution of global warming and oil extinction. In particular, when burned, natural gas produces 41% less CO2 than coal and 20% less C0 2 th a n oiT.
At present, one of the most effective ways of converting energy from natural gas is by using gas turbines. These devices allow very high overall efficiency and limited dis charge of uncombusted hydrocarbons (UHC) and CO in th e atm osphere. However, the m ain drawback of gas turbines is the emission of other pollutants such as oxides of ni trogen (NOx) during conventional combustion. NOx are formed during high tem perature com bustion (beyond 1500°C) from the reaction of molecular nitrogen and oxygen radi cals (Zeldovich, 1946). Several processes were developed by gas turbine manufacturers reducing the am ount of NOx produced inside the com bustor a n d /o r removing the NOx produced in a post-com bustion clean-up stage. Among them , Dry-Low Nox (DLN from G eneral Electric) consists of diluting the reacting m ixture w ith air in order to reduce com bustion flame tem perature. This is achieved by premixing the fuel w ith excess air before
1. Introduction
entering the combustion chamber. Such technique is also called lean-premix combustion. Reduction of NOx can also be achieved injecting water or steam into the prim ary com bustion zone along w ith the fuel (wet control). Selective C atalytic Reduction (SRC) is a pollution clean-up technology th a t is applied to gas turbines th a t employ lean-premix combustion or wet control and consists in catalytically reducing NOx using ammonia. All these techniques are well established but they are rather expensive and require state of th e art technologies.
C atalytic combustion is an emerging technique th a t can represent a serious alternative to the processes developed on a single stage homogeneous combustion. An example of this technology is represented by the XONON® cool combustion system, developed by C at alytica Energy and already successfully operating on several small sized gas turbines. The catalytic combustion process for gas turbine applications (also nam ed hybrid combustion) is typically composed of two subsequent stages: the catalytic and th e homogeneous (Ko- laczkowski, 1995). The catalytic stage allows the combustion of p art of the inlet m ethane at low tem peratures resulting in a tem perature increase th a t can be high enough to ini tiate a further homogeneous combustion. A full catalytic system is not realistic since the required inlet tem perature of the gas turbine would be exceedingly high for the therm al stability of the catalyst. Monolithic systems are usually employed in catalytic combustors for gas turbine applications as they offer low pressure drops and large interfacial area provided th a t the size of the channels is small. Air at high pressure from the compressor is premixed with the fuel and preheated before being fed into th e catalytic stage of the combustor.
O bjective of this thesis is to investigate the applicability of a catalytic membrane reactor w ithout reactant premixing as a gas turbine combustor. The configuration of the m embrane reactor is not very different from th a t of the monolithic system. Gases flow through parallel channels and react inside the porous catalytic wall bu t differently from monolithic systems reactants are kept separated and fed in different channels.
Avoiding reactants premixing has an im mediate advantage in term s of space required for the combustor. Saracco et al. (1995a) also state th a t a membrane reactor w ithout reactant premixing is inherently safe as it is entirely controlled by diffusion at high tem perature and the porous wall is a physical barrier between th e two reactants. This design offers a very high versatility since it allows the independent variation of all the conditions on the channels on both sides of the membrane. Since in this m embrane reactor concept reactants are segregated by the membrane, fuel rich and fuel lean conditions are encoun tered within the membrane wall. In particular, the ratio O2/C H 4 tends to 00 in proximity to th e oxygen side and tends to 0 in proximity to the m ethane side. This can represent a difficulty in the experim ental and theoretical investigation of the membrane reactor since, as it is known (e.g. Burch and Loader, 1994) different reaction mechanisms can apply on precious m etal catalysts when reaction conditions are varied.
w ithout reactant premixing by Neomagus et al. (2000), and th e catalytic combustion of propane on the same system was investigated by Saracco et al. (1995a and b, 1996a, 2000). The catalytic membrane used in the mentioned works was prepared from a 100mm long, 14mm ID a —AI2O3 membrane support, modified w ith 7 —AI2O3 and im pregnated w ith P t. In the works by Saracco et ah (1995a and b, 1996a, 2000) and by Neomagus et al. (2000), reactor operated under isothermal conditions as th e heat of reaction was removed by a cooling tube placed inside the inner channel of th e tu bular membrane. Under suitable conditions, to tal conversion was obtained for bo th the hydrocarbons and relatively good control of the reactor was observed. Reactor operation was stable under all the conditions investigated and durability tests carried out by Neomagus et al. (2000) for m ethane combustion evidenced only slight deactivation of the P t catalyst. W hen positive or negative pressure gradients were applied on the membrane, conversion increased and reaction products were selectively directed towards one of the channels.
One of th e m ajor conclusions drawn by Neomagus et al. (2000) was th a t the heat produced by the membrane reactor for m ethane com bustion is too low if compared to premixed combustors. This is probably to be attrib u ted to the size of the channels and the inlet conditions used in their system rather th a n to an actual incapability of the reactor to produce heat. It can be dem onstrated th a t even monoliths deliver low heat if the diam eter of the channels is too large, yet they are widely used in catalytic combustion. Therefore, a fair assessment of the membrane reactor can be carried out only if suitably sized channels are used.
Various models on membrane reactors w ithout reactants premixing have been devel oped in the past (Sloot et ah, 1990; Saracco et ah, 1995a, 1995b, 1996a, 2000 and Neomagus et ah 2000). All models were isothermal and ID as they assumed plug flow conditions for the gases flowing in the channels of the membrane. If the m embrane reactor concept is to be used in a gas turbine combustor, the prim ary requirem ent is th a t the tem perature of the compressed gas fed to the reactor increases up to th e ignition point of the homoge neous reaction. Thus, main objective of a m athem atical model for th e system investigated in this thesis is to accurately assess the combination of heat and mass transfer w ithin the gas and the porous medium.
The present thesis is structured as follows:
In chapter 2 the state of the art of the fields relevant to the present work are reviewed through a critical summary of literature sources.
In chapter 3 a simplified model is presented th a t is applicable to the theoretical study of a diffusion controlled membrane reactors w ithout reactants premixing. The effect of geometric param eters and inlet conditions is investigated and a first indication of their operating range is provided.
1. Introduction
both kinetic and diffusion controlled reactions. Model equations are implemented as a set of three coupled ID problems relative to the fluid phase in the tu be side, th e fluid phase of the shell side and the porous membrane respectively. Mass transfer equations in the la tte r were implemented according to the Dusty Gas Model th a t allowed the modelling of isobaric and non-isobaric conditions. A comparison between monolithic and membrane reactors under conditions typical of a gas turbine com bustor is carried out in order to identify com parative advantages and drawbacks of the two systems and ultim ately to give more insight on the applicability of membrane reactors in gas turbine systems.
The preparation of a catalytic ceramic membrane for an experim ental assessment of th e membrane reactor is reported in chapter 5. Various m ethods for the reduction of perm eability of ceramic membranes through deposition of Si02 are evaluated in order to achieve the uniformity of pore size distribution across th e membrane.
C hapter 6 reports about the reaction experiments carried out on a laboratory scale set-up using the membranes prepared according to the m ethods of chapter 5. A new axial sealing system was developed th a t allowed high tem peratures and non-isobaric ex perim ents. Palladium supported Si0 2 /o;-Al203 membranes were extensively tested at low and high tem peratures and a set of runs was preformed applying trans-m em brane pressure differences on the membrane. Platinum supported Si0 2 /<a-Al203 were also used mainly for comparison w ith the P d ones.
2.1 Gas turbines
In recent years, more stringent legislation on emissions has prom oted a marked shift of energy production towards novel and more efficient systems. However, at present, despite huge investments and efforts, combustion systems cannot be replaced by alternative tech nologies in the field of power generation. Thus more efficient ways of combusting fossil fuels is needed.
Increase in demand for electric power and clean emissions has led to the increase in popularity of gas turbines. Although the operating principles of gas turbines have been known since long time, only in the last 20 years these devices have found wide application in the field of power generation. In this time, they have been advanced in size and efficiency and in 1998 gas turbines took a share of 45 % of the new power plant market. W hite (2000) reports a year-on-year increase of nearly 100 % in the o u tp u t of sold gas turbines.
The success of large gas turbines is linked with the recent interest in alternative fuels such as n atural gas. According to the (probably too pessimistic) estim ate of Burch and P arkyn (1992), reserves of natural gas (which consists mainly of m ethane) are expected to last for another 50 years compared w ith 20 years for crude oil reserves. The frightening perspective of extinguishing the resources of crude oil in few decades has driven research on the investigation of new energy sources and on the optim isation of the existing. In line with an efficient management of the energy sources, gas turbines can run equally well on syngas and other low-heating value (LHV) mixtures from biomass gasification (presently considered by Forzatti and Groppi, 1999).
Despite the envisaged shortage of resources, power dem and in every area of the world is increasing. Use of nuclear and coal power is not the answer, as eight to twelve years are required to license and construct such power plants and most im portantly they have a serious im pact on safety and environment. Conversely, gas turbine power plants can be constructed in two to five years with the possibility of increm ental expansion of power capacity w ithout the large capital investments involved in th e expansion of typical nuclear and coal plants.
Rostrup-Nielsen (1994) states th a t natural gas is a clean fuel for power generation at high efficiency therefore power generation with natural gas turbines is an attractive solution to the emissions problem.
2. Literature review
1800 °C
Fuel
1300 “C 350 T
Bypass Air
Exhaust N Ox - 50 ppm
Drive Turbine Com nressor
Conpiession Combuftion Exhau5t
Fig. 2.1: Schematic of a conventional gas turbine.
et al. (1987). Figure 2.1 shows a simplified schematic of a gas turbine th a t illustrates its key features. A simple gas turbine operates on the principle of the Brayton cycle and is comprised of three main sections: a compressor, a combustor, and a drive turbine. Air is sucked from the surroundings and compressed with a multiple stage compressor up to 30 times the atmospheric pressure. Compressed air is then mixed with fuel and burned under isobaric conditions in the combustion chamber where the flame can reach tem peratures beyond 1800°C. The resulting hot gas is cooled to about 1300“C with bypass air and finally is allowed to expand through a turbine to perform work. Pressure losses have the effect of decreasing the turbine pressure ratio relative to the compressor and thus reduce the net work output from the plant (Cohen, 1987).
High efficiency gas turbines work at an optimal gas inlet tem perature (at the turbine stage) of about 1300“C however, since the flame can exceed 1500°C, formation of NOx can occur. The current goal of gas turbines producers is to reduce emissions while at the same tim e improve their efficiency.
2.1.1 Mechanisms o f ni trogen oxide prod notion.
pollutant. The regulated nitrogen oxides are grouped under th e nam e of NOx.
Although n atural gas is considered a clean fuel, as an efficient com bustion produces only carbon dioxide and water, th e NOx emissions associated w ith its use can be significant. Tem peratures of the flame generated in the combustor cham ber of a gas turbine are in excess of 1800°C and at these conditions nitrogen and oxygen present in the air react resulting in the formation of about 150-200 ppm NOx emissions from the turbine. As a result aeroplanes and power plants gas turbines are m ajor sources of nitric oxide emissions. NOx emissions can also be significant in chemical operations such as nitric acid plants.
Miller and Bowman (1989) review the research in NOx production and indicate th a t there are four principal reaction mechanisms for the form ation of NOx in gas-phase com bustion. These are:
Therm al N O x (Zeldovich, 1947): According to Miller and Bowman (1989) in the combus tion of ’clean’ fuels (th at is fuels which do not contain nitrogen components such as methane) oxidation of atmospheric nitrogen (N2) by th e ‘th erm al’ mechanism is a m ajor source of NOx emissions. At high tem perature (above 1550°C), the usually stable oxygen molecule (O2) dissociates to oxygen atom s which are very reactive. The oxygen atom (O) attacks the otherwise stable nitrogen molecule to form NOx. The three principal reactions th a t comprise the therm al NO formation mechanism are:
O t N 2 - ^ N O + N (2.1)
AT + O2 + O (2.2)
N t O H N O - h H (2.3)
P rom pt NOx: R ates of NO formation in combustion of hydrocarbon fuels can exceed those attrib u tab le to direct oxidation of molecular nitrogen by the therm al mechanism es pecially for fuel-rich conditions. Prom pt NO is formed readily at the flame front and it results from the radical CH, which is an interm ediate species generated through a complex reaction scheme starting from the fuel molecule (Delabroy et ah, 1998). Some of the hydrocarbon radicals initiating the complex mechanism are given by Miller and Bowman (1989) to be CH, CH2, C2, C2H and C. The mechanism is simplified though as follows,
C Hp N 2 ^ H C N -f N (2.4)
N t O H ^ H P N O (2.5)
2. Literature review
Fuel-bound nitrogen mechanism: A main source of NO emissions in the combustion of fossil fuels is also the nitrogen chemically bound in the fuel. This is a major source of NO emissions for coal and coal-derived fuels which typically contain 0.5-2 % nitrogen by weight. Again the mechanism involved is complex but it includes the formation of HCN. According to Ismagilov and K erzhentsev (1990), the mechanism is simplified as follows,
H C N + 0 H ^ H O C N -f H (2.6)
H O C N ^ H N C O (2.7)
-b 7 7 N C 0 ^ + C O (2 .8)
NH:, + H ^ + H2 (2.9)
N H x + Ox —^ N O -l-. . . (2.10)
N HxF N O - ^ N 2 F . . . (2.11)
N 02m ec hanism: Finally, the formation of nitrogen dioxide (NO2) is due to the unreacted NO which reacts with oxygen as follows,
N O + i û 2 N O2 (2.12)
In the com bustion of fuels such as m ethane th a t do not contain nitrogen compounds, NOx compound (prim arily NO) are formed by the therm al and prom pt mechanisms. The prom pt mechanism predominates at low tem peratures under fuel-rich conditions whereas the therm al mechanism becomes im portant at tem peratures above 1550°C.
2.1.2 Nitrogen oxide emission control
Figure 2.2 shows the current strategies for controlling NOx emissions. The various pro cesses currently in use have been reviewed by Siddiqi and Tenini (1981), Armor (1992, 1995a), Ismagilov and Kerzhentsev (1990) and Heck (1999). T he m ost used strategy is through th e post-treatm ent of combustor exhaust products, however a direct control of the combustion can also be employed. For many applications though th e emissions achievable are still too high as shown in table 2.1.
N O x c o n tro l s t r a t e g y E m is s io n s (p p m )
Uncontrolled 100-430
Wet control 25-42
Lean-premixed technology 25-42
Selective catalytic reduction 5-9
y
Fluib.ispd Bed
Combustion
Combustion i n
C a t a ly t ic Heat
G en erato rs
CONTROL
Combustion C ontrol Spficiai Methods of j
Combustion j
Co I nl.y t.LC Combustion
- Wnter/Stcam
I n j e c t io n
-Lowering pre heat a i r tem-p e r a t u r e
- Flue gas r e c i r c u l a t i o n
lÆ«eri.ng Bui‘ner
S to ic h io m e tr y
- Low excoBG a i r o p e r a t io n
- Staged combus- t.i On
- Low-KO^ b urn er
Flue Gas Treatment
/
\
Wet Methods Dry Methods
- Gas-phase o x i d a t i o n * a b s o r p t io n - Gae-phase
o x i d a t i o n > a b s o r p t i o n + r e d u c t i o n
BDTA
s y s t f
- ^ o n - s e l e c t i v e c a t a l y t i c r e d u c tio n - S e l e c t i v e non-
c a t a l y t l c r e d u c t i o n
- S e l e c t i v e c a t a l y t i c re d u c t io n
- R a d ia t io n
F f G . 4. A v a i l n h l c tcclinitjueii i o d e c r e a s e NO,, e m i s s i o n .
Fig. 2.2: Current methods of NOx control (Ismagilov and Kerzhentsev, 1990)
Figure 2.2 summarises the m ethods used in NOx control dividing them in three main categories: (i) com bustion control, th a t acts directly on th e com bustion stage lowering reaction tem peratures; (ii) flue gas treatm ent is an end-of-pipe m ethod and abates the already produced NOx and (hi) the special m ethods among which catalytic combustion is listed. In the following sections some of the methods reported in figure 2.2 will be briefly reviewed. Following this, catalytic combustion will be discussed in a greater detail, being the main topic of this work.
2.1.2 . 1 Selective Reduction o f N O x
This is one of the most popular techniques among the gas turbine producers and belongs to the post-treatm ent methods. Selective homogeneous reaction has the intrinsic lim itation of being effective only in a narrow tem perature range (850-1050°C) therefore is not anymore commercially used. Conversely selective catalytic reduction (SCR) of NOx using NH3 can be carried out a t 350°C and is, according to many authors (Armor, 1995a and Ismagilov and Kerzhentsev, 1990) the current best available technology for reducing NOx emissions (5-9 ppm) in many power plants and during the production of chemicals. SCR utilises a catalyst to facilitate reactions between NOx and NH3 in the presence of oxygen. A simple representation of the complicated sequence of reactions is as follows.
4A^0
+ ANHs
-j- O2 —> 4A(2 +QH
2O
6N O2 + S NHs — . 7N2 + I 2JT2O
(2.13)
2. Literature review 10
However this technology has several disadvantages and is usually applied to gas turbines th a t already incorporate a lean premix (or wet control) com bustion system. In order to control NOx to approxim ately 80 % of the inlet values, NH3 is injected into the flue gas prior to the catalyst. This requires a sophisticated distribution system of pipes and nozzles. The addition of ammonia to reduce NOx involves additional costs and ultim ately releases about 5-20 ppm NH3 (ammonia slip) which is a p ollutant itself. O ther issues with regard to this technology are corrosion and catalyst deactivation due to the presence of sulphur oxides in the exhaust system. In addition, this m ethod requires large capital investments since the size of the plant required is quite large w ith a volume of catalyst load of about lOOOm^ (Ismagilov and Kerzhentsev, 1990).
2.1.2.2 Lean prem ix technology
Since th e reaction mechanism which leads to the form ation of therm al NOx occurs at tem peratures greater th an 1500°C and the rate of NOx production accelerates exponen tially w ith increasing tem perature turbine m anufacturers developed processes th a t use air as a diluent to reduce combustion flame tem peratures. The new gas-turbine combus tor NOx-control strategies are focused on reducing the com bustion tem perature to below 1500°C by premixing fuel and air before they enter the com bustor. This idea goes by the nam e of lean-premixed combustion and is also known as Dry Low NOx (DLN from General Electric), Dry Low Emission process (DLN by Rolls Royce), and SoLoNOx (by Solar Turbines). Combustors equipped with lean premix technology achieve a low flame tem p eratu re by maintaining a low fuel-to-air ratio in th e m ain com bustion zone w ith a potential of reducing NOx emissions to 25-42 ppm.
The concept, according to Zink (1996), of lean premixed com bustion is to have a uniform, lean fuel-air m ixture throughout the combustion zone w ith no fuel-rich pock ets where high flame tem peratures would cause NOx formation. The problem with this technology is to flnd an optimum air premix th a t m aintains a stable flame while having a uniform lean m ixture. Achieving uniform fuel-air m ixtures over a wide range of power outputs and providing adequate tim e for CO oxidation to CO 2 and for burnout of unburnt hydrocarbons (UHC) can also be problematic. This might require a change of the original com bustor design which will allow for a large volume dow nstream of the m ain combustion zone. These technologies may result in an increase of CO and UHC concentrations to as much as 50ppm.
2.1.2.3 Injection o f water into the gas turbine com bustor (wet control)
are high due to the requirements for a very high level of w ater purity prior to injection into the gas combustor.
2.2 C a ta lytic C o m b u stio n
A lthough catalytic combustion has only recently found technological application, the dis covery in 1817 th a t platinum wires can induce combustion of flammable m ixtures “w ithout flame” was historically the first example of catalysis. Quite likely not even Sir Humphrey Davy, author of such amazing discovery, could imagine its significance and its conse quences. Nowadays, catalysis represents a vast field of chem istry and catalysts are used to prom ote any kind of reactions assuming a prim ary im portance in various technological processes.
Finally, after more th an 150 years, catalysis rejoins com bustion in the development of a new generation of combustion systems capable of m eeting ultra-low NOx emission levels. Commercial applications currently exist th a t allow NOx emission below 5 ppm. The approach of catalytic combustion is th a t of preventing emission rath er th an abating the pollutants at the exhaust.
Technological application of catalytic combustion welsfirst proposed by Pfefferle (1975)
and since then several reviews were published about it (Trimm, 1983; Pfefferle and Pfef ferle, 1987; P rasad et ah, 1984; Ismagilov and Kerzhentsev, 1990; Zwinkels et ah, 1993 and Kolaczkowski, 1995). This is a process in which a combustible compound and oxygen react on the surface of a catalyst, leading to complete oxidation of the compound. This process takes place w ithout a flame and at much lower tem peratures th a n those associ ated w ith conventional flame combustion. Catalytic com bustion is now widely used to remove pollutants from autom otive exhaust gases and there is now a growing interest in its application in power generation, particularly in gas turbine combustors.
Homogeneous gas-phase combustion can occur only w ithin given ffammability limits (e.g. for m ethane 5.3 to 15 vol % given by Griffiths and B arnard, 1995) and the heat produced during combustion can rise tem perature to above ca. 1600°C, where the direct com bination of nitrogen and oxygen to unwanted nitrogen oxides occurs. C atalytic com bustion does not have the strict composition requirement imposed by the ffammability limit and reaction is possible under a wide range of concentrations. All th e hydrocarbons can be oxidised over a suitable catalyst. Further, activation energy for the heterogeneous reaction is much lower th an th a t for the purely homogeneous. Accordingly, appreciable heterogeneous oxidation rates can be achieved for tem peratures and fuel concentrations much lower th an those required for the homogeneous reactions.
2. Literature review 12
k(ASS TR/W SFER CONTROL
g
z
o
HOMOGENE OUS-PHASE COMBUSTION IGNITED
KINETIC CONTROL
o
2
cc
TRANSITION TO MASS TRANSFER CONTROL
TEMPERATURE
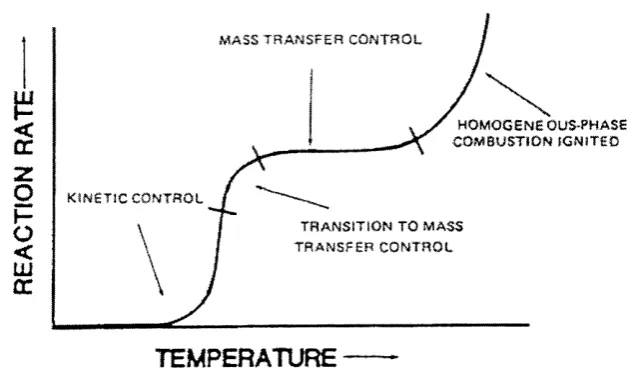
Fig. 2.3: Catalytic rate curve with gas phase reaction (Pfefferle and Pfefferle, 1987).
active sites; surface reaction; desorption of the products and counter diffusion towards the bulk gas.
At relatively low catalyst tem peratures (for example at the catalyst entrance of a gas turbine combustor) the chemical reaction is kinetically controlled as this is slower than diffusion. Thus, the reaction rate is exponentially dependent on tem perature (first steep p art of th e curve in figure 2.3). Reaction rate in this stage is determ ined by the activity of the catalyst.
W hen the gas tem perature is low, no gas phase reactions are taking place and heat is only released by the catalytic reactions at active surface. H eat is tran spo rted by conduc tion, radiation and convection to the bulk gas which consequently heats-up. For active catalysts or for higher tem perature operation, intrinsic surface reaction rate can become significantly higher th an diffusion rate, therefore the overall process is limited by reactants tran sp o rt to the surface. The reaction is hence mass transfer controlled and tem perature does not play a m ajor role anymore as diffusivities depend on tem perature as T^'^^ (e.g. Fuller et al. correlation, 1966). This is represented by th e rath er flat p art of the curve in figure 2.3. Since diffusion of fuel to the surface dom inates the overall reaction rate, increase in catalyst activity does not increase reaction rate. It is therefore impossible to distinguish between catalysts of different activity under these conditions as heterogeneous kinetics play a secondary role in determining the reaction rate.
turbine combustors. This results in difficulties in finding m aterials which can w ithstand these conditions.
PfeflFerle and Pfefïerle (1987) point out the advantages of catalytic combustion as com pared to fiame combustion:
• catalytic combustion can be carried out over a wide range of fuel concentrations in air and at low tem peratures;
• these low tem peratures result in attaining NOx emission levels substantially lower th a n those possible w ith conventional combustion;
• th e volumetric heat release rates of catalytic com bustors are high to be comparable w ith those of conventional gas turbine combustors.
Combustion is initiated by the interaction of the catalyst w ith a fuel-air m ixture th a t is oth erwise too lean to burn. Combustion can be carried out at equivalence ratios substantially
2 0 0 0
-(_) o
OJ
2 1 5 0 0
u 1000
<D
E 5 0 0
NOx formaJJon
Flame combustion
0
I n l e t
Lean premixed combustion
C a t a l y t i c combus t i on
Axi al d i s t a n c e
O u t l e t
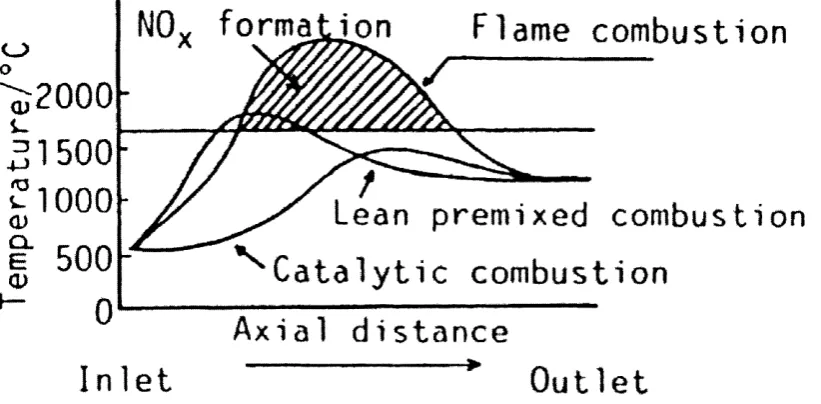
Fig. 2.4: Schematic profiles of temperature and NOx emissions in a combustor (Arai and Machida,
1991).
lower th a n the stoichiometric (lean conditions) thus limiting the maximum tem perature to less th a n the threshold of therm al NOx production, as shown in figure 2.4. Emissions using catalytic combustors have been reported to be reduced to less th a n 3 ppm (Dalla B etta et ah, 1997). Most of the reaction occurs on the catalyst surface, so gas-phase chemistry, particularly the therm al NOx pathway, is suppressed. Griffin et al. (1995) report th a t the reaction p ath on the catalyst surface differs significantly from the p ath in the gas phase and prom pt NOx formation is diminished as well.
2. Literature review 14
exponential nature of the reaction mechanism, slight changes in surface tem perature or flow velocity (convective heat transfer) can lead to extinction or overheating of the catalyst (Lee and Trimm, 1995). A nother problem with catalytic systems can be th a t gas-phase chem istry may be inhibited by the catalyst due to adsorption of reactive intermediates. The coupling of gas-phase and surface reactions through radical adsorption/desorption is still a debated issue, and in recent years an increase on publication in this fleld can be observed.
2.2.1 Current applications o f catalytic combustion
The most common example of catalytic combustion for emissions clean-up is the cat alytic converter in the exhaust systems of automobiles. According to Saint-Just and der Kinderen, (1996), catalytic combustion has already gone beyond the ’promising’ status with a num ber of other commercial applications th a t take advantage of some of its in teresting characteristics. O ther present commercial applications of catalytic combustion include:
• N atural gas furnaces th a t feature surface assisted combustion. The heat transfer from the burner to the fluid to be heated is largely by radiation rather than convec tion. These furnaces offer high efficiency as well as low NOx emission.
• Flameless catalytic burners in kitchen appliances. They are not sensitive to wind, in contrast to conventional burners from which flame stability and efficiency in an outdoor environment is a problem.
• R adiant heaters used in home appliances and burn kerosene type fuels. Radiant heaters insure flexibility (use outdoor is possible) and safety operation, especially in term s of low CO levels in the combustion effluents. They have a higher efficiency th an electric radiant heaters for household applications.
• C atalytic combustion of volatile organic compounds (VOC) in packed beds or in membrane reactors in order to couple micro-particles filtration and gas and vapour combustion.
• C atalytic combustion devices used as a convenient means of detecting flammable gases in air. The concentration of the gas of interest is measured through the heat liberated during its combustion.
application. Commercialisation of this concept greatly depends on th e development of efficient catalysts with high activities, high durability and low cost. However, it is not easy to develop such catalysts as catalytic activity of n atural gas is intrinsically lower than th a t of petroleum gas. Kolaczkowski (1995) has reviewed th e problems specifically associated with gas turbines mainly those associated w ith catalyst and system design.
2.2.2 M onolithic system s for catalytic gas turbine combustors
A fundam ental requirement of gas turbine combustors is th a t pressure drops must be minimised in order to achieve optimal expansion in th e drive turbine (see Cohen et al., 1987). For this reason, packed bed, despite their high catalytic surface-to-volume ratio, are not suitable for gas turbine application. The preferred configuration is a monolithic reactor since it combines a relatively high surface-to-volume ratio w ith low pressure drop (Pfefferle and Pfefferle, 1987)
C atalytic monoliths usually consists of three components: th e substrate, th a t acts as a support for the following two components; washcoat, th a t provides a high surface area m aterial on which to distribute the active component; and the active component, usually a precious m etal with high dispersion.
The catalyst should have high activity for the oxidation of m ethane and other hydro carbons present in natural gas in order to obtain ignition at tem peratures close to those of the compressor outlet. At the same time the catalyst is required to be stable, m aintain high surface area (low sintering), show low volatility at th e operating tem perature and resist to therm al shock.
The design criteria and operating conditions of the new generation gas turbine com bustors are summarised in table 2 .2.
D e sig n C riteria
NOx < 5 ppm
Emission targets CO < 10 ppm
UHC < 10 ppm
Pressure drop < 5 %
C atalyst durability 8000 h
O p era tin g C o n d itio n s
Inlet tem perature 300-450°C
O utlet tem perature llOO'C
Pressure 10-20 atm
Mass fiowrate 100-200 kg/m ^s
Residence tim e 10-30 ms
Tab. 2.2: Design criteria and operating conditions of gas turbine combustors (Forzatti and Groppi,
1999).
2. Literature review 16
minimisation of the tem perature rise provided by the pre-burner (responsible for most of the NOx emission of CO) and (ii) the efficient coupling of heterogeneous and homogeneous reactions to guarantee complete conversion of the hydrocarbon.
In the following sections catalytically stabilised combustors CST and hybrid combus tors will be briefly reviewed highlighting the configuration of the (so far) only commercial and successfully working application of catalytic combustion.
2.2.2.1 C a ta ly tic S tabilised C om bustion (C S T )
D ev u io p m en l o( L im iim r flo w —....
---C o c d u c tlo n In Solid
;
No gaa p h o ae c o m b u s tio n
T e m p e r a tu r e
I ^
I - F uel C o n c e n tr a tio n
•y îta d iu tlo n
V elo city P ro file ( is im ln a r Plow)
P re m iz e d F u el a n d Air in
I
Heat, Uasa. U o m e n t u m Tru rm fer /I X /
Gas p h a s e c o m b u s tio n In b o u n d a ry la y e r b e c o m e s s ig n if ic a n t
C o m b u s tio n p r o d u c ts o u t
Fig. 2.5: Monolith channel schematic for catalytic stabilised combustion (Pfefferle and Pfefferle,
1987)
CST was the first attem pt of applying catalytic combustion to gas turbine combustors and was first studied by Pfefferle et al. in 1975. In this configuration the catalyst only acts as a support of the homogeneous combustion (from which the name of supported homogenous combustion).