O R I G I N A L R E S E A R C H
Novel Respiratory Impedance-Based Phenotypes
Re
fl
ect Different Pathophysiologies in Chronic
Obstructive Pulmonary Disease Patients
This article was published in the following Dove Press journal: International Journal of Chronic Obstructive Pulmonary Disease
Yumiko Matsuo1
Emiko Ogawa1,2
Ruriko Seto-Yukimura 1
Yasushi Ryujin1,3
Daisuke Kinose1
Masafumi Yamaguchi1
Makoto Osawa1
Taishi Nagao1
Hajime Kurosawa4
Yasutaka Nakano 1
1Division of Respiratory Medicine,
Department of Internal Medicine, Shiga University of Medical Science, Shiga, Japan;2Health Administration Center,
Shiga University of Medical Science, Shiga, Japan;3Ryujin Medical Clinic, Osaka,
Japan;4Center for Environmental
Conservation and Research Safety, Department of Occupation Health, Tohoku University, Miyagi, Japan
Purpose: The forced oscillation technique (FOT) is a non-invasive method to measure respiratory impedance, the respiratory resistance (Rrs) and reactance (Xrs). The disease probability measure (DPM) is a useful computed tomography (CT) imaging variable for the assessment of gas trapping and emphysema in patients with chronic obstructive pulmon-ary disease (COPD) using pairs of inspiratory and expiratory CT images. We aimed to develop FOT-based phenotypes and determine whether the phenotypes and their imaging characteristics could facilitate the understanding of COPD pathophysiology.
Patients and methods: FOT and spirometry were examined in 164 COPD patients and 22 non-COPD smokers. COPD patients were divided into four FOT-based phenotypes (NL, normal group; RD, resistance-dominant group; XD, reactance-dominant group; and MIX, mixed group) based on the 3rd quartile values of R5 (Rrs at 5Hz) and X5 (Xrs at 5Hz) in the non-COPD group. The emphysematous lesions and the airway lesions were quantitatively assessed in CT images by low attenuation volume and the square root of the wall area of a hypothetical airway with an internal perimeter of 10 mm (√Aaw at Pi10), respectively. DPM imaging analysis was also performed in 131 COPD patients. We investigated the differences in COPD parameters between the FOT-based phenotypes.
Results:√Aaw at Pi10 were significantly higher in the RD, XD, and MIX groups than in the NL group. The XD group showed lower pulmonary function and higher dyspnea scores than the RD group. No significant changes in DPM values were observed between the RD and the NL groups. The gas-trapping area was significantly higher in the XD group than in the NL group. The MIX group showed the highest dyspnea score, most emphysematous lesions, and the lowest forced expiratory volume in 1 s % predicted value.
Conclusion: The FOT-based phenotyping may be useful to assess pathophysiological changes of COPD with CT assessments.
Keywords:oscillometry, emphysema, exhalation, quantitative evaluation, COPD
Introduction
Chronic obstructive pulmonary disease (COPD) is a chronic progressive disease with heterogeneous pathophysiology including small airways disease and parench-ymal destruction.1,2Computed tomography (CT) is useful for assessing structural abnormalities of airways and lung parenchyma depending on COPD severity.1–3
Recently, Galbán et al4established a new voxel-wise image analysis method called parametric response mapping (PRM) to quantitatively distinguish functional small airway disease with air-trapping from emphysema using digitally co-registered
Correspondence: Emiko Ogawa Health Administration Center, Shiga University of Medical Science, Seta Tsukinowa-Cho, Otsu, Shiga 520-2192, Japan
Tel/Fax +81-77-548-2212
Email [email protected]
International Journal of Chronic Obstructive Pulmonary Disease
Dove
press
open access to scientific and medical research
Open Access Full Text Article
International Journal of Chronic Obstructive Pulmonary Disease downloaded from https://www.dovepress.com/ by 118.70.13.36 on 22-Aug-2020
inspiration and expiration CT scans. PRM is reported as a useful imaging biomarker for monitoring COPD progres-sion and differentiating COPD phenotypes.5–7Additionally, the disease probability measure (DPM) is a registered voxel classification approach using inspiratory and expiratory CT scans to quantify gas trapping in functional small airways disease.8 DPM as well as PRM exhibit associations with pulmonary function measurements and scores in a COPD dyspnea scale.8 Although imaging assessment is useful, image analysis takes time and effort.
The forced oscillation technique (FOT), which is used in COPD, is a noninvasive and simple functional assess-ment method of the airways that measures the respiratory system impedance, consisting of the respiratory system resistance (Rrs) and reactance (Xrs).9,10 Rrs is a measure of the airway caliber, whereas Xrs reflects the abnormality of parenchyma and airways.9 Rrs and Xrs have been independently investigated to ascertain their relationship to other parameters of pulmonary function test and CT scans.9,11However, the relationship between FOT indices and CT imaging parameters remains controversial.11,12 Clearly, Rrs and Xrs were not just substitutes for existing COPD parameters.
We hypothesized that the combined assessment of Rrs and Xrs may help elucidate COPD pathophysiology from a new viewpoint, different from spirometry. In this study, we aimed to develop FOT phenotyping based on R5 (Rrs at 5 Hz) and X5 (Xrs at 5 Hz) for COPD patients and determine whether the phenotypes and their imaging characteristics could facilitate the understanding of COPD pathophysiology, as FOT-based phenotyping may emphasize individually different pathophysiological heterogeneity.
Materials and Methods
Subjects and Study Design
A total of 164 COPD patients and 22 non-COPD smo-kers who visited the respiratory medicine outpatient clinic of the Shiga University of Medical Science
(SUMS) Hospital between August 2013 and
November 2016 were enrolled in the SUMS COPD cohort. The non-COPD smokers in this study visited our respiratory medicine outpatient clinic with symp-toms such as cough or were referred from general prac-titioners in order to rule out the presence of COPD due to their history of smoking. The specialists diagnosed the non-COPD smokers using a post-bronchodilator
ratio of forced expiratory volume in 1 s (FEV1)/forced
vital capacity (FVC) ≥ 0.70 according to the GOLD recommendations.13 COPD was diagnosed using a post-bronchodilator ratio of FEV1/FVC < 0.70 according to
the GOLD recommendations.13,14 The eligibility criteria were 1) smoking history of more than 10 pack-years or long-term biomass exposure, 2) no COPD exacerbation in the previous 4 weeks, and 3) apart from asthma no uncontrolled comorbidities, such as severe heart failure, malignant diseases, or other chronic lung diseases. Treatment difference among the study population was based on clinical judgment.
The scores in the COPD assessment test (CAT)15and the modified Medical Research Council (mMRC) dyspnea scale16were recorded for all subjects. Pulmonary function tests, FOT, and paired inspiratory and expiratory chest CT scans were performed in each participant on the same day. This study was approved by the Ethics Committee of SUMS (registration number: 27-11) and conformed to the tenets of the Declaration of Helsinki, and all patients provided written informed consent prior to their participation.
Pulmonary Function Tests
Spirometry was performed after inhalation of 20 µg of pro-caterol using a FUDAC77® spirometer (Fukuda Denshi, Tokyo, Japan) according to the American Thoracic Society/ European Respiratory Society guidelines.17Carbon monox-ide diffusing capacity was measured by the single-breath washout technique. The predicted values for the spirometry were calculated in accordance with the guidelines of the Japanese Respiratory Society.18
Forced Oscillation Technique
FOT indices were measured after inhalation of 20 µg of procaterol using a MostGraph-01® (Chest M.I., Inc., Tokyo, Japan) at baseline and at follow-up after 2 years.19 Briefly, impulse wave signals, which contain multi-frequency spectra (4 Hz to 36 Hz) generated by loudspeakers at intervals of 0.25 seconds, were applied to the subject’s respiratory system via a mouthpiece. The mouth pressure and
flow signals were recorded during the patient’s tidal breath-ing at rest. Patients’cheeks were supported during measure-ment of respiratory impedance. The FOT indices at each oscillatory frequency (4–35 Hz), such as Rrs and Xrs at 5 or 20 Hz (R5, R20, and X5), the resonant frequency (Fres), and the low-frequency reactance (ALX), were calculated automatically using fast Fourier transformation methods.
International Journal of Chronic Obstructive Pulmonary Disease downloaded from https://www.dovepress.com/ by 118.70.13.36 on 22-Aug-2020
Each oscillatory index was expressed as the mean value of
five entire respiratory cycles.
Novel FOT-Based Phenotypes
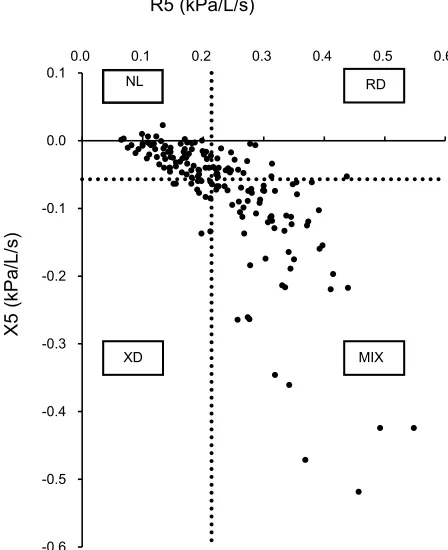
The 164 COPD patients were divided into four phenotypes (NL, normal group; RD, resistance-dominant group; XD, reactance-dominant group; and MIX, mixed group) based on the 3rd quartile values of R5 and X5 in the non-COPD group. With an R5 and X5 cut-off value of 0.214 and
−0.057 kPa/L/s, respectively, the numbers of patients in the NL, RD, XD, and MIX groups were 69, 22, 12, and 61, respectively (Figure 1).
Inspiratory and Expiratory Chest CT
Volumetric non-contrast chest CT was performed in the supine position using a 320-detector row CT scanner, the Aquilion ONE® (Canon Medical Systems Corporation, Tochigi, Japan), with either full inspiration or full expira-tion after inhalaexpira-tion of 20 µg of procaterol. CT images
were reconstructed with 1.0-mm slice thickness and 0.5-mm intervals using the FC03 algorithm.
The percentage of low attenuation volume (LAV%), one of the characteristic parameters of emphysematous lesions, were defined as voxels with CT attenuation less than−950 Hounsfield units. LAV% and the square root of the wall area of a hypothetical airway with an internal perimeter of 10 mm (√Aaw at Pi10),3an index reflecting airway lesions, were quantitatively measured using the Apollo® software (VIDA, Coralville, IA, USA) as pre-viously described.2,20
DPM
DPM is a quantitative voxel analysis based on the registration of paired inspiration and expiration CT scans as previously reported by Kirby et al.8 Briefly, DPM classifies each voxel as normal (DPMNormal),
emphysematous (DPMEmph), or gas trapping, referred
to as functional small airways disease (DPMGasTrap) by
a combination of the probability of gas trapping and the probability of emphysema calculated by inspira-tory-to-expiratory intensity differences. DPM analyses were performed by VIDA as previously described.8 Representative colored DPM map images of a non-COPD smoker and a non-COPD patient are shown in
Supplementary Figure 1.
Statistical Analysis
Statistical analyses were performed using the JMP soft-ware ver.11 (SAS Institute, Cary, NC, USA). The differ-ences between the COPD and non-COPD groups and comparisons between FOT-based phenotypes were evalu-ated using the Wilcoxon rank-sum test. A value of p < 0.05 was considered statistically significant.
Results
Characteristics of COPD Patients and
Non-COPD Smokers
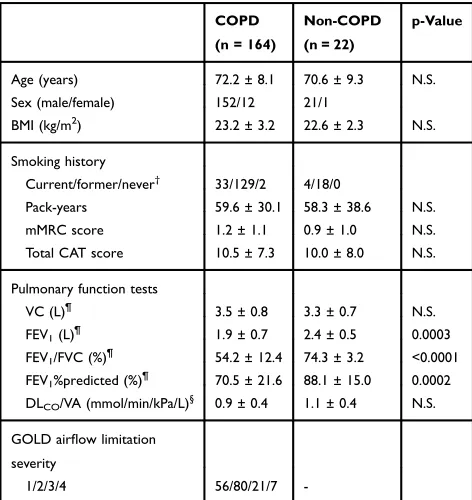
Table 1 shows the baseline characteristics of the study population. Overall, most participants were men, and most COPD patients had mild or moderate airflow limita-tion. The FOT indices are presented in Table 2. R5 and R20 were significantly higher in COPD patients than in non-COPD smokers. Although no significant differences in Xrs indices were detected between subjects with and without COPD, X5 tended to be lower while Fres and ALX tended to be higher in COPD patients.
R5 (kPa/L/s)
-0.6 -0.5 -0.4 -0.3 -0.2 -0.1 0.0 0.1
0.0 0.1 0.2 0.3 0.4 0.5 0.6
X5
)s/
L/
a
Pk
(
RD
MIX NL
XD
Figure 1Definition of the four novel FOT-based phenotypes in COPD patients. The vertical and horizontal dashed lines show the 3rd quartile value for R5 = 0.214 and X5 =−0.057, respectively, in the non-COPD smokers. Using these cut-off values, 164 COPD patients were divided into four phenotypes.
Abbreviations:NL, normal group; RD, resistance-dominant group; XD, reactance-dominant group; MIX, mixed group; FOT, forced oscillation technique; R5, respira-tory system resistance at 5 Hz; X5, respirarespira-tory system reactance at 5 Hz.
International Journal of Chronic Obstructive Pulmonary Disease downloaded from https://www.dovepress.com/ by 118.70.13.36 on 22-Aug-2020
Differences Among FOT-Based
Phenotypes
Table 3 shows the comparisons among these FOT-based phenotypes. The XD and MIX groups were older and showed significantly higher scores in the mMRC dyspnea scale than the NL and RD groups. The FEV1% predicted
values were significantly lower in the XD and MIX than in the NL and RD groups. The minimum of the LAV% values was determined in the RD group and was significantly different from that in the MIX group, which presented the highest value of all groups (p < 0.05; Table 3). Furthermore, √Aaw at Pi10 was significantly higher in the RD, XD, and MIX groups than in the NL group.
DPM
The distribution of DPM parameters in the categories based on the defined FOT phenotypes is presented inFigure 2. No significant differences in DPM parameters were noted between the RD and NL groups. In the XD group, the per-centage of DPMEmphdid not significantly differ from that in
the NL group, but the DPMGasTrap value was significantly
increased. The values for DPMNormaland DPMGasTrapdiffered
significantly between the MIX and the NL groups, and DPMEmphwas significantly higher than that in the RD group.
Comparison of FOT-Based Phenotypes
with GOLD-Based Severity of Air
fl
ow
Limitation
Figure 3shows the distribution of FOT-based phenotypes in relation to the severity of airflow limitation according to the GOLD classification. Although subjects in the RD, XD, and MIX groups were present in the GOLD 1 category, it was mostly composed of NL subjects. The percentages of study participants from the XD and MIX groups increased with increased severity of airflow limitation, and the GOLD 4 category consisted only of subjects from the MIX group. The RD group was mainly present in categories GOLD 1 and 2.
Discussion
We proposed a novel FOT-based phenotyping for combined assessment of Rrs and Xrs. The FOT-based phenotyping may emphasize individually on the different pathophysiological backgrounds with the same level of pulmonary function severity. The FOT-based phenotyping may be useful to assess pathophysiological changes of airway lesions and emphy-sema comprehensively.
In COPD, Rrs tends to increase, while Xrs tends to decrease with an increased degree of airflow obstruction.19 Di Mango et al reported that airway obstruction in the initial phase of COPD can be represented mainly by the resistive parameters, while the reactive parameters gain importance in more advanced stages.21 However, in this study, we revealed a different phenotype which X5 was predominantly Table 1Characteristics of the Study Subjects
COPD
(n = 164)
Non-COPD
(n = 22)
p-Value
Age (years) 72.2 ± 8.1 70.6 ± 9.3 N.S.
Sex (male/female) 152/12 21/1
BMI (kg/m2) 23.2 ± 3.2 22.6 ± 2.3 N.S.
Smoking history
Current/former/never† 33/129/2 4/18/0
Pack-years 59.6 ± 30.1 58.3 ± 38.6 N.S.
mMRC score 1.2 ± 1.1 0.9 ± 1.0 N.S.
Total CAT score 10.5 ± 7.3 10.0 ± 8.0 N.S.
Pulmonary function tests
VC (L)¶ 3.5 ± 0.8 3.3 ± 0.7 N.S.
FEV1(L)¶ 1.9 ± 0.7 2.4 ± 0.5 0.0003
FEV1/FVC (%)¶ 54.2 ± 12.4 74.3 ± 3.2 <0.0001 FEV1%predicted (%)¶ 70.5 ± 21.6 88.1 ± 15.0 0.0002 DLCO/VA (mmol/min/kPa/L)§ 0.9 ± 0.4 1.1 ± 0.4 N.S.
GOLD airflow limitation severity
1/2/3/4 56/80/21/7
-Notes:Data are presented as the mean ± standard deviation unless otherwise stated and were analyzed by Wilcoxon’s rank-sum test.†inhalation biomass;¶
n = 163;§ n = 158.
Abbreviations: BMI, body mass index; CAT, COPD assessment test; COPD, chronic obstructive lung disease; DLCO/VA, carbon monoxide diffusing capacity of the lung for carbon monoxide and alveolar volume ratio; FEV1, forced expiratory volume in 1 s; FVC, forced vital capacity; GOLD, Global Initiative for Chronic Obstructive Lung Disease; mMRC, modified Medical Research Council dyspnea scale; N.S., not significant (p > 0.05); VC, vital capacity.
Table 2 Comparison of FOT Indices Between COPD Patients and Non-COPD Smokers
COPD (n = 164)
Non-COPD (n = 22)
p-Value
R5 (kPa/L/s) 0.23 ± 0.09 0.18 ± 0.05 <0.05 R20 (kPa/L/s) 0.18 ± 0.06 0.15 ± 0.04 <0.01 R5-R20 (kPa/L/s) 0.05 ± 0.04 0.03 ± 0.02 N.S. X5 (kPa/L/s) −0.08 ± 0.09 −0.05 ± 0.05 N.S. Fres (Hz) 11.37 ± 5.57 9.01 ± 3.32 N.S. ALX (kPa/L/
s·Hz)
0.54 ± 0.90 0.23 ± 0.41 N.S.
Notes:Data are presented as the mean ± standard deviation and were analyzed by Wilcoxon’s rank-sum test. Each oscillatory index was expressed as the mean value offive entire respiratory cycles.
Abbreviations:ALX, low-frequency reactance area; Fres, resonant frequency; N. S., not significant (p > 0.05); R5, Rrs at 5 Hz; R20, Rrs at 20 Hz; R5-R20, difference from R5 to R20; X5, Xrs at 5 Hz.
International Journal of Chronic Obstructive Pulmonary Disease downloaded from https://www.dovepress.com/ by 118.70.13.36 on 22-Aug-2020
decreased. The XD group shows lower pulmonary function and higher dyspnea scores than the RD group. In addition, the increase in the gas-trapping area concomitant with the decrease in normal area was observed in the XD group by imaging analysis. The XD group may be the previous stage of CT-based emphysema type.22–24On the contrary, the RD group corresponds to CT-based airway dominant type by considering the values of √Aaw at Pi10 and LAV%. The
features of the MIX group are in line with our previous observation that a combined airway and parenchymal phe-notype in the assessment of CT images is associated with more severe airflow limitation and dyspnea.20 The FOT-based phenotyping is correlated with the assessments of CT parameters. Thus, the pathophysiological heterogeneity of COPD could be reflected to different FOT-based phenotypes.
)
%(
M
P
D
FOT-based phenotypes 0
10 20 30 40 50 60 70 80
NL RD XD MIX
DPMNormal
DPMGasTrap
DPMEmph
* *
*
**
**
Figure 2 Distribution of the DPM parameters according to the FOT -based phenotypes. Bars show the data presented as the mean ± standard deviation of
DPMNormal(white), DPMGasTrap(shaded), and DPMEmph(black). The numbers of
subjects are in 52, 21, 8, and 46 in the NL, RD, XD, and MIX groups, respectively. The Wilcoxon rank-sum test was used to compare DPM parameters among groups. *p < 0.05 compared with NL; **p < 0.05 compared with RD.
Abbreviations:DPM, disease probability measure; DPMGasTrap, gas trapping lesion recognized by DPM; DPMEmph, emphysematous lesion recognized by DPM; DPMNormal, normal lesion recognized by DPM; FOT, forced oscillation technique; MIX, mixed group; NL, normal group; RD, resistance-dominant group; XD, reactance-dominant group.
Table 3Characteristics, Pulmonary Functions, and CT Imaging Biomarkers Among FOT-Based Phenotypes
NL (n = 69) RD (n = 22) XD (n = 12) MIX (n = 61)
Age 69.8 ± 8.1 69.7 ± 8.8 78.3 ± 5.4 *,** 74.7 ± 6.8*,**
Sex (male/female) 67/2 20/2 10/2 55/6
BMI (kg/m2) 22.5 ± 2.9 24.0 ± 3.2 23.8 ± 3.7 23.6 ± 3.4* pack-years† 56.7 ± 26.8 49.3 ± 23.7 52.6 ± 29.8 64.9 ± 37.1 mMRC score¶ 0.9 ± 1.0 0.7 ± 0.6 1.6 ± 1.0*,** 1.6 ± 1.1*,** Total CAT score§ 8.4 ± 6.5 10.1 ± 7.4 13.5 ± 8.6* 12.4 ± 7.4*
Pulmonary function tests NL (n = 68) RD (n = 22) XD (n = 12) MIX (n = 61)
FEV1(L) 2.3 ± 0.5 2.0 ± 0.6* 1.5 ± 0.5* ,
** 1.4 ± 0.5*,** FEV1/FVC (%) 60.3 ± 8.1 57.5 ± 9.5 49.8 ± 13.6* 46.7 ± 13.2*
,
** FEV1%predicted (%) 82.0 ± 16.6 76.0 ± 16.1 60.1 ± 20.3*
,
** 57.0 ± 20.5*,** VC (L) 3.9 ± 0.7 3.7 ± 0.7 3.1 ± 0.7*,** 3.1 ± 0.7*,** DLCO/VA (mmol/min/kPa/L)‡ 0.9 ± 0.4 1.0 ± 0.3 0.9 ± 0.5 0.8 ± 0.4**
CT imaging biomarkers NL (n = 55) RD (n = 19) XD (n = 9) MIX (n = 49)
LAV% (%) 11.3 ± 9.9 7.9 ± 7.9 14.8 ± 14.5 15.7 ± 12.6**
√Aaw at Pi10 (mm) 3.69 ± 0.06 3.74 ± 0.06* 3.76 ± 0.08* 3.77 ± 0.06*,**
Notes:Data are presented as the mean ± standard deviation and were analyzed by Wilcoxon’s rank-sum test.†n = 67 (NL), 22 (RD), 12 (XD), and 61 (MIX);¶
n = 69 (NL), 21 (RD), 12 (XD), and 60 (MIX);§
n = 68 (NL), 21 (RD), 12 (XD), and 61 (MIX);‡n = 67 (NL), 22 (RD), 12 (XD), and 57 (MIX). *P < 0.05 vs NL; **P < 0.05 vs RD.
Abbreviations:√Aaw at Pi10, square root of the wall area of a hypothetical airway with an internal perimeter of 10 mm; BMI, body mass index; CAT, COPD assessment test; CT, computed tomography; DLCO/VA, carbon monoxide diffusing capacity of the lung for carbon monoxide and alveolar volume ratio; FEV1, forced expiratory volume in 1 s; FOT, forced oscillation technique; FVC, forced vital capacity; LAV%, percentage of low attenuation volume; MIX, mixed group; mMRC, modified Medical Research Council dyspnea scale; NL, normal group; RD, resistance-dominant group; VC, vital capacity; XD, reactance-dominant group.
Figure 3 Definition of the four novel FOT-based phenotypes by the GOLD classification of airflow limitation severity.
Abbreviations:FOT, forced oscillation technique; GOLD, Global Initiative for Chronic Obstructive Lung Disease; MIX, mixed group; NL, normal group; RD, resistance-dominant group; XD, reactance-dominant group.
International Journal of Chronic Obstructive Pulmonary Disease downloaded from https://www.dovepress.com/ by 118.70.13.36 on 22-Aug-2020
Recently, Karayama et al reported that emphysematous lesions in chest CT do not associate with Rrs indices but are significantly correlated with some Xrs indices.12 Conversely, Wada et al demonstrated a lack of significant correlation of both Rrs and Xrs with emphysematous lesions, but both were correlated with √Aaw at Pi10 as an indicator of airway wall thickness in COPD.11 Both opinions do not contradict our FOT-based phenotyping. R5 may purely reflect airway lesions and X5 may reflect the both gas-trapping area and airway lesions, both of which eventually shift to emphysema. Destruction of the lung parenchyma leads to the loss of bronchiolar-alveolae attachments. As a result, gas-trapping, emphysematous changes and airway lesions are occurred in COPD patients. FOT-based phenotyping could both assess Rrs and Xrs and reflect pathophysiological heterogeneity.
Spirometry is also a useful functional assessment to reveal airway obstruction such as FEV1/FVC and FEV1%
predicted. However, it is difficult to conclusively identify the cause of obstructive functional changes. As shown in
Figure 3, severe and very severe GOLD categories com-prise mainly the MIX group. However, all FOT-based phenotypes are presented in mild and moderate GOLD categories. With combined assessment of Rrs and Xrs, the FOT-based phenotyping could represent the pathophy-siological heterogeneity in COPD from a new perspective. Notably, the FOT-based phenotyping is a simple and useful assessment which could reflect the pathophysiology of COPD caused by both emphysematous lesions and airway lesions.
This study has several limitations. First, this was a single-center and retrospective study. Second, the non-COPD smokers in this study were ruled out non-COPD by definitions but they visited our outpatient clinic because they presented symptoms such as cough. For the FOT-based phenotyping, this may have caused stricter cut-off values in our population of non-COPD smokers com-pared to a healthy control population. Hence, we used the 3rd quartile instead of the mean +2 SD of the R5 and X5 values. Further, the number of the non-COPD patients was relatively small. Finally, two different FOT devices, namely, MasterScreen-IOS® (CareFusion Germany 234 GmbH, Germany) and the MostGraph® (Chest M.I., Inc., Tokyo, Japan), are widely used, and they do not always generate identical respiratory impe-dance values.25 Further studies are needed to elucidate the influence of functional changes on quantitative ima-ging parameters.
Conclusion
The FOT-based phenotyping may be safe and useful to assess pathophysiological changes of COPD with CT assessments.
Ethics Approval and Informed
Consent
This study was approved by the Ethics Committee of SUMS (registration number: 27-11) and conformed to the tenets of the Declaration of Helsinki, and all patients provided written informed consent prior to their participation.
Acknowledgments
The authors would like to thank the secretary, Ms. Yoko Naito, and the technicians, Ms. Mayuko Ono and Mr. Hayato Okumura, for their continued help throughout the study. This paper was presented at the American Thoracic Society InternationalConference 2019 as a conference talk with interim findings. The abstract was published in “Conference Abstracts”inAmerican Journal of Respiratory and Critical Care Medicine2019, Volume 199.
Author Contributions
Yumiko Matsuo contributed to the analysis and the inter-pretation of data and wrote the initial draft of the manu-script. Emiko Ogawa designed the study, contributed to the interpretation of data, and assisted in the preparation of the manuscript. All authors made substantial contributions to conception and design, acquisition of data, or analysis and interpretation of data; took part in drafting the article or revising it critically for important intellectual content; gave final approval of the version to be published; and agree to be accountable for all aspects of the work.
Disclosure
HK reports personal fees from Chest M.I. Inc., during the conduct of the study. In addition, HK has a patent for a 3D graphic technique in forced oscillation technique apparatus of MostGraph and a patent for a noise reduction technique in forced oscillation technique apparatus of MostGraph. The authors report no other conflicts of interest in this work.
References
1. Nakano Y, Muro S, Sakai H, et al. Computed tomographic measure-ments of airway dimensions and emphysema in smokers. Correlation with lung function. Am J Respir Crit Care Med. 2000;162(3 Pt 1):1102–1108. doi:10.1164/ajrccm.162.3.9907120
International Journal of Chronic Obstructive Pulmonary Disease downloaded from https://www.dovepress.com/ by 118.70.13.36 on 22-Aug-2020
2. Tho NV, Ryujin Y, Ogawa E, et al. Relative contributions of emphy-sema and airway remodelling to airflow limitation in COPD: consis-tent results from two cohorts. Respirology. 2015;20(4):594–601. doi:10.1111/resp.12505
3. Nakano Y, Wong JC, de Jong PA, et al. The prediction of small airway dimensions using computed tomography.Am J Respir Crit Care Med.2005;171:142–146. doi:10.1164/rccm.200407-874OC 4. Galban CJ, Han MK, Boes JL, et al. Computed tomography-based
biomarker provides unique signature for diagnosis of COPD pheno-types and disease progression. Nat Med. 2012;18(11):1711–1715. doi:10.1038/nm.2971
5. Bhatt SP, Soler X, Wang X, et al. Association between functional small airway disease and FEV1 decline in chronic obstructive pul-monary disease.Am J Respir Crit Care Med.2016;194(2):178–184. doi:10.1164/rccm.201511-2219OC
6. Boes JL, Hoff BA, Bule M, et al. Parametric response mapping monitors temporal changes on lung CT scans in the subpopulations and intermediate outcome measures in COPD Study (SPIROMICS). Acad Radiol. 2015;22(2):186–194. doi:10.1016/j. acra.2014.08.015
7. Pompe E, Galban CJ, Ross BD, et al. Parametric response mapping on chest computed tomography associates with clinical and func-tional parameters in chronic obstructive pulmonary disease. Respir Med.2017;123:48–55. doi:10.1016/j.rmed.2016.11.021
8. Kirby M, Yin Y, Tschirren J, et al. A novel method of estimating small airway disease using inspiratory-to-expiratory computed tomography.
Respiration.2017;94(4):336–345. doi:10.1159/000478865
9. Shirai T, Kurosawa H. Clinical application of the forced oscillation technique.Intern Med.2016;55:559–566. doi:10.2169/internalmedicine. 55.5876
10. Oostveen E, MacLeod D, Lorino H, et al. The forced oscillation technique in clinical practice: methodology, recommendations and future developments. Eur Respir J. 2003;22(6):1026–1041. doi:10.1183/09031936.03.00089403
11. Wada Y, Kitaguchi Y, Yasuo M, et al. Diversity of respiratory impedance based on quantitative computed tomography in patients with COPD.
Int J Chron Obstruct Pulmon Dis.2018;13:1841–1849. doi:10.2147/COPD 12. Karayama M, Inui N, Mori K, et al. Respiratory impedance is correlated with morphological changes in the lungs on three-dimensional CT in patients with COPD.Sci Rep.2017;7:41709. 13. Global strategy for the diagnosis, management and prevention of Chronic Obstructive Lung Disease 2019 report. [homepage on the Internet].
Global Initiative for Chronic Obstructive Lung Disease.2019. Available from:https://goldcopd.org/wp-content/uploads/2018/11/GOLD-2019-v1. 7-FINAL-14Nov2018-WMS.pdf. Accessed July 30, 2019.
14. Mirza S, Clay RD, Koslow MA, Scanlon PD. COPD guidelines: a review of the 2018 GOLD report. Mayo Clin Proc. 2018;93 (10):1488–1502. doi:10.1016/j.mayocp.2018.05.026
15. Jones PW, Harding G, Berry P, Wiklund I, Chen WH, Kline Leidy N. Development andfirst validation of the COPD Assessment Test.Eur Respir J.2009;34(3):648–654. doi:10.1183/09031936.00102509 16. Fletcher CM. Standardised questionnaire on respiratory symptoms:
a statement prepared and approved by the MRC Committee on the Aetiology of Chronic Bronchitis (MRC breathlessness score).BMJ Open.1960;2:1665.
17. Miller MR, Hankinson J, Brusasco V, et al. Standardisation of spirometry. Eur Respir J. 2005;26(2):319–338. doi:10.1183/0903 1936.05.00034805
18. Sasaki H, Nakamura M, Kida K, et al. Reference values for spiro-gram and blood gas analysis in Japanese adults.J Japan Respir Soc.
2001;39:S1–S17.
19. Ohishi J, Kurosawa H, Ogawa H, Irokawa T, Hida W, Kohzuki M. Application of impulse oscillometry for within-breath analysis in patients with chronic obstructive pulmonary disease: pilot study.
BMJ Open.2011;1(2):e000184. doi:10.1136/bmjopen-2011-000184 20. Van Tho N, Ogawa E, Trang Le TH, et al. A mixed phenotype of airway
wall thickening and emphysema is associated with dyspnea and hospi-talization for chronic obstructive pulmonary disease.Ann Am Thorac Soc.2015;12(7):988–996. doi:10.1513/AnnalsATS.201411-501OC 21. Di Mango AM, Lopes AJ, Jansen JM, Melo PL. Changes in
respira-tory mechanics with increasing degrees of airway obstruction in COPD: detection by forced oscillation technique. Respir Med.
2006;100(3):399–410. doi:10.1016/j.rmed.2005.07.005
22. Ogawa E, Nakano Y, Ohara T, et al. Body mass index in male patients with COPD: correlation with low attenuation areas on CT.
Thorax.2009;64:20–25. doi:10.1136/thx.2008.097543
23. Higami Y, Ogawa E, Ryujin Y, et al. Increased epicardial adipose tissue is associated with the airway dominant phenotype of chronic obstructive pulmonary disease. PLoS One. 2016;11(2):e0148794. doi:10.1371/journal.pone.0148794
24. Van Tho N, Wada H, Ogawa E, Nakano Y. Recentfindings in chronic obstructive pulmonary disease by using quantitative computed tomography. Respir Investig. 2012;50(3):78–87. doi:10.1016/j.resinv. 2012.08.002
25. Tanimura K, Hirai T, Sato S, et al. Comparison of two devices for respiratory impedance measurement using a forced oscillation tech-nique: basic study using phantom models.J Physiol Sci.2014;64 (5):377–382. doi:10.1007/s12576-014-0329-4
International Journal of Chronic Obstructive Pulmonary Disease
Dove
press
Publish your work in this journal
The International Journal of COPD is an international, peer-reviewed journal of therapeutics and pharmacology focusing on concise rapid reporting of clinical studies and reviews in COPD. Special focus is given to the pathophysiological processes underlying the disease, inter-vention programs, patient focused education, and self management
protocols. This journal is indexed on PubMed Central, MedLine and CAS. The manuscript management system is completely online and includes a very quick and fair peer-review system, which is all easy to use. Visit http://www.dovepress.com/testimonials.php to read real quotes from published authors.
Submit your manuscript here:https://www.dovepress.com/international-journal-of-chronic-obstructive-pulmonary-disease-journal
International Journal of Chronic Obstructive Pulmonary Disease downloaded from https://www.dovepress.com/ by 118.70.13.36 on 22-Aug-2020