A self-consistent physical model of the bubbles in a
gas solid two-phase flow
H.M. Dong1,†, J.F. He2, C.L. Duan2and Y.M. Zhao2,∗
1 School of Physics, China University of Mining and Technology, Xuzhou 221116, P. R. China
2 Key Laboratory of Coal Processing and Efficient Utilization, Ministry of Education, China University of
Mining and Technology, Xuzhou 221116, P. R. China
* Correspondence: [email protected], [email protected]; Tel:+86-051683591580
Abstract:In this work, we develop a self-consistent physical model of bubbles in a gas solid two-phase
1
flow. Using the Peng-Robonson state equation and a detailed specific heat ratio equation of bubbles,
2
we obtain the kinetic equations of the bubbles on the basis of the Ergun equation, thermodynamic
3
equations, and kinetic equations. It is found that the specific heat ratio of bubbles in such systems
4
strongly depends on bubble pressures and temperatures, which play an important role in the
5
characteristics of the bubbles. The theoretical studies show that with increasing height in the systems,
6
the gas flow rate shows a downward trend. Moreover, the larger particles in the gas solid flows are,
7
the greater the gas velocity is. The bubble sizes increase with the increasing heights of the gas solid
8
systems, and then decrease. The bubble velocity is affected by the gas velocity and the bubble size,
9
which gradually increase and eventually quasi-stabilize. This shows that gas and solid phases in a
10
gas solid two-phase flow interact with each other and a self-consistent system comes into being. The
11
theoretical results have exhibited important value as a guide for understanding the properties and
12
effects of bubbles in gas solid two-phase flows.
13
Keywords:self-consistent physical model; bubbles; gas solid two-phase flow
14
1. Introduction 15
Gas solid two-phase flow is a complex flow system composed of gas and solid particles, and
16
represents an important branch of fluid dynamics. Gas solid two-phase flows exist widely in nature
17
and industrial productions. In this context, gas solid two-phase fluidization separation, for example,
18
has been extensively researched and developed, with a wide range of applications and high selection
19
efficiency. It is an efficient separation method that has been gradually applied to industrial production
20
[1,2]. With gas article fluidization separation, the system is filled with uniform air flows in the fine
21
particulate matter media bed, which creates particle medium fluidization and forms the gas solid
22
suspended matter with certain density and fluid properties. The theoretical analysis of the two-phase
23
flow is much more difficult than for single-phase flow because the general differential equations
24
describing the two-phase flow have not yet been established. Generally, a simplified two-phase
25
theoretical model can be applied in such systems. One of the models considers that the system is a
26
continuous medium which is a mixture of two phases, where the concepts and methods of single-phase
27
flow are still suitable for two-phase flow. The other is called the separated model, which considers
28
that the concept and method of the single-phase flow can be respectively used in each phase of the
29
two-phase system, while the interaction between the two phases is included [3,4]. The second type of
30
model has been widely associated with physical applications [5].
31
In the gas solid two-phase flows, the mixture of the gas and the particles is not uniform and
32
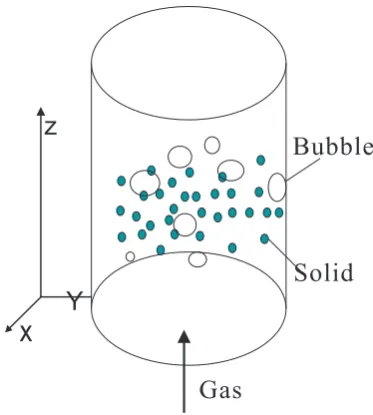
time-dependent, with the two phases existing in the gas solid two-phase flows (see Fig.1). One is a
33
continuous phase, composed of gas and particles, and is called the dense phase or emulsion phase; the
34
other is a discontinuous phase appearing in the bubble state, and is called the bubble phase. When
35
the quantity of gas flowing in the gas solid system is greater than the air flow required for the critical
36
fluidized state, the excess gas can be in the form of bubbles. Bubble dynamic behavior is responsible
37
for the most basic characteristics and phenomena in the gas solid two-phase flow system. This is
38
significant for the understanding and study of the properties of gas solid two-phase flow systems [4].
39
The study of bubbles in gas solid two-phase flow forms an important part of the field of fluidization
40
state [6]. The pressure drop, height, swelling degree, uniform mixing of the gas-solid two-phase flow,
41
and stratified separation of particles in the gas-solid two-phase system strongly depend on the bubbles.
42
The bubble size and rising velocity are important factors which affect the fluidization stability, the
43
dynamics of particles, and the separation densities of fluidized beds [7]. The bubble phase and the
44
dense phase transmit the heat and mass to each other, and then the gas-solid two-phase flows are
45
not uniform. The growth of bubbles in the gas-solid two-phase flow can seriously affect the uniform
46
stability of fluidization, affect the distribution of solid phase particles, and affect the state of the whole
47
two-phase flow. As a result, research into bubble properties in the gas-solid two-phase flow system
48
represent some of the most important and basic studies in the field [8]. Van Lare et al. developed
49
a statistical theory to study the properties of bubbles in gas-solid systems using capacitance probe
50
measurement experiments, and obtained consistent results between the experiments and theories [9].
51
Ichiki et al. studied the bubble phase and slugging phase in a fluidized bed by numerical simulations.
52
It was found that the convective motion reveals a stronger effect on the bubble phase than on the
53
slugging phase [10]. Farshi et al. calculated the size of bubbles in the gas-solid fluidized bed, and
54
found that the Mori-Wen-Rowe equation is a better choice for the study of the bubble size, as compared
55
with the other theories [11]. Through the optical experimental study, Valverde et al. found that bubbles
56
begin to be produced after fluidization of the particles, and the interactions between the hydro-kinetic
57
force and the particles can suppress the generation of bubbles for sufficiently large particles in the
58
two-phase flow [12]. Glasser et al. studied the relationship between the bubbles and the clusters
59
in the gas-solid two-phase flow and found that they are similar phenomenons in the s systems [4].
60
Muller measured the bubble phenomenon in a two-phase system using magnetic resonance imaging
61
experiment in real time for the first time, and studied the bubble size, velocity, and so on in detail
62
[13]. The nonlinear characteristics of the gas-solid two-phase flow and the relationship with bubbles
63
were studied by Homsy et al. [14]. Zahra researched the nonlinear dynamic characteristics of gas-solid
64
system using the two phase theory[15]. Komatsu and Hayakawa investigated the nonlinear dynamic
65
characteristics of the fluidized states. Their results show that solitons, like waves, exist in the system
66
and play an important role in the system. This indicates that the nonlinear characteristic has an
67
important role and influence on the systems[16]. At the South Korean Energy Research Institute, the
68
bubble properties of the gas-solid fluidized bed system were studied by Choi et al. using electronic
69
resistivity probe experiments, and a change in bubble size with height was obtained [17]. Al-Zahrani
70
and Daous established a simplified model to predict the average velocity of bubbles rising [18].
71
The bubble phenomenon represents one of the most basic physical phenomena of the gas-solid
72
two-phase flow system, and relevant scholars worldwide have paid much attention to the research
73
of bubbles in the gas-solid two-phase flow. It is noted that at present, studies mainly focus on the
74
improvement and research of productive processes in the actual systems. However, basic theoretical
75
research is relative lacking [19]. The high-speed dynamic systems have been widely used to analyze the
76
bubble behaviors of the gas-solid system in experiments. With limited experimental approaches, we
77
can observe and analyze the behavior of the system at the boundary surface but we cannot go deep into
78
the internal system for detailed analysis and research. Based on the experimental results, the relatively
79
simplified models can be fitted out, and are usually based on fluid mechanics or continuum medium
80
theory. The numerical simulation can also be used to analyze the motion characteristics of bubbles. Due
81
to a certain gap between the numerical simulation models and the existing experimental conditions,
82
the simulation results can only partly explain the experimental results. In this work, we hope to
83
understand the the gas-solid two-phase flow system more from the point of view of physics. Using
84
thermodynamics and fluid mechanics theory, we establish a new bubble physical model. The dynamic
85
properties of bubbles in the gas-solid two-phase flow system as shown in Fig. 1 are studied using the
self-consistent theoretical method. Through establishing and researching the bubble thermodynamic
87
equation, we examine the properties of bubbles in the gas-solid two-phase flow system on the basis of
88
Ergun and bubble dynamics equations.
89
2. Theoretical model 90
The state equation of the general thermodynamic systems can be expressed asρ = ρ(P,T)or 91
f(ρ,P,T) =0, whereρis the density of a system,Pis the pressure, andTis the system temperature. 92
The state equation is very important for general thermodynamic systems. With this equation, the
93
other thermodynamic properties which can not be measured by experiments directly can be obtained.
94
The ideal gas state equation can be represented asρ=P/RT, while for the real gas (thermodynamic 95
systems), the state of equation can be written asρ=P/Z(P,T)RT. Here,Ris the gas constant, and 96
Z(P,T)is called the compression coefficient, which indicates the deviation from the ideal gas state
97
equation. The ideal gas model is a theoretical model which can be used as one of the criteria to measure
98
the real gas state equations, which can be used for approximate estimations in a practical application.
99
When the pressure is close to zero or the volume is close to infinity, any real gas state equations should
100
be reduced to the ideal gas equation. A gas-solid two-phase flow is a complex thermodynamic system,
101
and thus the theoretical model of the system simplified as an ideal system is no longer applicable.
102
2.1. PR equation and the heat capacity ratio of bubbles 103
None of the real thermodynamic systems conform completely with the law of ideal gas. The deviation depends on the pressure, the temperature, and the gas properties, especially with respect to the degree of difficulty of gas liquefactions. The gas-solid two-phase flow bubble systems contain not only gas interacting between air molecules, but also partial solid particles. With the change of ambient pressures and temperatures, the proportion of the particle phase and the gaseous phase varies. Therefore, the system is a non-ideal complex system, which needs the non-ideal state equation for study. The non-ideal gas state equation is widely used in engineering, and includes the Van der waals equation, the Redlich Kwong (RK) equation, the virial equation and so on. When the RK equation is used to calculate strong polar compounds, it causes large deviations and is thus rarely used to calculate liquid pressures, volumes, and temperatures. The virial equation is not a good match for the polar compounds, and gas-solid two-phase flow cannot be described by a set using the virial coefficient [20]. There are large deviations for the RK and Redlich Kwong Soave (RKS) equations in calculating the critical compressibility factor Zcand liquid density. However, the Peng-Robonson (PR) equation
makes up for the obvious deficiencies, with a better accuracy in the calculation of saturated vapor pressure, saturated liquid density, and other aspects, especially in calculations of the multiphase fluid systems, which are some of the most commonly used equations in engineering design calculations. In this paper, the PR equation is developed to investigate the gas-solid two-phase flow [21]. In this system, the PR equations, which are corrected by Stryjek and Vera, are proposed to calculate the bubble properties of the gas-solid two-phase flow system [22]. The specific form of the PR equation is
P= RT
V−b−
a
V2+2bV−b2, (1)
where a = acα, ac = 0.457R2Tc2/Pc, α1/2 = 1+ (0.375+1.542ω−0.27ω2)[1−(T/Tc)1/2], b =
0.078RTc/Pc, P is the system pressure Pa, R is the gas constant (J·mol−1·K−1), V is the molar
volume(m3·mol−1), T is the absolute temperature (K),ωis eccentric factor with the zero dimension,
Tcis critical temperature, and Pcis the critical pressure Pa[22]. The gas-solid two-phase flow system
the internal energy of the thermodynamic system is a state function of the system. According to the internal energy differential formula, it is expressed as
dU=CvdT+ [T(∂P
∂T)v+P]dV, (2)
where U is the internal energy of system, andCvis the constant volume molar specific heat of the
system. The differential form of the internal energy of the non-ideal thermodynamic system can be given by combining the thermodynamic state equations, which reads
dU=CvdT+ a
V2+2bV−b2dV. (3)
According to the first law of thermodynamics (dU = dW+dQ), in the gas-solid two-phase flow
104
system, the internal energy of gas changes through the quantitative non-ideal gas via the adiabatic free
105
expansion process. This occurs outside for the gas in the adiabatic process withdW=−PdV.
106
Combined with the differential form of internal energy of non-ideal gas, we can obtain
CvdT+ ( a
V2+2bV−b2+P)dV =0. (4)
In order to avoid tedious calculus, the PR equation can be simplified asPV=ζRT, where the deviation from the non-ideal gas to the ideal gas is attributed to the deviation factorζ. After solving the state
equation for the differential coefficient, PdV+VdP = ζRdT. According to the definition of the constant-volume molar-specific heatCv, the expressionCv=ζR/(γ−1)can be obtained. Thus, the
differential equation of the state equation can be expressed as
PdV+VdP=Cv(γ−1)dT, (5)
Combining with the differential formula of the internal energy, we acquire
[γP+ a(γ−1)
V2+2bV−b2]dV+VdP=0. (6)
Furthermore, we consider the Newton velocity formulavs =pdP/dρ, wherevs is the propagation
velocity of the sound wave in the system, and ρ is the medium density. This process can be
approximately regarded as a quasi-static adiabatic process during acoustic wave propagation,
v2s = −V2∂P/∂V. Hence, the partial derivative of the equation is the partial derivative under the
adiabatic condition, andV=1/ρis regarded as the volume of unit molar mass. By Equation (6), it can
be written as
dP dρ =
γP dρ −
aρ(γ−1)
b2ρ2−2bρ−1. (7)
Here,ρis the density of bubble systems, which can be calculated byρ=3.48×10⁻³P/T(kg/m3), and
the speed of sound withvs =331.3+ [0.606×(T−273.5)]m/s. Considering the above calculations,
the heat capacity ratio of the gas-solid two-phase flow bubble system is obtained as
γ= (95.77P/T−0.7+1.28PT)×(1.22×10
5b2P2−6.97×10⁻³bPT−T2)−3.48×10⁻³aP2T
1.22×10⁵b2P3−1.22×10⁵aP2−6.97×10⁻³bP2T−PT2 . (8)
It is clear that the heat capacity ratioγis very different from the previous studies, where it is not a 107
constant, but a function of the system pressures and the temperatures.
108
2.2. Gas velocity equation in the gas-solid two-phase flow system 109
our research focuses on the characteristics of bubbles in the direction Z of the motion with a steady state in the X-Y plane. Based on the results of the previous results and the experiments, Ergun obtained the comprehensive expression that the pressure drop∆Pof the gas-solid system decreases with the change of Z, which reads
∆P Z =150
(1−ε)2µgu
ε3(φsdp)2
+1.75(1−ε)ρfu
2
ε3φsdp . (9)
φsis the spherical degree of solid particles. The first item of the equation (9) at the right is the viscosity
term, and it takes the leading role when the flow rate is low. The second item of the equation (9) at the right is the inertia term, which plays a major role when the flow rate is higher and the flow is turbulent.
εis the void content in the gas-solid two-phase flow which represents the proportion of space occupied
by the gas and the space occupied by the system. u is the gas velocity of the gas-solid two-phase flow.
dpis the solid particle diameter.ρf is the density of the gas-solid flow.µgis the viscosity of this flow.
The critical fluidization velocityuf is the fluidized velocity where the gas-solid flow pressure drop
∆Pis equal to the weight of the solid particles, which can be derived from the Ergun equation for the minimum fluidization conditions. The Ergun equation (9) can be written as
1.75Re
2
f
φsε3+150
1−ε
φ2sε3Ref =Ar. (10)
Here,Ref =dpufρf/µg, andAr =d3pρf(ρp−ρf)g/µ2g. As a result, we can obtain the equation, which
is
(1−ε)ρfdpuf
ε3φ2sµg
+1.75ρ
2
fd2pu2f
150φsε3µ2g =
ρfd3p(ρp−ρf)g
150µ2g , (11)
The critical fluidization velocity is obtained as
uf =
µg
ρfdp
[
v u u
t1.84×103
(1−ε)2
φs2 + φsε3
1.75
gd3pρf
µ2g (ρp−ρf)−42.85
1−ε φs
], (12)
where g is the acceleration of gravity, andρp is the solid particle density. The relationship of the
110
solid particle density ρp, the density of the entire system ρf, and the gas/air densityρ0 isρf =
111
(1−ε)(ρp−ρ0). Ergun’s drag model is a standard and valid mode in two-phase flows, especially 112
in fluidized beds, which has been used up to now [24]. Moreover, Syamlal O’Brien drag model has
113
been developed to study the pressure drop in two-phase flows on the basis of Ergun model [25]. Sau
114
et al. have suggested that the dimensionless empirical correlation approach can be used to calculate
115
the pressure drop with the experimental results [26]. Recently, Zhang et al. have present a study to
116
investigate on the pressure drop ratio in non-unform fluidizations by Prigogine’s minimum of entropy
117
production principle [27].
118
Moreover, the average bubble diameter of the gas-solid two-phase flow in the Mori and Wen models can be expressed as a function of the bubble rise height Z, with the maximum bubble diameter ofdbm=1.64[(u−uf)]0.4. In the whole two-phase flow system, bubbles rise slowly from low to high,
and the size diameter rising along the height of Z is [28]
db(Z) =0.54(u−uf)0.4(Z+4
p
A0)0.8g−0.2, (13)
2.3. Bubble size and velocity equation 120
For such a thermodynamic system with the adiabatic model, the pressure inside the bubbles is related to the initial state of the bubbles and the volume of the bubbles. Therefore, the relationship between the bubble pressure P and the volume V is [19]
P=Pc+P0(V0 V)
γ, (14)
Where P0and V0are respectively the initial pressure and volume of bubbles, and Pcis the saturated
pressure. The simulation model of the bubbles is approximately considered as the sphere model. The relationship of the bubble volume V with the rising velocity u and the height Z is obtained through the formula of sphere volume and diameter size, which is
V= π
6[0.54(u−uf)
0.4(Z+4p
A0)0.8g0.2]3. (15)
Based on the above deductions, u as the function of Z follows, we have
P0
V
γ 0 −(
π
6)
γ[0.54(u−u
f)0.4(Z+4
p
A0)0.8g0.2]3γ
=Z(π
6)
γh150(1−ε) 2
µgu
ε3(φsdp)2
+1.75(1−ε)ρfu
2
ε3φsdp
i
×[0.54(u−uf)0.4(Z+4
p
A0)0.8g0.2]3γ. (16)
Through self-consistent solving equations (11), (12), (14), (15) and (16), the change of the air velocity u with regard to the rising height Z in the gas-solid two-phase flow can be obtained as shown in Fig. 1. Then, the distribution of the bubble diameterdb(Z), as well as the distribution of the velocity
of characteristic bubbles at the specific height Z in the gas-solid two-phase flow are as follows:
ub(Z) =0.711
q
gdb(Z) +u−uf. (17)
In the gas-solid two-phase flow system, the distributions and properties of the solid phase lead to the
121
pressure and temperature variations of the bubble phase, and then result in the changes of the bubble
122
heat capacity ratioγ. Moreover, the changes of the heat capacity ratioγaffect the distributions and 123
variations of the solid phases, and thus strongly influence the property of the gas-solid two-phase flow
124
system. The solid and gaseous phases in the system represent a self-consistent system, and mutually
125
affect and restrict each other.
126
3. Results and discussion 127
Equations (8), (11), (12), (13), (14), (15), and (16), form self-consistent systems of equations. For
128
a given Z, initial pressure P0, and initial volume V0, the gas velocity u, bubble sizedb(Z), and the
129
change law of the bubble rising velocityub(Z)are simulated through the self-consistent calculations in
130
the gas-solid two-phase flow systems as shown in Fig. 1. In this paper, three different parameters for
131
solid particles are selected respectively in order for comparison with each other. These parameters
132
are black triangles (φs = 0.8,ρp = 1.3×10³ kg/cm3,dp = 0.03m), black squares (φs = 0.8, ρp =
133
1.4×10³kg/cm3,dp=0.02m) and black dots (φs=0.8,ρp=1.5×10³kg/cm3,dp=0.15m) as shown
134
in Figs. 3, 4 and 5.
135
Figure 2 shows the heat capacity ratioγof the bubble systems in the gas-solid two-phase flow as 136
the function of the pressure P for the different temperatures T. It can be seen from Figure 2 that the
137
heat capacity ratio of the bubbles increase with the increasing of pressure P at a fixed temperature T. It
138
shows that our numerical result is obviously different from that in the ideal gas systems, which is a
139
function of the temperature and the pressure for our mode. The heat capacity ratio in ideal gas system
140
is a constant (1.4) and the value does not change with the state parameters of the systems. In the
z
x
Y
Gas
Bubble
Solid
Figure 1.The schematic for the gas-solid two-phase flows
1.0 1.5 2.0 2.5 3.0
1.40 1.41 1.42
280 K
290 K
300 K
p (10 5
Pa)
1 2 3 4 5 6 7 0.0
0.2 0.4 0.6 0.8
u
(
m
/
s
)
Z (m)
Figure 3.The speed of the flow versus the height Z for the different conditions.
1 2 3 4 5 6 7
0.8 0.9 1.0
d
b
(
m
)
Z (m)
Figure 4.The size of the bubbles versus the height Z for the different conditions.
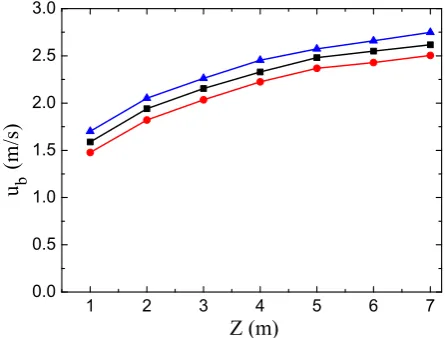
1 2 3 4 5 6 7
0.0 0.5 1.0 1.5 2.0 2.5 3.0
u
b
(
m
/
s
)
Z (m)
past, when studying the characteristics of bubbles, the heat capacity ratio has usually been regarded
142
as the ideal gas constant [23]. We obtain the expression of specific heat capacity of the gas-solid
143
two-phase flow system through establishing a non-ideal gas model. With the increasing temperature,
144
the heat capacity ratio also increases clearly. Meanwhile, it can be clearly seen that Equation (16) is
145
a complicated exponential root and the index variety can lead to the fundamental changes of the
146
equation. Moreover, the small changes of the heat capacity ratio also lead to extensive changes of u, dz,
147
and ub. As a result, the bubble system heat capacityγindicates an important effect on the properties 148
of the overall bubbles in the gas-solid two-phase flow.
149
In Figure 3, the air velocity u as the function of Z in three sets of parameters is obtained through
150
the self-consistent calculations in the gas-solid two-phase flow. As can be seen in Figure 3, with the
151
increase of the height Z, the air flow rate u in the gas-solid two-phase flow shows a downward trend,
152
with a smaller and smaller decline rate with increasing Z, gradually stabilizing and reaching a stable
153
airflow state. This shows that the smaller the particle density, the greater the air flow rate in the
154
gas-solid two-phase flow. The greater the diameter of solid particles, the greater the airflow velocity at
155
the same height. The physical reason behind this is that the large particle diameter results in a large
156
void ratioε, which leads to a large flow velocity. Due to the differences in the particle size, the pressure, 157
and the temperature in the gas-solid two-phase flow, the whole system becomes very different and
158
the environment around the bubbles also becomes very different. As shown in Figure 2, this effect is
159
reflected in the specific heat capacity of the bubbles, which changes significantly, resulting in changes
160
of gas speed and solid speed in the whole gas-solid two-phase flow. It is clear that the air velocity
161
gradually stabilizes, which is beneficial to the stability of the gas-solid two-phase flow. The results
162
indicate that such system can be used as a medium for particle separations.
163
Figure 4 shows the bubble diameterdbas the function of the gas flow height Z by the self-consistent
164
calculations in the gas-solid two-phase flow. It is shown that with increasing the height Z, bubble sizes
165
show a variation of decreasing and then increasing, just like the U type, in the gas-solid two-phase
166
flow. This indicates that the gas velocity, the pressure, the particle density, and the particle diameter
167
are combined together and collectively influence the diameter of bubbles in the gas-solid two-phase
168
flow. When the bubbles rise with the air flow, the external pressure decreases, since the external airflow
169
rate is relatively large. At the same time, the solid particles suppress the increase of bubble volume,
170
resulting in the bubble sizes being smaller in the initial stage. With increasing height Z, the external
171
air velocity, solid phase particle density, particle diameter, spherical degree, and other factors cannot
172
suppress the increase of air bubbles because the pressure P is so weak. At this time, the reduction of
173
external pressure plays a key role. Consequently, the bubble sizes increase with the increase of the
174
rising speed. It is found that the bubble phase depends strongly on the solid phase in the gas-solid
175
two-phase flow. The greater the density of solid phase particles, the smaller the bubble sizes in the
176
two-phase flow, which reveals that the high density of the particles can inhibit the increasing of the
177
bubble sizes. Meanwhile, the particle size is smaller, and the bubble size is smaller at the same height
178
Z. This is because the particle size and void fraction are smaller in the gas-solid flow, which can limit
179
the growth of the bubble. We find that our theoretical results can be compared with the recent reported
180
results. It is experimentally found that the size of gas bubble increases gradually from the bottom of
181
the systems (see e.g. Fig 7(a))[29]. Chen et al. have found that the bubble size enlarges by increasing
182
the height position base of the numerical simulations (see e.g. Fig. 10)[30]. However, we should notice
183
that a local minimum of the bubble sizes is observed for our self-consistent physical model, which are
184
not demonstrated experimentally at present. Our theoretical results are agreement with the reported
185
results after the local minimum sizes. Moreover, we hope our theoretical findings can be verified by
186
experiments.
187
Figure 5 shows the change of the bubble rising velocityubwith the height Z by the self-consistent
188
calculations in the gas-solid two-phase flow. In Figure 4, the velocity of bubblesubis very different
189
from the outside air velocity u in Figure 3 in the gas-solid two-phase flow. It is obvious that the bubble
190
velocity is much faster than the air flow velocity. With the increasing of the height Z, the bubble
velocity increases and tends to be quasi-stable in gas-solid two-phase flows. In the gas-solid two-phase
192
flow, the smaller the particle density, the larger the bubble velocity is. The diameter of solid particles is
193
larger, and the bubble velocity is greater at the same height. This is because particle diameter becomes
194
larger on increasing the void fractions in the two-phase flow, which gives rise to the large bubble
195
phase velocity. The bubble velocity is influenced by the air velocity and the bubble size. Therefore,
196
the properties of the bubble velocity are very similar to those of the gas flow velocity in gas-solid
197
two-phase flow. Moreover, the bubble size firstly decreases and then increases. With the effect of the
198
both aspects, the velocity of the bubble gradually increases and eventually stabilizes. We should also
199
point out that the gradual stabilization of the bubble velocity is beneficial to the stability of gas-solid
200
two-phase flow systems and the separations of different particles in this system. The tracer testing
201
technology has been widely applied to study the properties of bubbles in multi-phase flows. The
202
very recent experimental research by the technology shows that the bubble velocity become large
203
by increasing the bed locations (see e.g. Fig 7(b))[29]. We find that our theoretical results are very
204
consistent with the experimental results.
205
4. Conclusions 206
The properties of the bubbles in the gas-solid systems have been self-consistently investigated
207
based on fluid mechanics theory, bubble thermodynamic equations, and kinetic equations. We found
208
that the bubble heat ratio of the gas-solid two-phase flow significantly increases with the increase of
209
temperature and pressure in the bubble system. The bubble heat ratio has a significant impact on the
210
properties of bubbles. Theoretical study has shown that the air velocity decreases with the increase of
211
the air flow height in the gas-solid two-phase flow, which finally stabilizes, with the height increasing
212
and reaching a steady state. A local minimum in bubble sizes as a function of height can be observed.
213
The rising velocity of bubbles depends strongly on the air velocity and the bubble sizes, with the
214
speed gradually increase and eventually quasi-stabilizing. The physical reason for these phenomena
215
is that the temperature and the pressure of gas phase determine the bubble heat capacity ratio in the
216
gas-solid two-phase flow, and the heat capacity ratio is influenced by the density, the size, and the
217
granularity of the solid phase, which affects the air speed and bubble size conversely. Since the bubble
218
velocity depends strongly on the air velocity and the bubble size, the gas phase and the solid phase
219
interact with each other and a self-consistent system comes into being. Our theoretical results enrich
220
and deepen the theory of gas-solid two-phase flow. The results presented and discussed in this paper
221
can be used to understand the properties and effects of the bubbles in gas-solid two-phase flows.
222
Acknowledgments:The project was supported by the China Postdoctoral Science Foundation (No. 2014M551707, 223
2014T70564), and the Postdoctoral Science Foundation of Jiangsu Province (No. 1302003B). 224
References 225
1. Kadanoff Leo P.Reviews of Modern Physics1999, 71, 435. 226
2. Wang S.; He Y.Q.; Wei H.; Xie W.N.International Journal of Analytical Chemistry2017, 2017, 4763937. 227
3. Yuan Z.L.; Zhu L.P.; Geng F.; Peng Z.B.Gas-solid Two Phase Flow and Numerical Simulation (Southeast University 228
Press),2012. 229
4. Glasser B.J.; Sundaresan S. and Kevrekidis I.G.Physical Review Letters1998, 81, 1849. 230
5. Martyushev L.M.; Celezneff V.Entropy2017, 19, 126. 231
6. Harrision D.; Leung L.S.Nature1961, 190, 433. 232
7. Pak H.K; Behringer R.P.Nature1994, 371, 231. 233
8. Xiong Q.G.; Lia B.; Zhou G.F. et al.Chemical Engineering Science2012, 71, 422. 234
9. Lare V; Piepers H.W.; Sehoonderbeek J.N. et al.Chemical Engineering Science1997, 52, 829. 235
10. Ichiki K.; Hayakawa H.Physical Review E1995, 52, 658. 236
11. Farshi A.; Javaherizaden H.; Hamzavi Abedi M.A.Petroleum & Coal 2008, 50, 11. 237
12. Valverde J.M.; Castellanos A.; Mills P.; Quintanilla M.A.S.Physical Review E2003, 67, 051305. 238
14. Homsy G.M.Applied Scientific Research1998, 58, 251. 240
15. Tafreshi Z.M.; Kingsley O.G.; Adesoji A.A.The Canadian Journal of Chemical Engineering2000, 78, 815. 241
16. Komatsu T.S.; Hayakawa H.Phys. Lett. A1993, 183, 56. 242
17. Choi J.H.; Son J.E.; Kim S.D.Journal of Chemical Engineering of Japan1988, 21, 171. 243
18. Al-Zahrani A.A.; Daous M.A.Powder Technology1996, 87, 255. 244
19. Best J.P.Journal of Fluid Mechanics1993, 251, 79. 245
20. Tian J.X.; Jiang H.; Guic Y.X.; Mulerod A.Phys. Chem. Chem. Phys.2009, 11, 11213. 246
21. Martín C; Jrgen M.Fluid Phase Equilibria2005, 232, 74. 247
22. Gasem K.A.M.; Gao W.; Pan Z.; Robinson Jr.R.L.Fluid Phase Equilibria2001, 181, 113. 248
23. Vandermeulen J.; Leliaert J.; Dupre L.; Van Waeyenberge B.Journal of Physics D2017, 50, 495007. 249
24. Wei L.P.; Lu Y.J.Chemical EngineeringScience2016, 147, 21-29. 250
25. Syamlal M.; O’Brien T.J.AICHE Journal2003, 49, 2793-2801. 251
26. Sau D.C.; Mohanty S.; Biswal K.C.Chemical Engineering and Processing2008, 47, 2114-2120. 252
27. Zhang C.X.; Qian W.Z.; Wei F.Chemical Engineering Science2017, 173, 187-195. 253
28. Darton R.C.; Lanauze R.D.; Davidson J.F.; Harrison D.Trans IChemE.1977, 55, 274. 254
29. Zhang C.X.; Li P.L.; Lei C.; Qian W.Z.; Wei F.Chemical Engineering Science2018, 176, 515-523. 255