Article
1
Migration of barchan dunes in Qatar – controls of the
2
Shamal, teleconnections, sea-level changes and
3
human impact
4
Max Engel 1,*, Fabian Boesl 2 and Helmut Brückner 2
5
1 Royal Belgian Institute of Natural Sciences, OD Earth and History of Life, Geological Survey of Belgium,
6
Jennerstraat 13, 1000 Brussels, Belgium
7
2 University of Cologne, Institute of Geography, Zülpicher Str. 45, 50923 Cologne, Germany
8
* Correspondence: [email protected]
9
10
Abstract: Barchan dune fields are a dominant landscape feature in SE Qatar and a key element of
11
the peninsula’s geodiversity. The migration of barchan dunes is mainly controlled by dune size,
12
wind pattern, vegetation cover and human impact. We investigate the variability of dune migration
13
in Qatar over a time period of 50 years using high-resolution satellite and aerial imagery and explore
14
its relation to the regional Shamal wind system, teleconnection patterns, and limitations in sand
15
supply associated with the transgression of the Arabian Gulf. We detect strong size-dependent
16
differences in migration rates of individual dunes as well as significant decadal variability on a
17
dune-field scale, which was found to be correlating with the intensity of the North Atlantic
18
Oscillation (NAO) and the Indian Summer Monsoon (ISM). High uncertainties associated with the
19
extrapolation of migration rates back into the Holocene, however, do not permit to further specify
20
the timing of the loss of sand supply and the onset of the mid-Holocene relative sea-level (RSL)
21
highstand. For the youngest phase considered in this study (2006–2015), human impact is
22
anticipated to have accelerated dune migration under a weakening Shamal regime through sand
23
mining and excessive vehicle frequentation upwind of the core study area.
24
Keywords: Aeolian geomorphology; Arabian Peninsula; Arabian/Persian Gulf; Remote sensing;
25
Holocene landscape change
26
27
1. Introduction
28
Barchan dunes are singular crescentic features with a convex side directed upwind and two
29
horns pointing downwind. They form from small sand patches by windward deflation over a
30
gradually developing low-angle slope, where grains eventually slide down a steeper leeward slope.
31
This process is faster at the lower margins resulting in the horns running ahead [1]. Barchan dunes
32
form in areas of moderate sand supply and low variability of wind direction [2–4]. Slight variations
33
of wind direction may result in single horn extension or even the transformation to linear dunes [5].
34
Barchan dynamics are complex and their migration is a function of shear stress and, more
35
pragmatically, closely related to wind velocity [2]. Barchans represent excellent recorders of wind
36
pattern changes since migration speed responds sensitively to changes in wind speed by a factor of
37
three [6], even though the secondary, micro-scale air flow regime [2] and dune height play a role as
38
well. Based on the derivate of v (velocity) with respect to u* (wind shear velocity) of Bagnold’s [7]
39
equation
40
v=Cu*3/h, (1)
where C=the constant of proportionality and h=barchan dune height, any modification in wind speed
41
is enhanced by a factor of three in dune velocity [6]. Thus, on a dune field scale, barchan dunes of
42
different sizes may collide and merge [4]. The smallest barchan dunes may reach migration rates of
43
30–100 m yr-1 [3]. Speed acceleration and sand transport are highest at the upper part of the gentler
44
windward slope due to upslope streamline compression, whereas the barchan’s crest marks the
45
boundary between aeolian erosion and gravitational accumulation areas [2]. Barchan dunes respond
46
to environmental change, as increased moisture and the establishment of vegetation may result in
47
speed reduction or even the transformation into a stationary parabolic or blow-out dune [8].
48
49
Figure 1. a) Overview of the Qatar peninsula based on SRTM30 data [9] and the GEBCO_2014 grid
50
[10] showing the location of the distribution of aeolian surface deposits, the core study area within
51
the barchan dune fields, the associated downwind Umm Said sabkha, the former main sediment
52
source areas of the shallow Bahrain Ridge and northern Gulf of Salwa, the main corridor of barchan
53
migration in the past (azimuth 332° deviation from N after [11]), and the distribution of long-term
54
geomorphic indicators of Shamal predominance. b) Core study area with barchan dunes B1–B16.
55
Dunes mined between 2006 and 2015 are marked with red asterisk. c) Examples of dune migration
56
58
Figure 2. Monthly distribution of mean wind speed, general percentage of hours of wind speed >13
59
km h-1, and percentage of hours of wind speed >13 km h-1 within the Shamal corridor (290°-010°
60
deviation from N) at Doha International Airport [12], the longest serving climate station in Qatar.
61
Interpolating migration rates from short-term observations is challenging since small dunes may
62
separate from the horns of larger ones [13] and the size of barchans fluctuates over time [4]. Size
63
changes are determined by the difference between upwind sand supply and efflux from the horns,
64
which is a function of horn width [14]. However, on a dune-field scale and in the long term, the size
65
of barchans is considered to stay rather stable [2,15] and, therefore, fluctuations in dune swarm
66
migration over larger time-scales may be closely related to external factors, mostly changing wind
67
patterns or changes in vegetation cover.
68
In Qatar, remnant barchans dunes occur in the southeast and are assumed to have travelled over
69
the entire peninsula from the NW, driven by the regional Shamal wind regime (Figure 1). Their
70
absence in most parts of Qatar today has been related to rapid post-glacial flooding of the shallow
71
Arabian Gulf starting at around 14,000 years, when mobile sand dunes covered almost the entire floor
72
of the Gulf. At the time when present sea level was reached, shortly before the regional highstand of
73
c. +2 m, sand sources in the wider area of the Bahrain Ridge were drowned resulting in large parts of
74
the peninsula gradually becoming free of dunes [16–18]. The exact timing of the loss of sand supply,
75
however, is largely unclear. Rough estimates of 8000–6000 years ago [19,20], 10,000–8000 years ago
76
[21], or even 12,000 years ago [22] can be found in literature, along with the rather precise timing of
77
4100 years ago [11]. Likewise, a broad range of dates is found for the mid-Holocene sea-level
78
highstand both in Qatar and the wider Gulf region, e.g. 8000–4000 years ago [23], 5 to 6 millennia ago
79
[24], 6000–4500 cal yrs. BP [25], around 6000 BP [18], 5000–3500 cal yrs. BP [26], or “shortly after 5290–
80
4570 cal yr BP” [27] (p. 79).
81
In this paper, we provide a precise 50-year record of barchan dune migration in Qatar and
82
analyse the driving mechanisms. Understanding the long-term migration of the peninsula’s dunes is
83
important, as their mobility imposes a hazard on built infrastructure and the developing agricultural
84
sector [28]. We discuss the influence of variability in global circulation patterns on Shamal activity
85
and dune mobility. In a further step, we compare extrapolated migration rates with the loss of the
86
sand source after flooding of the Bahrain Ridge and the Gulf of Salwa, and try to provide more precise
87
chronological constraints. In a last step, the effect of human impact through sand mining and
88
excessive vehicle frequentation on barchan dune dynamics in Qatar will be evaluated.
89
2. Study area
90
2.1. The physical setting and wind pattern of Qatar
91
The Qatar peninsula is an anticlinal structure of uplifted Tertiary limestone, dolomite, marl,
92
chalk and shale formations protruding into the Arabian Gulf. Today’s low to moderate relief is
93
carbonates with intercalated anhydrites [29, 30]. Tectonic uplift and slight folding since then resulted
95
in the emergence of Qatar, its continental conditions and a lack of sediments from subsequent stages
96
and series. Miocene sedimentary rocks are mainly found in southern Qatar, represented by shallow
97
marine limestones, gypsum, dolomite, and mud of the Dam Formation as well as the continental
98
Hofuf conglomerates. The topography is rather flat, notable rises only occur in the south [29].
99
100
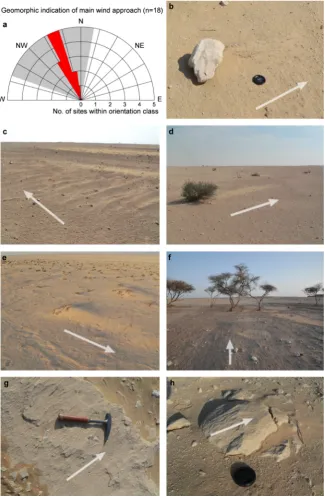
Figure 3. a) Direction of all geomorphic indicators of Shamal predominance mapped during the field
101
survey (Figure 1a). The wider Shamal of 290°–010° is grey-shaded. b) Micro-yardang inside a rawdha
102
indicating deflation in these silt/sand-filled karstic depressions. Its formation is triggered by
103
protection through a larger boulder. c) Transversal wind ripples perpendicular to Shamal direction,
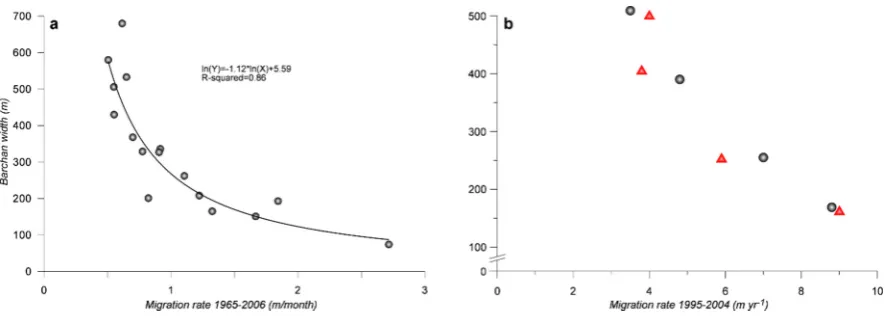
104
c. 10 cm high. d) Incipient nebkha associated with a rather long drape of sand developed in the lee of
105
a shrub. e) Small herbaceous nebkha with shorter leeward tail. f) Linear corrasion features on a rawdha
106
surface. g) Linear corrasion features on a MIS 5 beachrock (see “Pleistocene beach ridge” in Figure 1b)
107
[25]. h) Linear corrasion features on subarially exposed Dammam limestone. All arrows point into the
108
The climate of Qatar is arid, though the relative humidity may rise up to 90%. The annual
110
precipitation ranges between 50–80 mm and occurs mainly during winter and spring (Figure 2).
111
However, the spatio-temporal pattern of rainfall is very irregular [11]. The wind regime is dominated
112
by the NW to N regional Shamal winds, approaching Qatar mostly during early June to mid-July and
113
November to March, respectively [31]. This regional wind system mostly affects Saudi Arabia,
114
Kuwait, and Qatar [32] and controls the movement of barchans in SE Qatar [11]. In May, the summer
115
Shamal is mainly determined by a lower to middle tropospheric westerly trough over Iran and a
116
corresponding ridge over Anatolia resulting in atmospheric descent over the northern Arabian
117
Peninsula and creation of a regional high, which, in combination with an established low over Iran,
118
initiates short-term, multiple-day Shamal conditions over Qatar [32]. Surface wind speeds reach up
119
to 13 m s-1 [33]. Stronger and longer-duration Shamals during June and July are controlled by a steep
120
gradient between the Mediterranean high-pressure cell, and the regional low over Iran resulting from
121
extreme heating of surface air masses [32,34,35]. The winter Shamal (November to March) may even
122
reach wind speeds of 15–20 m s-1 over the Arabian Gulf [35,36] and is usually associated with a surface
123
low-pressure area over Syria migrating eastward towards Iran and pushing a cold front south and
124
west. A low along this southward moving front in the northern Arabian Gulf and a surface high over
125
the northern Arabian Peninsula finally induce the winter Shamal, which is not as consistent as its
126
summer counterpart [31]. The long-term persistence of dominating winds from 290–010° is also
127
reflected by the alignment of the main axis of nebkhas and sand drapes at prehistoric burial cairns,
128
by micro-yardangs inside the inland sediment-filled depressions (rawdhat), or sandblasting features
129
on rock surfaces in most parts of the peninsula (Figure 3).
130
2.2. Barchans of Qatar
131
Barchanoid dunes cover significant parts of the ergs of the Sahara, the Takla Makan in northern
132
China, the Pesky Karakumy of Kasakhztan and the Rub’ al-Khali on the eastern Arabian Peninsula
133
[37]. In Qatar, dunes are concentrated in the southeast and cover c. 10% of the entire peninsula, i.e. c.
134
976 km². According to the main approaching angle of the Shamal winds, the tails of the barchans
135
point to SSE–SE [11,29]. Embabi and Ashour [11] mapped four types of barchans dunes in SE Qatar,
136
including (i) textbook-like simple barchans of various sizes (width across horns 15–1000 m); (ii)
137
modified barchans with a longer and thinner western horn; (iii) compound barchans in transition to
138
longitudinal dunes; and (iv) fully developed longitudinal dunes. Dune asymmetry as observed
139
within the modified barchans is ascribed to a local SE wind component. Height reaches up to 40 m
140
but is mostly less than 10 m. The barchans mainly consist of quartz sand with minor portions of
141
skeletal grains and dust with occasional heavy mineral components, locating its source on the
142
Arabian Shield. Sands are unimodal and peak in fine to medium classes. Grains are generally
143
rounded to subrounded [11]. Barchan dunes covering the floor of the shallow Gulf of Salwa have also
144
been identified on Landsat imagery [21].
145
3. Materials and methods
146
In a first step, the migration was recorded for 16 individual barchan dunes (B1–B16) by
147
multitemporal analysis of high-resolution satellite images. The study area was defined based on the
148
availability on satellite scenes, and the presence and traceability of barchan dunes. The multitemporal
149
analyses included Gambit KH-7 (1965), Hexagon KH-9 (1978), a resampled aerial ortho-mosaic (1995),
150
Orbview (2006), and SPOT (2015) data (Table 1). All scenes were rectified using an IKONOS mosaic
151
of 2004 and 40–60 reference points by spline transformation/interpolation in ArcGIS. The IKONOS
152
scene uses the local coordinate reference system QND95 and is projected on the Qatar National Grid.
153
Some of the few persistent reference features are provided by Pleistocene aeolianite and beachrock
154
156
Figure 4. Approach of multitemporal satellite and aerial image analysis exemplified for barchan dune
157
B8 (Figure 1b). Between 1965 and 2015, the entire barchan moved for ca. 587 m towards SSE (average
158
value), the western horn even 636 m.
159
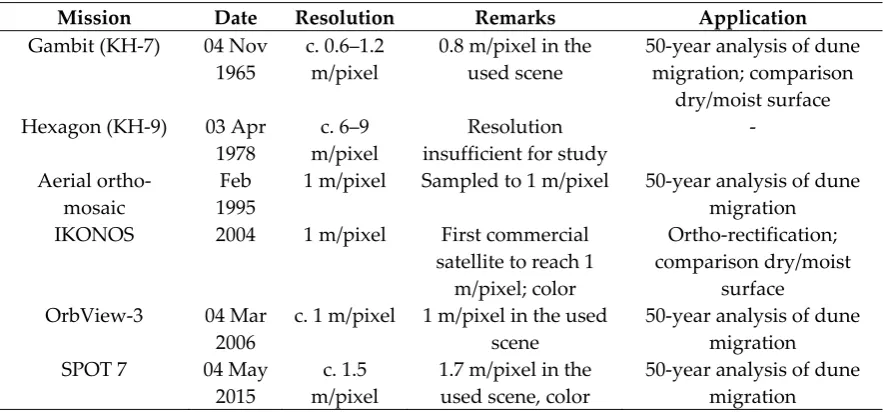
Table 1. Imagery used in this study.
160
Mission Date Resolution Remarks Application
Gambit (KH-7) 04 Nov 1965
c. 0.6–1.2 m/pixel
0.8 m/pixel in the used scene
50-year analysis of dune migration; comparison
dry/moist surface Hexagon (KH-9) 03 Apr
1978
c. 6–9 m/pixel
Resolution insufficient for study
-
Aerial ortho-mosaic
Feb 1995
1 m/pixel Sampled to 1 m/pixel 50-year analysis of dune migration IKONOS 2004 1 m/pixel First commercial
satellite to reach 1 m/pixel; color
Ortho-rectification; comparison dry/moist
surface
OrbView-3 04 Mar
2006
c. 1 m/pixel 1 m/pixel in the used scene
50-year analysis of dune migration
SPOT 7 04 May
2015
c. 1.5 m/pixel
1.7 m/pixel in the used scene, color
50-year analysis of dune migration
The migration was defined as the average displacement of five different reference points on the
161
dune per number of months in between two images: the intersection of the crest as well as the
162
windward and leeward boundaries with the centerline axis, and the tips of both horns (Figure 4). The
163
width across both horns is the main size measure based on the linear relationship between dune
164
height and horn-to-horn width [5,15]. Considering a range of global datasets, Hesp and Hastings [5]
165
w=8.82h+7.65, (2)
where w=horn-to-horn width, and h=height of the barchan slip face (R²=0.808). This type of manual
167
measurement of dune migration for high-resolution imagery in the range of 1 m/pixel has provided
168
reliable results comparable to those from the application of automated tools of subpixel correlation
169
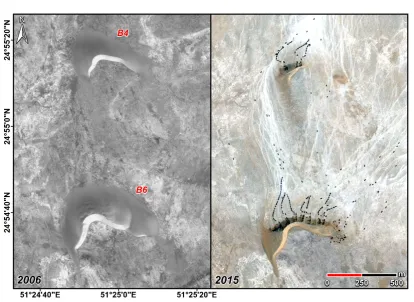
of satellite imagery, such as COSI-Corr [6]. The Hexagon imagery from 1978, however, was
170
eventually discarded due to insufficient resolution, while for the SPOT imagery, individual dunes
171
had to be discarded due to extensive mining activities after 2006 (Figure 5).
172
The influence of bottom moisture on the migration rate was tested by comparison of additional four
173
pairs of barchan dunes of similar sizes, each pair comprising one dune from the Umm Said sabkha
174
with very shallow, fluctuating groundwater levels of only a few tens of cm below surface [28], and
175
one travelling over entirely dry Dammam limestone.
176
In order to estimate the time when the Bahrain Ridge and the Gulf of Salwa became flooded,
177
current relative sea level was reached, and the sand source became cut off, we measured travel times
178
of the 15 barchan dunes within the width range 100–500 m closest to the NW coast (<80 km). The
179
distance to the NW coast was measured in the main Shamal azimuth of 332° deviation from N [11],
180
while individual, size-dependent migration velocities were derived from the regression function of
181
our empirical dataset established in the first step (eq. 4). For interpretation, individual travel times of
182
the barchans from today’s shoreline to their present position were transformed into a probability
183
density function (PDF). An error of 10% and a normal probability distribution were assumed for each
184
time value (=mean value), from which probabilities for additional 20 time values in 1% steps starting
185
from the mean value were derived (-10% to +10%), resulting in 315 data points in total. Binning of the
186
time axis starts at x0=100 and follows the equation
187
x=x0+x0/100. (3)
188
Figure 5. Documentation of Sand mining at two dunes of the core study area between 2006 and 2015
189
as well as associated massive frequentation of >100 heavy trucks at a time, which access the NW part
190
4. Results
192
4.1. Barchan migration
193
The migration rate of the 16 investigated barchan dunes between 1965 and 2006 varies greatly
194
(Figure 6a) ranging from 177 m for a width of 580 m to 951 m (B1) for a width of 74 m (B12). A
195
significant inverse power-law relationship with a confidence of R²=0.86 can be stated for the
size-196
distance distribution following the function
197
ln(Y)=-1.12*ln(X)+5.23, (4)
where Y=horn-to-horn width (m) and X=migration distance per month (m).
198
199
Figure 6. a) Relationship between size of barchan dunes B1–B16 and migration rate over the time
200
period 1965–2006, which is best explained by an inverse power-law function. b) Comparison of
201
migration rates between pairs of similarly sized dunes migrating over dry Dammam limestone
202
surface (circles) and moist sabkha surface (triangles).
203
In order to investigate whether surface moisture has an influence on migration rates, pairs of
204
dunes of similar size travelling over dry Dammam limestone and the Umm Said sabkha with a
205
groundwater table of only a few dm [29] were compared (Figure 6b). While the smallest pair of
206
barchan dunes travelled at comparable speed, the two medium-sized dunes show a slightly faster
207
rate on dry ground. When comparing the largest dunes of the sample, the one inside the sabkha
208
migrates faster. In general, no clear pattern can be observed.
209
Highest dune migration rates were inferred for the time window 1965–1995 ranging from 0.4
210
m/month (B1) to 2.1 m/month (B12) (Figure 7f). The time window 1995–2006 witnesses a significant
211
drop without exception to migration rates of 0.3 m/month to 1.7 m/month. In turn, among the ten
212
barchan dunes not mined between 2006 and 2015, only the largest one became slower (from 0.3 to 0.1
213
m/month). All other dunes experienced an increased migration rate to levels generally below the
214
period 1965–1995 (Figure 7e).
215
The travel times of the barchan dune population in closest proximity to the NW coast (by
216
considering the main Shamal azimuth after Embabi and Ashour [11]), which are assumed to coincide
217
with the cut-off of the sand source and the onset of the mid-Holocene highstand, are deduced from
218
eq. 4 and vary greatly (Figure 8). This large discrepancy is due to the significant size dependency of
219
migration rates. The PDF covers the time period between 3300 and almost 17,000 yrs BP with a small
220
gap around 10,300 yrs BP.
221
4.2. Shamal activity
222
In terms of further mechanisms controlling barchan migration in the longer term, a significant
223
correlation between regional (number of summer Shamal days over the Gulf region, Figure 7b) and
224
activity can be observed. From the 1970s until today, the summer Shamal constantly declined, with a
226
clear step in the mid-1990s (Figure 7b,c). Likewise, if considering the time windows of the
227
multitemporal satellite image analysis of barchan dune migration, the duration of Shamal conditions
228
has dropped from 21.5% (1973–1995) to 15.2% (1995–2006) and 14.8% (2006–2015) (Figure 7e). The
229
positive relationship between the North Atlantic Oscillation (NAO) and the Shamal activity is evident
230
over the longer term, as the intensity of the NAO also declined over the last decades. In particular
231
years of positive or negative summer Shamal extremes in Qatar, such as in 1980/1981, 1983, 1993,
232
2000, or 2013, show the NAO dependency (Figures 7c,d). Likewise, it seems that the intensity of the
233
Indian Summer Monsoon (ISM) reveals similarities with Shamal activity, as exemplified for the
234
strong Shamal years of 1994 and 2015, or the calmer Shamal phase after 1995 (Figure 7a).
235
5. Discussion
236
The multitemporal analysis of satellite imagery revealed the well-established pattern of
size-237
dependent migration rates of barchan dunes [14,15]. However, over centennial and millennial scales,
238
barchan size may vary significantly [4,13] potentially leading to uncertainty when extrapolating such
239
rates.
240
On a dune-field scale, Shamal activity is the main control of barchan migration in Qatar, as
241
shown by remote sensing data from 1965–2006. Surface moisture variability is considered negligible
242
based on investigation of the sbakha/non-sabkha couplets. As it coincides with driest conditions over
243
the year, the summer Shamal is most efficient in terms of particle transport in the Middle East [36,40].
244
The dependency of the summer Shamal activity from teleconnection patterns is evident from the
245
positive relationship between the NAO index and average wind speed measured at Doha
246
International Airport. This relationship may be explained by the NAO controlling the intensity of the
247
summer season stationary high over the Eastern Mediterranean [41]. The Shamal is fuelled by a steep
248
gradient between the Mediterranean high-pressure cell and the low associated with the ISM located
249
over NW India, Iran, Iraq, Pakistan, and Afghanistan [36,42,43]. This low pressure area usually forms
250
in May and emanates from intense surface heating. It is closely associated with both the upper level
251
mid-latitude circulation over western central Asia and low-level monsoonal circulation over the
252
Arabian Sea and the Indian subcontinent [42,44].
253
The NAO and the ISM have been active over the entire Holocene to support the Shamal and
254
dune migration over the Qatar peninsula, even though both mechanisms show a gradual weakening
255
trend over the Holocene in response to solar insolation [45,46]. In their exhaustive analysis on
256
Quaternary stratigraphy and environments of the Arabian Peninsula, Glennie and Singhvi [47]
257
confirm the long-term persistence of the Shamal, but state a generally weaker intensity during
258
interglacials. While decreasing trends of the NAO and the ISM may indicate a Shamal stronger than
259
today over most of the Holocene and, hence, higher migration rates, wetter conditions during the
260
early to mid-Holocene transition identified in many parts of the Arabian Peninsula [46,48–50] may
261
have stimulated vegetation cover slowing down sand flux and migration speed [4,8,51,52]. In what
262
way these competing mechanisms led to deviations from the migration rates identified in the shorter
263
term multitemporal satellite and aerial image analysis of this study over millennial time scales
264
remains a matter of speculation.
265
During the period 2006–2015 the pattern of dune migration significantly deviates, i.e. a speed
266
increase is accompanied by a weakening of ISM, NAO, and, thus, Shamal activity (Figure 7e). As
267
different varieties of human impact can have tremendous influence on dune mobility – mostly,
268
however, through interaction with vegetation [34,53] –, we hypothesize that the intense sand mining
269
activities in the NW part of the core study area have changed the local wind field and significantly
270
increased sand flux, in particular in the lower range of the dune-forming grain-size spectrum. Both
271
massive truck traffic upwind of the core study area (Figure 5) [54] and the sand mining process itself
272
are assumed to have strongly stimulated sand flux, which is correlated to downwind barchan velocity
273
275
Figure 7. a) Index of Indian Summer Monsoon (ISM) intensity between June and August after Wang
276
and Fan [38]. b) Number of annual Shamal days between May and August over the entire Gulf region.
277
The shading indicates the ±1σ standard deviation across all stations considered [36]. c) Average wind
278
speed in the months of June and July measured at Doha International Airport [12]. d) Monthly and
279
annual mean of the North Atlantic Oscillation (NAO) index, representing the difference between the
280
normalized mean winter air pressure at sea level between Lisbon, Portugal (Azores High), and
281
Stykkisholmur, Iceland (Icelandic Low) [39]. e) ISM, NAO and the percentage of Shamal conditions
282
in Qatar averaged over the time windows of the multitemporal satellite and aerial image analysis of
283
barchan dune migration. These data are displayed in combination with migration rates of barchan
284
286
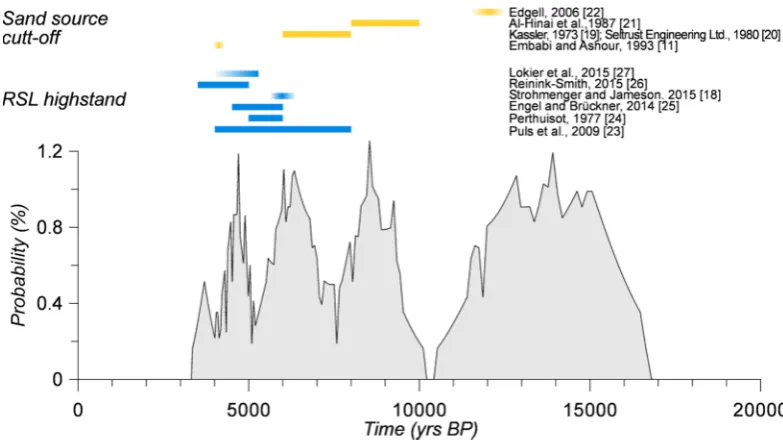
Figure 8. Probability density function of travel times of the 15 barchan dunes (width 100–500m) of
287
SE Qatar in closest proximity to the NW coast (Figure 1a). Data are displayed in combination with
288
chronological estimates of the relative sea-level (RSL) highstand (blue bars) and the loss of the sand
289
source (yellow bars) as inferred from literature.
290
Due to the large size-dependent differences in migration rates of the most NW dunes, the PDF
291
of inferred travel times shows a very broad distribution ranging from c. 3300 to 17,000 yrs BP. Neither
292
does this result conflict with any of the chronological estimates for the mid-Holocene RSL highstand
293
and the loss of the sediment source (Figure 8), nor, unfortunately, does it add more precision to the
294
debate. It can be stated, however, that the loss of the sand source associated with the transgression of
295
the Gulf is to be chronologically located near the younger end of the PDF distribution, most likely
296
between 8000–6000 yrs. BP, as estimated by Kassler [19] and Seltrust Engineering Ltd. [20]. Taking
297
into account the range of estimates for the mid-Holocene RSL highstand with the highest overlap
298
between the different sources (c. 6000–4000 yrs. BP, Figure 8), the estimates of 10,000–8000 yrs. BP
299
[21] and 12,000 yrs. BP [22] are too early, as much of the very shallow wider Bahrain Ridge area was
300
definitely still exposed. The estimate of 4100 yrs. BP [11], however, is too young, as it post-dates the
301
vast majority of known index points of the RSL highstand along the southern coast of the Arabian
302
Gulf [18,25,27]. Inferences from the analysis of Embabi and Ashour [11] might have been biased by
303
the very short time windows of available imagery and the overrepresentation of very small barchans.
304
6. Conclusions
305
The Shamal wind system is the main driver of barchan dune migration in Qatar. The distribution
306
of the remaining major barchan dune population in the SE of the peninsula in combination with the
307
strongly size-dependent migration rates inferred from multitemporal satellite and aerial image
308
analysis support the hypothesis of a RSL-controlled sediment supply. Due to large uncertainties
309
associated with extrapolation of migration rates into millennial time scales, however, no further
310
chronological constraints can be made regarding the loss of the sand source.
311
It is shown that the barchan-moving Shamal correlates with two major modules of the global
312
atmospheric circulation, i.e. the North Atlantic Oscillation (NAO) and the Indian Summer Monsoon
313
(ISM). Both systems, though fluctuating, were clearly established over Holocene time scales [45,46],
314
and so was the Shamal [47].
315
The correlation between Shamal activity and the velocity of barchan dunes comes to an abrupt
316
end after the onset of sand mining in the core study area after 2006. We hypothesize that excessive
317
truck traffic upwind and sand loading at the mined barchan dunes strongly increased sand flux and,
318
with the dynamics of dune systems. According to past and present migration rates, the iconic barchan
320
dune landscape of Qatar will still be present for centuries, even if not millennia. However, it seems
321
that the size of this important geo-heritage will shrink much faster due to human activity – directly
322
through sand mining, and indirectly through strongly increased migration rates leading to faster
323
calving into the shallow waters off the SE coast of Qatar, where the sand feeds the extensive Umm
324
Said coastal sabkha system.
325
Acknowledgments: Funding of fieldwork – conducted in the framework of the South Qatar Survey Project
326
(SQSP) (https://fallback.dainst.org/projekt/-/project-display/612902) – and logistic support by Qatar Museums
327
(QM) and the Orient Department of the German Archaeological Institute (DAI) is gratefully acknowledged.
328
Permissions for the field survey were issued by QM. Gambit, Hexagon, IKONOS and aerial ortho-imagery were
329
kindly provided by QM, DAI and the Qatar National Historic Environment Record Project (QNHER). Additional
330
funding of personnel costs and commercial satellite imagery was provided through a Max Delbrück Prize, junior
331
category (Zukunftskonzept Universität zu Köln, DFG ZUK 81/1), awarded to M.E.
332
Author Contributions: M.E. conceived and designed the study; F.B. performed the investigations on satellite
333
imagery; all authors analyzed the data; M.E. wrote the manuscript; all authors commented on and approved the
334
manuscript.
335
Conflicts of Interest: The authors declare no conflict of interest.
336
References
337
1. Besler, H. Eine Wanderdüne als Soliton? Phys. Bl. 1997, 53, 983–985, DOI:10.1002/phbl.19970531009.
338
2. Livingstone, I.; Wiggs, G.F.S.; Weaver, C.M. Geomorphology of desert sand dunes: A review of recent
339
progress. Earth Sci. Rev. 2007, 80, 239–257, DOI:10.1016/j.earscirev.2006.09.004.
340
3. Parteli, E.J.R.; Durán, O.; Herrmann, H.J. Minimal size of a barchan dune. Phys. Rev. E 2007, 75, 011301,
341
DOI:10.1103/PhysRevE.75.011301.
342
4. Wiggs, G.F.S. Dune morphology and dynamics. In Treatise in Geomorphology, Vol. 11: Aeolian Geomorphology;
343
Lancaster, N., Sherman, D.J., Baas, A.C.W., Eds.; Academic Press, London, UK, 2013; pp. 201–218,
344
DOI:10.1016/B978-0-12-374739-6.00304-3.
345
5. Hesp, P.A.; Hastings, K. Width, height and slope relationships and aerodynamic maintenance of barchans.
346
Geomorphology1998, 22, 193–204, DOI:10.1016/S0169-555X(97)00070-6.
347
6. Vermeesch, P.; Leprince, S. A 45-year time series of dune mobility indicating constant windiness over the
348
central Sahara. Geophys. Res. Lett. 2012, 39, L14401, DOI:10.1029/2012GL052592.
349
7. Bagnold, R.A. The Physics of Blown Sand and Desert Dunes. Methuen, London, UK, 1941.
350
8. Bubenzer, O.; Besler, H. Sands as Archives of Environmental Change: Examples from Egypt, Sudan and
351
Namibia. In Towards Interdisciplinarity – Experiences of the Long-term ACACIA Project; Möhlig, W.J.G.,
352
Bubenzer, O., Menz, G., Eds.; Rüdiger Köppe Verlag, Cologne, Germany, 2010; pp. 23–48
353
9. Farr, T.G.; Rosen, P.A.; Caro, E.; Crippen, R.; Duren, R.; Hensley, S.; Kobrick, M.; Paller, M.; Rodriguez, E.;
354
Roth, L.; Seal, D.; Shaffer, S.; Shimada, J.; Umland, J.; Werner, M.; Oskin, M.; Burbank, D.; Alsdorf, D. The
355
Shuttle Radar Topography Mission. Rev. Geophys. 2007, 45, RG2004, DOI:10.1029/2005RG000183.
356
10. Weatherall, P.; Marks, K.M.; Jakobsson, M.; Schmitt, T.; Tani, S.; Arndt, J.E.; Rovere, M.; Chayes, D.; Ferrini,
357
V.; Wigley, R. A new digital bathymetric model of the world’s oceans. Earth Space Sci. 2015, 2, 331–345,
358
DOI:10.1002/2015EA000107.
359
11. Embabi, N.S.; Ashour, M.M. Barchan dunes in Qatar. J. Arid Environ. 1993, 25, 49–69,
360
DOI:10.1006/jare.1993.1042.
361
12. NCDC (National Climate Data Center). NOAA NCDC Climate Data Online. URL:
362
https://www7.ncdc.noaa.gov/CDO/, last access: 12 Nov 2017.
363
13. Anderson, R.S. The attraction of sand dunes. Nature1996, 379, 24–25, DOI:10.1038/379024a0.
364
14. Hersen, P.; Andersen, K.H.; Elbelrhiti, H.; Andreotti, B.; Claudin, P.; Douady, S. Corridors of barchan
365
dunes: stability and size selection. Phys. Rev. E2004, 69, 011304, DOI:10.1103/PhysRevE.69.011304.
366
15. Hesse, R. Do swarms of migrating barchan dunes record paleoenvironmental changes? — A case study
367
spanning the middle to late Holocene in the Pampa de Jaguay, southern Peru. Geomorphology 2009, 104,
368
16. Shinn, E.A. Carbonate coastal accretion in the area of longshore transport, NE Qatar. In The Persian Gulf:
370
Holocene Carbonate Sedimentation and Diagenesis in a Shallow Epicontinental Sea; Purser, B.H., Ed.; Springer,
371
Berlin, Germany, 1973; pp. 179–191, DOI:10.1007/978-3-642-65545-6_10.
372
17. Glennie, K.W.; Singhvi, A.K. Event stratigraphy, paleoenvironment and chronology of SE Arabian deserts.
373
Quat. Sci. Rev. 2002, 21, 853–869. DOI:10.1016/S0277-3791(01)00133-0.
374
18. Strohmenger, C.J.; Jameson, J. Modern coastal systems of Qatar as analogues for arid climate carbonate
375
reservoirs: improving geological and reservoir modelling. First Break2015, 33, 41–50,
DOI:10.3997/1365-376
2397.2014027.
377
19. Kassler, P. The structural and geomorphic evolution of the Persian Gulf. In The Persian Gulf: Holocene
378
Carbonate Sedimentation and Diagenesis in a Shallow Epicontinental Sea; Purser, B.H., Ed.;Springer, Berlin,
379
Germany, 1973; pp. 11–32, DOI: 10.1007/978-3-642-65545-6_2.
380
20. Seltrust Engineering Ltd. Qatar Geological Map, scales 1:100,000 (four sheets) and 1:200,000 (one sheet) and
381
explanatory booklet. IDTC., Doha, Qatar, 1980; 20 p.
382
21. Al-Hinai, K.G.; McMahon Moore, J.; Bush, P.R. LANDSAT image enhancement study of possible
383
submerged sand-dunes in the Arabian Gulf. Int. J. Remote Sens. 1987, 8, 251–258,
384
DOI:10.1080/01431168708948639.
385
22. Edgell, H.S. Arabian Deserts – Nature, Origin, and Evolution. Springer: Dordrecht, The Netherlands, 2006; pp.
386
187–188, DOI:10.1007/1-4020-3970-0.
387
23. Puls, D.D.; Jameson, J.; Kozar, M.; Al-Ansi, H.; LeBlanc, J. The Dukhan Sabkha: A Modern Analog for the
388
Arab C Carbonate Reservoir, Dukhan Field, Qatar. In Proceedings of the International Petroleum
389
Technology Conference, Doha, Qatar, 7–9 December 2009, Vol. 3; pp. 1799–1811,
DOI:10.2523/IPTC-13629-390
MS.
391
24. Perthuisot, J.P. Contribution a l'étude du Quaternaire marin de la péninsule de Qatar. Bull. Soc. Géol. France
392
1977, S7-XIX, 1167–1170, DOI:10.2113/gssgfbull.S7-XIX.5.1167.
393
25. Engel, M.; Brückner, H. The South Qatar Survey Project (SQSP) – Preliminary findings on Holocene coastal
394
changes and geoarchaeological archives. Z. Orient Archäol.2014, 7, 290–301.
395
26. Reinink-Smith, L.M. AMS-dated mollusks in beach ridges and berms document Holocene sea-level and
396
coastal changes in northeastern Kuwait Bay. Quat. Res. 2015, 87, 200–213, DOI:10.1016/j.yqres.2015.06.005.
397
27. Lokier, S.W.; Bateman, M.D.; Larkin, N.R.; Rye, P.; Stewart, J.R. Late Quaternary sea-level changes of the
398
Persian Gulf. Quat. Res. 2015, 84, 69–81, DOI: 10.1016/j.yqres.2015.04.007.
399
28. Sadiq, A.; Hoqari, F. Remote sensing and spectral characteristics of desert sand from Qatar Peninsula,
400
Arabian/Persian Gulf. Remote Sens. 2009, 1, 915–933, DOI:10.3390/rs1040915.
401
29. Al-Yousef, M. Mineralogy, Geochemistry and the origin of Quaternary sabkhas in the Qatar Peninsula,
402
Arabian Gulf. PhD thesis, Faculty of Earth Sciences, University of Southampton, 2003.
403
30. Al-Saad, H. Lithostratigraphy of the Middle Eocene Dammam Formation in Qatar, Arabian Gulf: Effects of
404
sea-level fluctuations along a tidal environment. J. Asian Earth Sci. 2005, 25, 781–789,
405
DOI:10.1016/j.jseaes.2004.07.009.
406
31. Rao, P.G.; Al-Sulaiti, M.; Al-Mulla, A.H. Winter shamals in Qatar, Arabian Gulf. Weather2001, 56, 444–451,
407
DOI:10.1002/j.1477-8696.2001.tb06528.x
408
32. Rao, P.G.; Hatwar, H.R.; Al-Sulaiti, M.H.; Al-Mulla, A.H. Summer shamals over the Arabian Gulf. Weather
409
2003, 58, 471–478, DOI:10.1002/wea.6080581207.
410
33. Bartlett, K.S. Dust Storm Forecasting for Al Udeid AB, Qatar: An Empirical Analysis. MSc thesis, Air
411
University, Ohio, 2004.
412
34. Barth, H.-J. Characteristics of the wind regime north of Jubail, Saudi Arabia, based on high resolution wind
413
data. J. Arid Environ. 2001, 47, 387–402, DOI:10.1006/jare.2000.0668.
414
35. Yu, Y.; Notaro, M.; Kalashnikova, O.V.; Garay, M.J. Climatology of summer Shamal wind in the Middle
415
East. J. Geophys. Res.-Atmos. 2016, 121, 289–305, DOI:10.1002/2015JD024063.
416
36. Al Senafi, F.; Anis, A. Shamals and climate variability in the Northern Arabian/Persian Gulf from 1973 to
417
2012. Int. J. Climatol. 2015, 35, 4509–4528, DOI:10.1002/joc.4302.
418
37. Breed, C.S.; Grow, T., 1979. Morphology and distribution of dunes in sand seas observed by remote sensing.
419
In: McKee, E.D. (ed.), A study of global sand seas. Geol. Surv. Prof. Paper1979, 1052, 253–304.
420
38. Wang, B.; Fan, Z. Choice of South Asian Summer Monsoon Indices. Bull. Amer. Meteor. Soc. 1999, 80, 629–
421
39. NWS (National Weather Service). North Atlantic Oscillation (NAO). URL:
423
http://www.cpc.ncep.noaa.gov/data/teledoc/nao.shtml, last access 16 April 2018.
424
40. Middleton, N.J. A geography of dust storms in Southwest Asia, Int. J. Climatol. 1986, 6, 183–196,
425
DOI:10.1002/joc.3370060207.
426
41. Ben-Gai, T.; Bitan, A.; Manes, A.; Alpert, P.; Kushnir, Y. Temperature and surface pressure anomalies in
427
Israel and the North Atlantic Oscillation. Theor. Appl. Climatol. 2001, 69, 171–177,
428
DOI:10.1007/s007040170023.
429
42. Saeed, S.; Müller, W.A.; Hagemann, S.; Jacob, D. Circumglobal wave train and the summer monsoon over
430
northwestern India and Pakistan: the explicit role of the surface heat low. Clim. Dyn. 2011, 37, 1045–1060,
431
DOI:10.1007/s00382-010-0888-x.
432
43. Hamidi, M.; Kavianpour, M.R.; Shao, Y. Synoptic analysis of dust storms in the Middle East. Asia-Pacific J.
433
Atmos. Sci. 2013, 49, 279–286, DOI:10.1007/s13143-013-0027-9.
434
44. Bansod, S.D.; Singh, S.V. Pre-monsoon surface pressure and summer monsoon rainfall over India. Theor.
435
Appl. Climatol. 1995, 51, 59–66, DOI:10.1007/BF00865540.
436
45. Rimbu, N.; Lohmann, G.; Kim, J.-H.; Arz, H.W.; Schneider, R. Arctic/North Atlantic Oscillation signature
437
in Holocene sea surface temperature trends as obtained from alkenone data, Geophys. Res. Lett. 2003, 30,
438
1280, DOI:10.1029/2002GL016570.
439
46. Fleitmann, D.; Burns, S.J.; Mangini, A.; Mudelsee, M.; Kramers, J.; Villa, I.; Neff, U.; Al-Subbary, A.A.;
440
Buettner, A.; Hippler, D.; Matter, A. Holocene ITCZ and Indian monsoon dynamics recorded in stalagmites
441
from Oman and Yemen (Socotra). Quat. Sci. Rev. 2007, 26, 170–188, DOI:10.1016/j.quascirev.2006.04.012.
442
47. Glennie, K.W.; Singhvi, A.K. Event stratigraphy, paleoenvironment and chronology of SE Arabian deserts.
443
Quat. Sci. Rev. 2002, 21, 853–869. DOI:10.1016/S0277-3791(01)00133-0.
444
48. Parker, A.G.; Goudie, A.S. Geomorphological and palaeoenvironmental investigations in the southeastern
445
Arabian Gulf region and the implication for the archaeology of the region. Geomorphology2008, 101, 458–
446
470, DOI:10.1016/j.geomorph.2007.04.028.
447
49. Engel, M.; Brückner, H.; Pint, A.; Wellbrock, K.; Ginau, A.; Voss, P.; Grottker, M.; Klasen, N.; Frenzel, P.
448
The early Holocene humid period in NW Saudi Arabia — sediments, microfossils and palaeohydrological
449
modelling. Quat. Int. 2012, 266, 131–141, DOI:10.1016/j.quaint.2011.04.028.
450
50. Matter, A.; Neubert, E.; Preusser, F.; Rosenberg, T.; Al-Wagdani, K. Palaeo-environmental implications
451
derived from lake and sabkha deposits of the southern Rub'al-Khali, Saudi Arabia and Oman. Quat. Int.
452
2015, 382, 120–131, DOI:10.1016/j.quaint.2014.12.029.
453
51. Lancaster, N.; Baas, A. Influence of vegetation cover on sand transport by wind: field studies at Owens
454
Lake, California. Earth Surf. Process. Landforms 1998, 23, 69–82,
DOI:10.1002/(SICI)1096-455
9837(199801)23:1<69::AID-ESP823>3.0.CO;2-G.
456
52. Thomas, D.S.G.; Knight, M.; Wiggs, G.F.S. Remobilization of southern African desert dune systems by
457
twenty-first century global warming. Nature2005, 435, 1218–1221, DOI:10.1038/nature03717.
458
53. Yizhaq, H.; Ashkenazy, Y.; Tsoar, H. Sand dune dynamics and climate change: A modeling approach. J.
459
Geophys. Res.2009, 114, F01023, DOI:10.1029/2008JF001138.
460
54. Gillette D.A.; Adams J. Accelerated Wind Erosion and Prediction of Rates. In Environmental Effects of
Off-461
Road Vehicles; Webb, R.H., Wilshire H.G., Eds; Springer, New York, USA, 1983; pp. 97–111,
![Figure 1. a) Overview of the Qatar peninsula based on SRTM30 data [9] and the GEBCO_2014 grid [10] showing the location of the distribution of aeolian surface deposits, the core study area within the barchan dune fields, the associated downwind Umm Said sa](https://thumb-us.123doks.com/thumbv2/123dok_us/7924744.1315832/2.595.129.458.167.670/figure-overview-peninsula-location-distribution-deposits-associated-downwind.webp)
![Figure 2. Monthly distribution of mean wind speed, general percentage of hours of wind speed >13 km h-1, and percentage of hours of wind speed >13 km h-1 within the Shamal corridor (290°-010° deviation from N) at Doha International Airport [12], the longes](https://thumb-us.123doks.com/thumbv2/123dok_us/7924744.1315832/3.595.172.428.79.251/monthly-distribution-percentage-percentage-corridor-deviation-international-airport.webp)
![Figure 7. a) Index of Indian Summer Monsoon (ISM) intensity between June and August after Wang and Fan [38]](https://thumb-us.123doks.com/thumbv2/123dok_us/7924744.1315832/10.595.79.515.79.637/figure-index-indian-summer-monsoon-intensity-june-august.webp)