Available Online atwww.ijcsmc.com
International Journal of Computer Science and Mobile Computing
A Monthly Journal of Computer Science and Information Technology
ISSN 2320–088X
IJCSMC, Vol. 4, Issue. 6, June 2015, pg.901 – 906
RESEARCH ARTICLE
Mining of High Dimensional Data
using Feature Selection
Harshali D. Gangurde
1, Dr. K. V. Metre
2¹
Department of Computer Engineering, MET‟s IOE-BKC, Nasik, India²
Department of Computer Engineering, MET‟s IOE-BKC, Nasik, IndiaAbstract— Data mining techniques have been far and wide useful to extract knowledge from large databases. Data mining searches for associations and worldwide patterns that exist in large databases that are hidden among the high dimensional data. Feature selection involves selecting the most useful features from the given data set and reduces dimensionality. Graph clustering method is used for feature selection. Features which are most relevant to the target class and independent of other are selected from the cluster. The features selected from the cluster are given to the classifiers to increase the learning accuracy and achieve best feature subset. The feature selection can be competent and effectual using clustering approach considering time and quality of data respectively.
Keywords— Feature selection, minimum spanning tree, clustering, Classification.
I. INTRODUCTION
Feature selection is a term that is used in data mining to resolve the tools and techniques available for reducing data as input for processing and analysis so that it can be managed. Clustering analysis is the task of grouping of objects (data) with similar features or attributes. Many feature selection methods are there like the Embedded, Wrapper, Filter and Hybrid to choose good subset of features.
Harshali D. Gangurde et al, International Journal of Computer Science and Mobile Computing, Vol.4 Issue.6, June- 2015, pg. 901-906
classes are preferred from each cluster .The clustering-based tactic gives best subset of features which are constructive and self-sufficient The classifiers used are KNN, ANN, SVM and ensemble increase the learning accuracy of the classification process. The Ensemble method: Bagging is applied to get the best feature subset by selecting the features getting the maximum vote relevant to the target class. KNN is based on the principle that features within a dataset will generally exist in close proximity to the other features having similar properties. The classification speed by ANN is rather fast. Moreover, ANNs can handle redundant features and are able to deal with discrete, binary and continuous attributes. The goal of an SVM is to minimize an upper bound on its expected classification error. SVMs seek the optimal separating hyper plane between two classes by maximizing the margin between the classes and the maximum margin hyper plane is able to classify data that are may be with some exceptions linearly separable.
II. LITERATURE SURVEY
Feature selection identifies and eliminates as many inappropriate and surplus features. Out of many existing feature selection algorithms, some can abolish irrelevant features but are incompetent to handle redundant features [1] [2][3][4][5][6], but still some algorithms can eliminate the irrelevant while capably handling the redundant features [5][7][8][9]. Relief is an algorithm, which gives weight to each feature according to its capability to make a difference between features under different targets based on distance-based criterion function [4]. Relief is not capable in removing redundant features as two projecting highly correlated and weighted features [10]. Relief is an easy to employ, rapid and precise algorithm even with dependent features and noisy data. Relief works by measuring the capacity of a feature in sorting out similar features. Relief-F (RFF) is an expansion to relief algorithms which deals with multi-class problems and absent value. It is also superior to deal with noisy data and can be used for regression problems [3]. CFS,FCBF and CMIM are examples that take into postulation that along with irrelevant and redundant features also affect the accuracy & speed of learning algorithms, so they should be not there.[7][9][10] [11][2].
CFS is achieved by the deduction that a good feature subset is one that contains features highly allied with the target class but not interrelated with each other [7]. FCBF is a fast content based filter method which can identify relevant and redundant features, among relevant features without pair wise correlation study ([13] [14]). CMIM iteratively picks features which take full advantage of their mutual information with the class to foretell, conditionally to the response of any feature already selected [12]. Unlike from these algorithms, our anticipated algorithm employs clustering based method to select features. Recently, hierarchical clustering has been adopted in word selection in the perspective of text classification ([13], [15], and [16]). Distributional clustering cluster words into groups based on their grammatical associations with other words [13]. The Support Vector Machine (SVM) was originally designed for binary classification problems [18]. SVMs give superior results for text classification. The SVM is clear over a vector space where the classification problem is to find the decision surface that best separates the data points of one class from the other. In case of linearly separable data, the decision surface is a hyperplane that maximizes the margin between the two classes.Ensemble methods collect the predictions of multiple classifiers into a single learning model [19]. Several classifier models (called” or” learners) are trained and their results are usually summed up through a voting or averaging process. The most important idea of bagging (short for bootstrap aggregating) is to sum up predictions of several models of a given weak learner fitted to bootstrap samples of the original dataset by a bulk vote. Some main return of bagging are its ability to reduce variance and to avoid model -over-fitting. [20].
III. PROPOSED SYSTEM
The proposed system is as follows - 1. Removal of irrelevant features.
2.Removing of redundant feature by constructing MST and selecting representatives from clusters relevant to target class.
3. The representative feature selected from the clusters is given to the classifiers for classification. The classifiers used are: ANN, SVM. KNN and Ensemble method: Bagging.
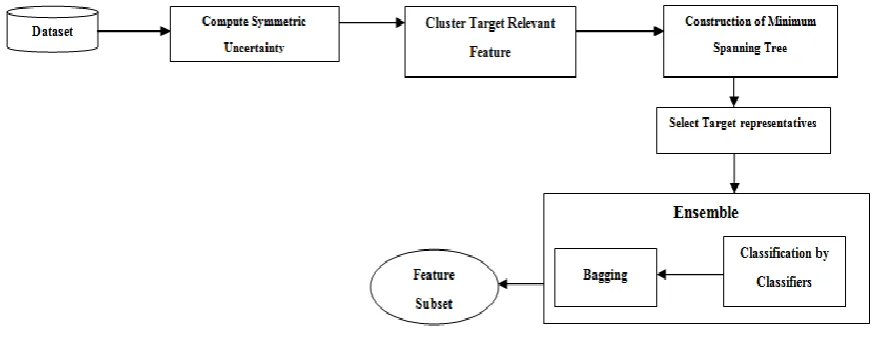
Fig. 1: System Architecture
The Symmetric Uncertainty computed is the co-relational measure between features and the target class. The target relevant features are selected from high dimensional data to form clusters thus eliminating the irrelevant features. The formation of MST removes the redundant features. The target representative features having maximum relevance to the target class are selected as feature subset. The subset formed is given to the classifiers to increase the learning accuracy and to obtained best feature subset with reduced dimensionality from the high dimensional data.
IV.IMPLEMENTATION DETAILS
A. Symmetric Uncertainty
Symmetrical uncertainty measure is a normalization of mutual information. Symmetric Uncertainty has been used to resolve the righteousness of features for classification. The symmetric uncertainty is measured as follows:-
SU (a, b) = 2 *Gain (a|b) / H (a) + H (b) (1)
Here, H (a) and H(b) are the entropies of discrete random variables . A value 1 of SU (a, b) indicates that knowledge of the value of either one completely predicts the value of the other and the value 0 implies that „a‟ and „b‟ are independent.
B. Entropy, Gain and Conditional Entropy
H (a) i. e entropy is defined by p(a). Where the prior probabilities for all values of „A‟ p (a):-
-
H (a) = − Σa∈A p (a) log2 p(a) (2)
Gain (a|b) reflects the information about b provided by a. Gain is also called as information gain which is given by:-
Harshali D. Gangurde et al, International Journal of Computer Science and Mobile Computing, Vol.4 Issue.6, June- 2015, pg. 901-906
Entropy is also a symmetrical measure for information gain about the features. That is the amount of information gained about „a‟ after observing „b‟ is equal to the amount of information gained about „b‟ after observing „a‟. The order of two variables will not affect the value of entropy
.
C. . Algorithmic Strategy
1. Compute the Target-Relevance value for each feature. The features whose SU values with high opinion to target class are larger than a predefined threshold θ comprise the target-relevant feature subset.
2. Calculate the Feature-Correlation i.e SU (Fa, Fb) value for each pair of features Fa and Fb. The Feature
Correlation SU (Fa, Fb) is the weight of edges.
3. Build a minimum spanning tree(MST) using Prim‟s , then remove the edges whose weights are not as much of that both of the Target-Relevance SU of Fa and Fb from the MST.
4. Check for redundant features in MST by the property that for each pair of nodes SU (Fa, Fb), SU (Fa, Fb) ≥
SU (Fa,C) ∧ SU (Fa, Fb) ≥ SU (Fa, Fb).
5. A forest is obtained after the exclusion of unwanted edges. Each tree T∈ Forest represents a cluster.
6. From each cluster we prefer a representative feature whose Target-Relevance is the greatest.
7. The strong Target Relevance features selected from the clusters forms feature subset.
8. The feature subset obtained is given to the classifiers to increase their learning accuracy for classification purpose.
V. Experimental setup & result analysis
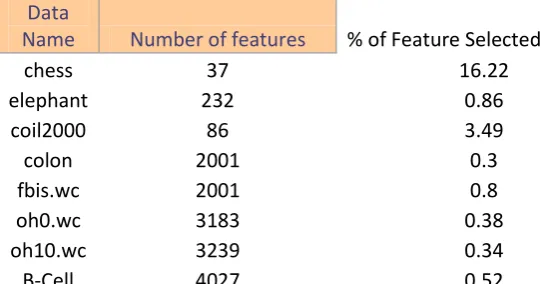
The projected system is tested on different high dimensional microarray and text dataset. The system works by taking input as one of the given datasets. The selected dataset is processed under proposed algorithmic strategy and the results obtained are the selected number of features relevant to target class. The following Fig 2. and Fig 3 gives brief overview of the reduced dimensionality of the dataset as compared to the original number of features in percentage.
Data
Name
Number of features
% of Feature Selected
chess
37
16.22
elephant
232
0.86
coil2000
86
3.49
colon
2001
0.3
fbis.wc
2001
0.8
oh0.wc
3183
0.38
oh10.wc
3239
0.34
B-Cell
4027
0.52
Fig 3.Graphical Representation of Features selected.
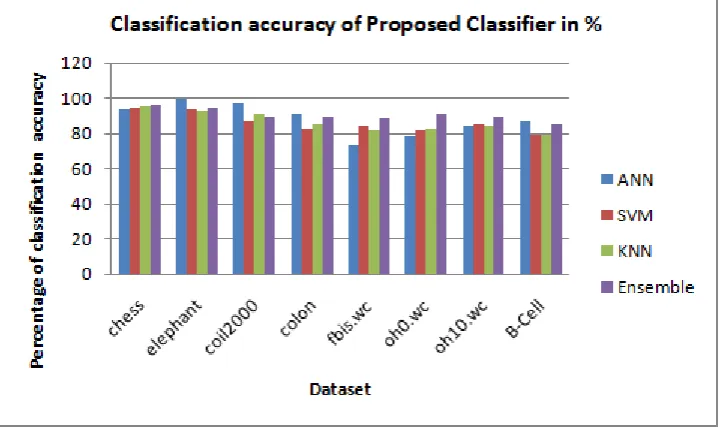
The selected features are trained under different learning algorithms or classifiers to increase the learning accuracy of the selected high dimensional datasets. The training time needed by the classifiers is represented by graph for each classifier.
Fig 4. Classification accuracy of different classifiers in percentage.
Harshali D. Gangurde et al, International Journal of Computer Science and Mobile Computing, Vol.4 Issue.6, June- 2015, pg. 901-906
REFERENCES
[1] Forman G., “An extensive empirical study of feature selection metrics for text classification”, Journal of Machine Learning Research, 3, pp 1289-1305,2003"..
[2] Hall M.A., “Correlation-Based Feature Selection for Discrete and Numeric Class Machine Learning”
Proceedings of 17th International Conference on Machine Learning, pp 359-366, 2000.
[3]Kononenko -I.,Estimating Attributes. “Analysis and Extensions of RELIEF”, Proceedings of the 1994
European Conference on Machine Learning, pp 171-182, 1994.,
[4] Kira K. and Rendell L.A., “The feature selection problem: Traditional methods and a new algorithm”,
Proceedings of Ninth National Conference on ArtificialIntelligence, pp 129-134, 1992.
[5] Modrzejewski M., “Feature selection using rough sets theory”, Proceedings of the European Conference on Machine Learning, pp 213-226, 1993.
[6] Scherf M. and Brauer W., “Feature Selection By Means of a Feature Weighting Approach” Technical Report FKI-221 97, Institut fur Informatik, Technische Universitat Munchen, 1997.
[7] Hall M.A.,” Correlation-Based Feature Subset Selection for Machine Learning” Ph.D. dissertation Waikato, New Zealand: Univ. Waikato, 1999.
[8] Liu H. and Setiono R., “A Probabilistic Approach to Feature Selection: A Filter Solution” Proceedings of the 13th International Conference on Machine Learning, pp 319-327, 1996.
[9] Yu L. and Liu H.,.,” Feature selection for high dimensional data: a fast correlation based filter solution”
Proceedings of 20 th International Conference on Ma-chine Leaning, 20(2), pp 856-863, 2003.
[10] Koller D. and Sahami M.., “Toward optimal feature selection” Proceedings of International Conference on Machine Learning, pp 284-292, 1996
[11] Kohavi R. and John G.H., “Wrappers for feature subset selection” PArtif. Intell., 97(1-2), pp 273-324, 1999.
[12] Fleuret F., “Fast binary feature selection with conditional mutual Information”.Journal of Machine Learning Research, 5, pp 1531-1555, 2004.
[13] Pereira F.Tishby N. and Lee L., “Distributional c-lustering of English Words” Proceedings of the 31st Annual Meeting on Association For Computational Linguistics, pp 183-190, 1993.
[14] Dash M., Liu H. and Motoda H ., “Consistency based feature Selection” Proceedings of the Fourth Paci_c Asia Conference on Knowledge Discovery and Data Mining, pp 98-109, 2000
[15] Das S., “Filters, wrappers and a boosting-based hybrid for feature Selection” Proceedings of the Eighteenth International Conference on Machine Learning, pp 74-81, 2001
[16] Dash M. and Liu H., “Consistency-based search in feature selection” Artificial Intelligence, 151(1-2), pp 155-176, 2003*
[17] Butterworth R., Piatetsky-Shapiro G. and Simovici D.A., “On Feature Selection through Clustering”
Proceedings of the Fifth IEEE internationalConference on Data Mining, pp 581-584, 2005.
[18] Minh Hoai Nguyen, Fernandodela Torre., “ Optimal feature selection for support vector machines”
Elsevier,P attern Recognition, pp 584591,2010
[19] Alexey Tsymbal, Pdraig Cunningham, Mykola Pechenizkiy,Seppo Puuronen.,”Search Strategies for Ensemble Feature Selection in Medical Diagnostics” Department of Computer Science, Trinity College Dublin, Ireland.
[20] Yi-Wei Chen and ChihJen Lin., “Combining SVMs with Various Feature Selection Strategies”,