Scholarship@Western
Scholarship@Western
Electronic Thesis and Dissertation Repository
12-1-2016 12:00 AM
Development and Optimization of 19F-MRI for Tracking Cellular
Development and Optimization of 19F-MRI for Tracking Cellular
Therapeutics
Therapeutics
Jeffrey M. GaudetThe University of Western Ontario Supervisor
Paula J. Foster
The University of Western Ontario
Graduate Program in Medical Biophysics
A thesis submitted in partial fulfillment of the requirements for the degree in Doctor of Philosophy
© Jeffrey M. Gaudet 2016
Follow this and additional works at: https://ir.lib.uwo.ca/etd
Part of the Other Analytical, Diagnostic and Therapeutic Techniques and Equipment Commons
Recommended Citation Recommended Citation
Gaudet, Jeffrey M., "Development and Optimization of 19F-MRI for Tracking Cellular Therapeutics" (2016). Electronic Thesis and Dissertation Repository. 4250.
https://ir.lib.uwo.ca/etd/4250
This Dissertation/Thesis is brought to you for free and open access by Scholarship@Western. It has been accepted for inclusion in Electronic Thesis and Dissertation Repository by an authorized administrator of
i
Abstract
Introduction: This thesis aims to advance magnetic resonance imaging (MRI) for imaging cellular therapeutics. Traditional, proton-based, MRI provides detailed anatomical images, particularly of soft tissue. However, in order to obtain information at a cellular level specialized imaging agents are required to detect the cells of interest. Perfluorocarbons containing non-radioactive fluorine-19 (19F) are both biologically safe and MR sensitive. Methods: Pre-clinical 19F-MRI was implemented on a Varian 9.4T MRI scanner, using a dual 19F/1H-tuned birdcage volume coil. Mesenchymal stromal cells (MSC) were pre-labeled with a commercial, FDA approved 19F-perfluorocarbon emulsion, then implanted intramuscularly into the mouse hindlimb. To track the inflammation resulting from transplantation, a dual-agent cellular MRI technique was developed. This technique utilizes 19F to track MSC and superparamagnetic iron oxide nanoparticles (SPIO) to image
macrophages, through signal quenching. A clinical imaging protocol was developed to translate 19F-MRI to a 3T GE MR750 scanner with a dual 19F/1H-tuned surface coil. Peripheral blood mononuclear cells (PBMC) were labeled with a FDA-approved 19F-agent and injected into a ham shank phantom for protocol optimization. Results: The balanced steady-state free precession pulse sequence was chosen for all studies due to the high signal-to-noise per unit time. Image acquisition was optimized for 19F detection sensitivity, accuracy of quantification, and compatibility with isoflurane. In vivo quantification of MSC on the day of implantation was in strong agreement with the expected number of cells. The change in 19F-signal was quantified over time and compared between two murine transplantation models. When iron oxide was administered i.v., the migration of immune cells could be tracked to the injection site. The presence of SPIO decreased both the 1H and 19F signal, indicating that transplant rejection was occurring. On a clinical system, as few as
ii
Keywords
iii
Co-Authorship Statement
Chapter 1 contains material from 2 previously published review papers. AV Makela*, DH Murrell*, KM Parkins, J Kara, JM Gaudet and PJ Foster (2016) Cellular Imaging with MRI published in Topics in Magnetic Resonance Imaging, 25(5): 177-186. AVM, DHM, KMP, JK, JMG, PJF contributed to drafting of the manuscript. AVM, DHM, and PJF edited the manuscript. The second review, MS Fox, JM Gaudet and PJ Foster (2015) Fluorine-19 MRI Contrast Agents for Cell Tracking and Lung Imaging published in Magnetic Resonance Insight 8(S1):1-15. MSF drafted the manuscript with JMG and PJF contributing sections. MSF, JMG, and PJF edited the manuscript.
Chapter 2 contains previously unpublished data. JM Gaudet participated in experimental design, data collection and analysis and drafted the chapter. PJ Foster contributed to experimental design and chapter editing.
Chapter 3 is reprinted from: JM Gaudet, EJ Ribot, Y Chen, KM Gilbert, and PJ Foster (2015) Mesenchymal stem cell transplant rejection monitored with 19F-MRI published in PLoS ONE 10(3): e0118544. JMG participated in experimental design, data collection and analysis, and drafted the manuscript. YC performed cell culture, histology and immunohistochemistry. KMG designed and manufactured hardware for the study. EJR and PJF contributed to experimental design and manuscript preparation.
Chapter 4 is reprinted from: JM Gaudet, A Hamilton, Y Chen, MS Fox, and PJ Foster (2016) Application of dual 19F and iron cellular MRI agents to track the infiltration of immune cells to a site of a rejected stem cell transplant published in Journal of Magnetic Resonance in Medicine, Early view. JMG participated in experimental design, data collection and analysis, and drafted the manuscript. AH performed cell culture. AH and YC performed histology and immunohistochemistry. MSF and PJF contributed to experimental design and manuscript preparation.
iv
and data analysis, participated in study design, and drafted the manuscript. CF & MS performed all cell work, safety testing, and animal handling. JMG performed all 9.4T imaging, and along with MSF developed 3T imaging protocols. SB, SV, JC, PJF, and GAD contributed to experimental design and writing the manuscript.
v
Acknowledgments
To my supervisor, Dr. Paula Foster, thank you for everything you’ve taught me and for making these last four years so enjoyable. Whether it was providing me opportunities to present around the world or introducing me to your peers, you’ve consistently gone above and beyond to mentor me. I can’t imagine a better supervisor.
I’d like to thank all the members, past and present, of the Foster lab for their help and
friendship over the past four years. I’d especially like to thank the post-doctoral fellows, Drs. Amanda Hamilton, Emeline Ribot, and Matthew Fox. Without their expertise and guidance fluorine-MRI wouldn’t be where it is today at Robarts.
To Dr. Donna Murrell - we started on the same day and went through each step of grad school together. It’s been amazing to always have someone to work through problems with and bounce ideas off of. From the late nights in the lab, to our conference adventures around the world, thank you for your exceptional friendship over all these years.
Whether its talking science in the lab or over a pitcher, or two; thank you Ashley Makela and Kate Parkins for all the great times. I look forwarding to seeing where you two bring the field of Cellular MRI in the next couple of years! The amazing figures used in publications and this thesis were produced by Chelsey Gareau, thanks for never hesitating to help make a figure perfect.
Special thanks to our close collaborators, Dr. Gregory Dekaban and (soon to be Dr.) Corby Fink for their help and advice. They are the driving force behind the clinical translation of fluorine MRI at Robarts. Without the extensive safety and cell biology validation performed by Corby Fink this work would never have been possible. Our collaboration allowed us to each specialize and focus on tackling important issues in the field of 19F-MRI.
vi
Thank you to Dr. Alex Li, Miranda Bellyou, and Joe Gati at the Robarts 9.4T MRI system for all their help and training. I’d also like to thank Kyle Gilbert for developing and maintaining the pre-clinical RF coils. It was amazing having your help to quickly troubleshoot the issues with.
To the Robarts 2nd imaging team, thank you Dr. Tim Scholl, Dr. John Ronald, David Reese and Trevor Szekeres for all your guidance. To Drs. Trevor Wade and Paco Martinez, thank you for always being available to help me with technical questions and troubleshoot the various error messages I caused.
To all my friends in the department, you’ve made this a great 4 years at Western. I’d
particularly like to thank - Justin Peterson, Colin McCurdy, Dr. Damien Pike, and the soon to be Drs., Tom Hrinivich, Patricia Johnson, and Jackie Harris; for their support, both on and off campus. Along with the help of Foster lab I can honestly say my liver will never be the same.
And last but certainly not least, to all my friends and family, thank you for supporting me over the years. To my parents - Sam Gaudet and Betty Wong, and brother - Greg Gaudet; thank you for always believing in my ambitions. Without your positive influence, I wouldn’t be where I am today. To my girlfriend, Bethany Jennings, thank you for all the
encouragement over the course of my graduate studies.
vii
Table of Contents
Abstract ... i
Co-Authorship Statement ... iii
Acknowledgments ... v
Table of Contents ... vii
List of Tables ... xi
List of Figures ... xii
List of Appendices ... xix
List of Abbreviations ... xx
Chapter 1 ... 1
1 Introduction* ... 1
1.1 Cellular Therapy ... 1
1.1.1 Regenerative Medicine ... 1
1.1.2 Immunotherapy ... 3
1.2 Magnetic Resonance Imaging ... 4
1.2.1 Nuclear Magnetic Resonance ... 5
1.2.2 Generating an Image ... 7
1.2.3 Balanced Steady-State Free Precession ... 8
1.2.4 Iron Oxide-Contrast Agents ... 10
1.3 Imaging Cellular Therapeutics ... 10
1.3.1 Cellular MRI ... 11
1.3.2 Labeling Therapeutic Cells for MRI ... 12
1.3.3 Imaging Inflammation ... 14
1.4 19F-MRI Cell Tracking ... 14
viii
1.5 Purpose of Thesis ... 18
1.5.1 Hypotheses ... 19
1.6 References ... 20
Chapter 2 ... 33
2 Optimization of Preclinical 19F-imaging Techniques ... 33
2.1 Equipment ... 33
2.2 MRI Acquisition Parameters ... 33
2.2.1 Pulse Sequence ... 33
2.2.2 19F Image Resolution ... 35
2.3 Quantification of Labeled Cells ... 36
2.3.1 Theory ... 36
2.3.2 Improving Quantification Accuracy ... 38
2.4 19F-Uptake ... 40
2.5 Anesthesia ... 41
2.6 Two-colour 19F-MRI ... 42
2.7 Common Artifacts ... 43
2.8 References ... 44
Chapter 3 ... 49
3 Tracking the Fate of Stem cell Implants with Fluorine-19 MRI† ... 49
3.1 Introduction ... 49
3.2 Methods... 50
3.2.1 MSC Culture and Labeling ... 50
3.2.2 MSC Implantation ... 51
3.2.3 MRI ... 51
3.2.4 Image Analysis and Quantification ... 52
ix
3.3 Results ... 53
3.4 Discussion ... 59
3.5 Conclusions ... 62
3.6 References ... 62
Chapter 4 ... 67
4 Application of Dual 19F- and Iron-Cellular MRI Agents to Track the Infiltration of Immune Cells to the Site of a Rejected Stem Cell Transplant‡ ... 67
4.1 Introduction ... 67
4.2 Methods... 69
4.2.1 hMSC Culture and Labeling ... 69
4.2.2 hMSC Implantation ... 70
4.2.3 MRI ... 70
4.2.4 Image Analysis and Quantification ... 72
4.2.5 Immunohistochemistry ... 72
4.3 Results ... 73
4.4 Discussion ... 80
4.5 Conclusions ... 82
4.6 References ... 82
Chapter 5 ... 89
5 Translation of High-field Fluorine-19 Cell Tracking into the Clinical Realm ... 89
5.1 Introduction ... 89
5.2 Methods... 91
5.2.1 Labeling of PBMC with Cell Sense ... 91
5.2.2 Pre-clinical MRI of PBMC Migration ... 91
5.2.3 Clinical MRI Protocol ... 92
x
5.3 Results ... 93
5.4 Discussion ... 98
5.5 References ... 101
Chapter 6 ... 104
6 Summary and Future Work ... 104
6.1 Discussion and Conclusions ... 104
6.1.1 Chapter 2 & 3 – Development of Pre-clinical 19F-MRI and Tracking the Fate of Stem Cell Implants ... 104
6.1.2 Chapter 4 – Application of Dual 19F- and Iron-cellular MRI Agents to Track the Infiltration of Immune Cells to the Site of a Rejected Stem Cell Transplant ... 105
6.1.3 Chapter 5 – Development of a Clinical Protocol for Imaging 19F-labeled PBMC ... 106
6.2 Limitations ... 107
6.3 Future Work ... 109
6.3.1 Application of 19F-MRI to Pre-clinical Disease Models ... 109
6.3.2 Two-colour 19F-MRI for Imaging Transplant Rejection ... 109
6.3.3 Phase-I Clinical Trial Investigating Safety and Tolerability of 19F-labeled Human PBMC ... 110
6.4 References ... 110
xi
List of Tables
Table 1: Properties of relevant nuclei ... 6
Table 2: Comparison of common cell tracking techniques ... 13
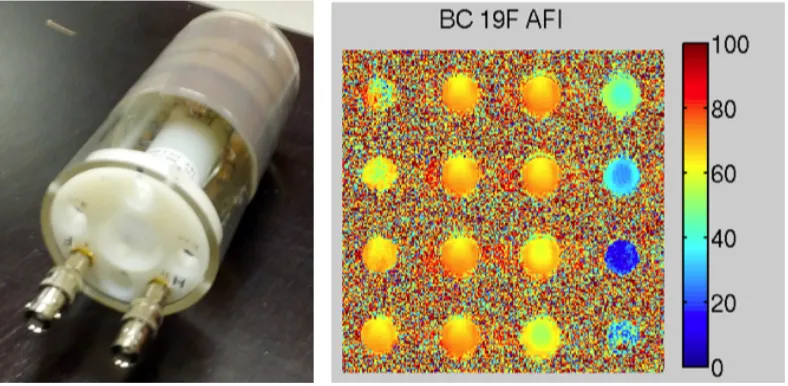
Table 3: PFC relaxation rates vary with agent and field strength ... 18
Table 4: Summary of pre-clinical mPBMC migration to popliteal lymph nodes ... 94
xii
List of Figures
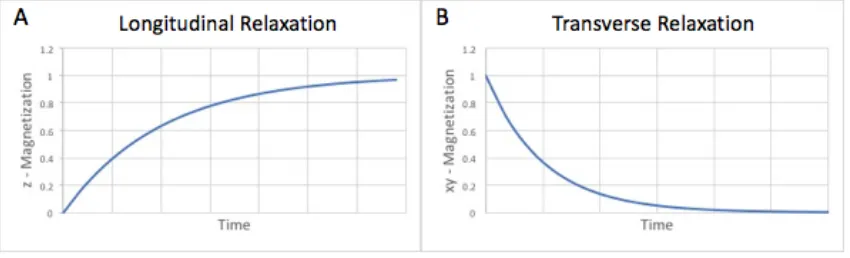
Figure 1: Graphs of Longitudinal and Transverse Relaxation rates. In both cases the y-axis is normalized to M0, the magnetization of the sample induced by the main magnetic field. ... 6
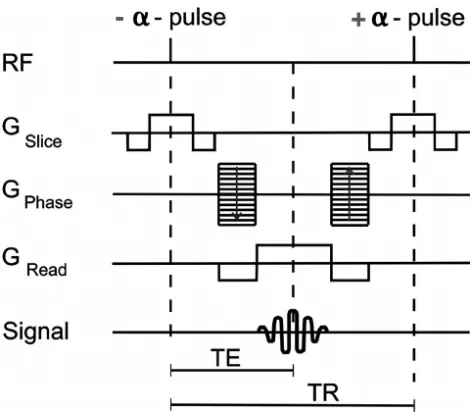
Figure 2: Balanced steady-state free precession pulse sequence diagram. The time to form an echo (TE) is commonly set to ½ the repetition time (TR). In a single sequence repetition all gradient magnitudes are balanced to produce a net of 0. Figure adapted from “Picture to Proton”34 ... 9
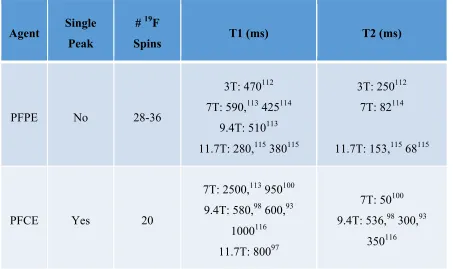
Figure 3: (A) Image of the dual tuned birdcage volume coil. The tuning frequency is controlled by driving through one of the two coaxial cable connectors. (B) The Actual Flip angle Image (AFI) shows the field uniformity in the center of the 19F birdcage coil, with each circle representing a 5mm axial slice. The scale on the right indicates the actual flip angle applied to the same following application of a 90o pulse. ... 34
Figure 4: Cell pellets containing 20,000 (white arrow) and 60,000 (yellow arrow) cells. (A) SNR and image quality is higher, and quantification was found to be more accurate at 2mm3 resolution, compared to (B) 12mm3 voxels. ... 35
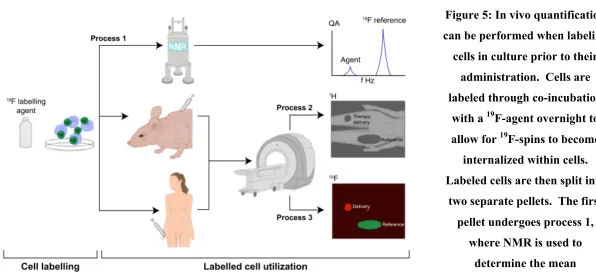
Figure 5: In vivo quantification can be performed when labeling cells in culture prior to their administration. Cells are labeled through co-incubation with a 19F-agent overnight to allow for 19F-spins to become internalized within cells. Labeled cells are then split into two separate pellets. The first pellet undergoes process 1, where NMR is used to determine the mean intracellular 19F uptake. The second pellet is administered into the host, either a pre-clinical model or a patient. Process 2 involves conventional 1H imaging of the host to provide the high resolution anatomical images. Then without moving the patient, 19F imaging is performed over the same field of view in process 3. These two images can be overlaid for anatomical context of the 19F signal. An external reference tube of known
xiii
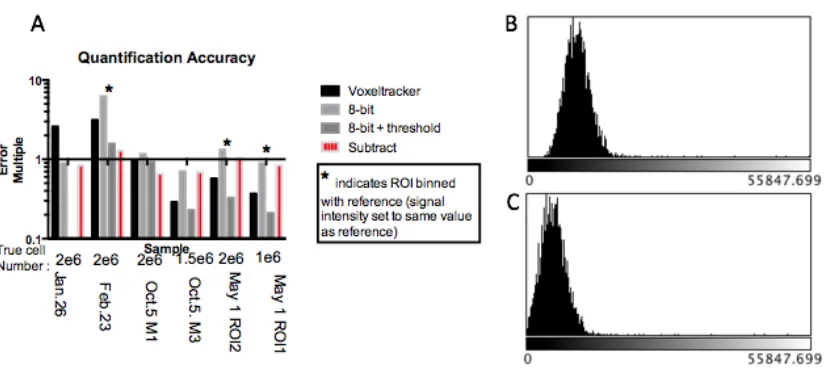
Figure 6: (A) Quantification error from six experiments is expressed as an error multiple from the true value of 1 on a logarithmic graph. The black bars indicate quantification error from raw un-adjusted data sets. (B) An image histogram of this data reveals that all voxels contain some signal value, an assumption that is not taken into account by the quantification software. (C) Improved quantification accuracy is obtained by left-shifting the histogram by subtracting a fixed value, equal to that of the lowest signal voxel, from all voxels as shown in the red bars. ... 39
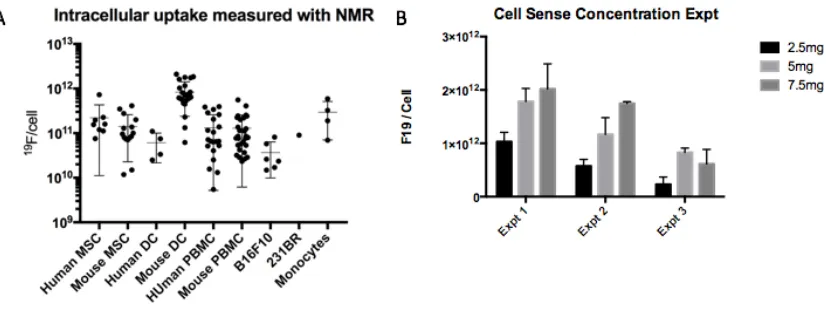
Figure 7: (A) Number of mean 19F atoms per cell as measured by NMR was observed to vary by over two orders of magnitude within cell samples. Each data point represents cells
prepared for a unique experiment. We found cells from older subjects tended to label less efficiently, in comparison to cells from younger subjects and culture. (B) Incubation
concentration of the 19F-agent Cell Sense also influenced cellular uptake. However, at 7.5mg the cell viability was observed to decrease (data not shown). ... 40
Figure 8: Each isoflurane molecule contains five 19F atoms (A). They are visible in the in vivo19F spectrum of an anesthetized mouse (B, yellow arrow). Here the main CS-1000 peak is visible centered at 0 Hz (white arrow) 91.5ppm], along with two isoflurane peaks [-86ppm and -81ppm]. ... 41
Figure 9: (A) Isoflurane signal (red arrow) is visible within the body of the mouse. This signal is spatially offset from its true location in the fat pad (blue arrow) due to the center frequency being locked on Cell Sense. (B) The default truncated sinc pulse is narrower in temporal space then the sinc pulse (D). After fourier transform the wider sinc pulse produces a narrower rectangular shape in frequency space, preventing the excitation of isoflurane (C). ... 42
Figure 10: By employing the narrow peak selective pulses, the distribution of i.v. Cell Sense (red) can be imaged separately from isoflurane (green). The two 19F images were then combined with an anatomical image. ... 43
xiv
Figure 12: (A) Cellular viability was investigated before and after labeling with the F-agent, Cell Sense. Although a statistically significant difference was observed in hMSC after labeling, the viability remained high (>80%) in all experiments. There was no significant difference in mMSC viability. (B) Mean cellular loading was determined by performing NMR spectroscopy on a known number of cells alongside a reference peak with a known number of 19F atoms. We observed variation in cellular loading of both hMSC and mMSC between experimental batches. However, this variation does not affect in vivo 19F
quantification since each transplant was only compared to its specific cellular loading. ... 54
Figure 13: in vitro validation of 19F-MRI quantification accuracy. Quantification was validated in a phantom study using cell pellets ranging from 2x10⁵ to 2x10⁶ MSC. Pellets were imaged three times, with the error bars representing the standard deviation between scans. The 19F-MRI quantification is in very strong agreement with the true number of cells, and has a Pearson correlation coefficient of 0.99. The red line represents the ideal result of a 1:1 correlation. ... 55
Figure 14: Comparison of 19F-labeled cell detection in two transplantation models over time (A) Following implantation of 2x10⁶ mMSC, 19F-MRI was used to quantify the number of cells remaining over 16 days. By day 16, only 2/7 mice had any detectable signal remaining.
A significant difference from day 0 is denoted by , from day 3 by u, and from day 9 by n.
(B) The number of detectable cells over a similar time period following a transplant of 1.5x10⁶ hMSC. 19F signal was found to decrease at a slower rate, with observable signal in all mice at the endpoint. Statistical significance is denoted in the same way as A. ... 55
xv
Figure 16: By day 16, 5/7 immune competent mice had no 19F-MRI signal remaining (A). The reference tube is marked by “R”. (B) Fluorescence microscopy of the muscle agreed with little red fluorescence. No GFP+ mMSC were detectable by fluorescence microscopy, suggesting the original mMSC are no longer present. (C) H&E staining reveals cells at the implant site which correlates with the remaining 19F red fluorescence. (D)
Immunohistochemistry staining of adjacent tissue sections with the anti-F4/80 antibody reveals a few macrophages at this location in the immune competent model. (E) At endpoint, all immune compromised mice had detectable 19F-MRI signal remaining. (F) More red fluorescence is visible, and (G)H&E staining again correlates well with the regions of red fluorescence. (H) Macrophage staining reveals many more F4/80 positive cells at the site of implantation corresponding to the regions of red fluorescence. Scale bars represent 250µm. 58
Figure 17: Human MSC were labeled with a 19F agent prior to being implanted into the mouse hindlimb muscle. Quantification of the 19F signal performed at this timepoint shows a strong correspondence with the expected number of cells. 2) One day after implantation, iron nanoparticles were administered i.v. These nanoparticles are scavenged from the bloodstream by macrophages and monocytes, rendering them MRI detectable. 3) Two days after
implantation, iron labeled macrophages have migrated to the site of implant. The labeled macrophages are visible in MR images as signal voids at the site. 19F-MRI signal is also significantly decreased as the iron quenches the signal. ... 71
xvi
in the muscle of the untreated leg. In addition to the implant site; voids were also visible in the lymph nodes, lymphatics, liver, and spleen. ... 74
Figure 19: Quantification of 19F signal at each time point. Significance between groups A&B at the same time point is donated with (#). Within the same group, over time is donated (†) between the previous time point and (‡) for between two time points. On day 0, both group A and B signal is in strong agreement with each other and with the expected number of
implanted hMSC (1x10⁶). Overtime, in group A 19F signal decreased at each subsequent time point. This is likely due to cell death and 19F agent clearance by the immune system. In group B, following i.v. iron administration there is a significant decrease in 19F signal (day 2) compared to the previous time point and the Group A mice at the same time point. After this there is no significant change in 19F signal in group B at any other time point. ... 75
Figure 20: A sham model of Group B was produced by performing an intramuscular injection containing only saline on day 0, followed by intravenous iron on day 1. On day 2, no proton signal voids were detectable within the muscle. Signal voids were detectable within the bone marrow, lymph nodes, and liver, indicating the iron injection was successful. These regions are marked by white arrows. ... 76
Figure 21: Inflammation was assessed by performing an intramuscular injection containing unlabeled hMSC on day 0, followed by i.v. 19F agent on day 1 [Group D]. A representative 19F/1H overlaid image from day 2 shows a similar inflammation pattern within the muscle
[white arrow] as observed with iron oxide (A). On day 2 a mean of 2.5±1.3x101819F spins was detected at the transplant site. 19F signal was also detected at the lymph node [yellow arrow]. Unlike Group B, the 19F-labeled macrophages can be quantified over time (B). The relative signal normalized to day 2 within each mouse provides a measure of change in inflammation over time. No significant differences were observed at any time point. ... 77
xvii
on day 14 (F), in agreement with MRI signal. Cell nuclei were detected with blue Hoeschst staining (C,G). Merged fluorescent images show some bystander labeling of macrophages, appearing as yellow. On day 2, there are few bystander labeled macrophages, as indicated by the separation between red and green fluorescent markers (H). However, by day 14 the majority of 19F agent is contained within macrophages (H). This is highlighted within the magnified inset in the lower left corner (width 150µm). ... 78
Figure 23: Signal void is visible in the axial proton images of the muscle after stem cell transplant on day 2 (A). The transplant site is denoted by the white arrow. No signal void is visible in the opposite, untreated, hindlimb muscle. Histology reveals the presence of iron within the muscle tissue on both day 2 (B) and day 14 (D). Scale bars denote 300µm. The accompanying stem cell track is outlined by the red fluorescent 19F agent (C,E). More iron is found within the stem cell track at endpoint compared to day 2; often colocalized with the 19F agent. suggesting it is contained within bystander labeled immune cells. ... 79
Figure 24: MRI provides excellent soft tissue contrast and lymph node detection. Imaging protocol has been developed for a clinical 3T GE MRI (A). 19F imaging is performed with a small dual-tuned surface coil placed on the patients upper thigh, centered on the injection point (B). A coronal orientation MRI with the body coil reveals the lymph nodes as dark spheres [blue arrow] within the fat of the upper thigh (C). The orange dashed line indicates the location of the axial MRI slice (D). In the axial image, the nodes were measured to be approximately 1.5cm below the skin (D). ... 95
xviii
at 3T and all 3 phantoms described in (C) were detected using F cellular MRI (D), with a hot-iron colour scale used for 19F MRI. ... 96
Figure 26: Human PBMC can be detected under clinical conditions following injection into a ham shank. Cells were administered interdermally in 4 doses [yellow arrows], 20x106 (A), 10.5x10⁶ (not shown), 4.5x10⁶ (B) and 1.5x10⁶. Only the smallest dose (1.5x10⁶) was undetectable with our imaging parameters. An additional 4.5x10⁶ dose was administered subcutaneously [blue arrow], which is visible at 1.2cm depth as measured with MRI. Images were performed alongside a pair of reference tubes (R) of known 19F concentration allowing for signal quantification. The surface coil was placed directly on the ham shank, with the reference tubes taped inside the coil elements (C). A representative human 1H image taken with the same parameters closely resembles the ham images in both tissue appearance and subcutaneous fat disposition (D). ... 97
xix
List of Appendices
Appendix A: Permissions ... 112
xx
List of Abbreviations
19F – fluorine-19, natural isotope of fluorine 1H – hydrogen-1, proton
PFC – Perfluorocarbon Gd - Gadolinium
MRI – Magnetic Resonance Imaging MPI – Magnetic Particle Imaging BLI – Bioluminescence Imaging
SPECT – Single Photon Emission Computed Tomography PET – Positron Emission Tomography
MSC – Mesenchymal Stromal/stem Cell PBMC – Peripheral Blood Mononuclear Cells T – Tesla
SPIO – Super Paramagnetic Iron Oxide PPB – Perl’s Prussian Blue
SE – Spin Echo GE – Gradient Echo
bSSFP – balanced Steady-State Free Precession ip – Intraperitoneal injection
iv – Intravenous injection im – Intramuscular injection
1
Chapter 1
1
Introduction*
This thesis develops and advances magnetic resonance imaging (MRI) techniques for non-invasive, in vivo tracking of cellular therapeutics. Research was performed with imaging phantoms and animal models. This introductory chapter discusses cell therapy, cellular imaging techniques, and cellular MRI to provide background and motivation for the research presented in this thesis.
1.1 Cellular Therapy
Cell therapy involves the administration of healthy cells into a patient in order to treat a disease or condition. Therapeutic cells from the patient can be specialized and expanded in vitro, then re-administered to the most favourable location in the patient. Pre-clinical experiments have shown that cellular therapy has the potential to revolutionize numerous fields within modern medicine; with applications ranging from regenerative medicine to immunotherapy.
1.1.1
Regenerative Medicine
Stem cell transplants are of particular interest for treating a variety of chronic disorders. Defined by the cell potency, “true” stem cells are pluripotent allowing for differentiation into any cell type. Multipotent stem cells, also known as progenitor cells, have the potential to differentiate into multiple cell types, but are limited compared to pluripotent cells. Mesenchymal stem cells (MSC) were first defined in 1991 by A.I. Caplan. to denote the
___________________
“Cellular Imaging with MRI,” Topics in Magnetic Resonance Imaging 25(5): 177-186. Sections are reproduced with permission (see Appendix A).
stromal progenitor and presumed stem cells for the skeletal tissues of bone, cartilage, muscle and fat.1 First derived from bone marrow, MSCs are one of the most investigated stem-like cells in clinical research. With applications in generating cardiac muscle,2,3 stroke recovery,4,5 and osteoarthritis repair;6 MSCs have the additional advantage of being present in adult tissue. In addition to directly replacing damaged tissues, stem cells have been shown to exert a local therapeutic effect through the release of trophic factors.2,7,8 Studies have shown that under the right conditions MSCs can be induced to pluripotency. However, recent work has shown that individual MSCs in culture are often already pre-dispositioned to certain lineages, disputing the claim of true multipotency.7,9 This has led to extensive debate on “how potent” an individual cell must remain to be considered a stem cell.7,9,10 Numerous groups have advocated for new definitions of MSCs, differentiating multipotent stromal cells from bone marrow derived mesenchymal stem cells.9,11,12 For simplicity, the term MSC as used in the remainder of this thesis refers to the encompassing broad MSC definition, without attempting to differentiate based upon the potency of the cells in culture.
Ultimately, the restorative effects of regenerative medicine relies on the arrival and survival of the cells at the targeted destination. Stem cells can be administered either systemically or at the therapeutic site.7 In either case, the cells must adapt to the local environment following expansion and specification in culture. Studies have shown that the majority of stem cells die in the days following transplantation.13–17 This may occur from a number of factors, such as: shear stresses encountered with needle delivery or insufficient access to nutrients. In either event, pro-inflammatory cytokines are released by dying stem cells, which in sufficient quantities is capable of trigging an influx of immune cells to the site of transplant.18,19
3
system towards the major histocompatibility complex (MHC) of the donated cells,18,19 or a long-term chronic rejection involving loss of vascularity.19 Alternatively, in the case of tissue transplants, donor immune cells present within the transplant may attack the host tissue; a process known as graft-versus-host disease (GVHD). For human cellular transplants, ideally stem cells are collected from the individual patient themselves, preventing adaptive immune rejection and GVHD, producing an autologous transplant. However, depending on the disease/condition and previous therapeutic treatments, these autologous cells may not be suitable for administration. Isografts are a near-ideal alternative with donor cells produced by a genetically identical background, such as an identical twin. Clinically, allograft transplantations are the most common, involving non-genetically identical donors. In these cases, immunosuppressive drugs are commonly required to prevent transplant rejection. Recent work has suggested that MSCs may display immune privileged properties, potentially allowing for unassisted allogeneic donation.7,12,20 However the degree of immune suppression has been contested with many reports suggesting it is insufficient to prevent allograft rejection.12,16
These models can be tested pre-clinically; with isografts produced by in-bred murine strains and allografts using cells between murine strains. In addition, xenografts can be investigated with donated cells from a different species as the host. This often results in hyper-acute rejection of the transplants,21 although stable xenografts can be produced with severely immune-compromised mice transplanted with human stem cells.
1.1.2
Immunotherapy
For many years, dendritic cells (DCs) have been investigated as the ideal APC for application in immunotherapy. In vivo, DCs play a pivotal role in initiating the immune response to foreign antigens. Capable of being derived from bone marrow or blood monocytes; DCs are characterized as highly MHC II expressing, with the absence of lineage markers, such as: CD14 (monocytes), CD19 (B-cells), and CD68 (macrophages).25,26 Since the first DC clinical trial was reported in 1996 for B-cell lymohoma,27 many patients have undergone vaccination trials for a range of cancers. Unfortunately, clinical success of DC-therapy has been limited with the majority of trials failing to show significant survivorship benefit.22,23,28,29 It is clear that additional research is necessary to improve DC migratory efficiency and ensure immune tolerance is avoided to improve clinical outcomes.28
On April 29, 2010, Sipuleucel-T, a cellular vaccine treatment was approved and licenced by the US FDA for metastatic castrate-resistant prostate cancer (mCRPC). Although localized prostate cancer has a good prognosis, there are currently few treatment options following systemic spread. In multiple Phase III clinical trials, Sipuleucel-T has shown a statistically significant survivor benefit over placebo controlled groups.24,30 Treatment involves loading autologous peripheral blood mononuclear cells (PBMC) with an antigen construct containing prostatic acid phosphatase (PAP) and granuocyte macrophage colony-stimulating factor (GM-CSF). The PBMC fraction consists of a heterogeneous mixture of cells, containing professional APCs, such as: DCs, monocytes, and B-cells; along with activated: T- and NK cells. Following in vitro antigen loading of the PBMC, the cells are administered intravenously back into the patient.31 While cancer immunotherapy has only shown modest overall survival benefits in the clinic, progression-free survival was not significantly improved.30,32 Coupled with the high cost of treatment innovative approaches, such as those presented within this thesis, are necessary to advance the clinical application of cancer immunotherapy.
1.2 Magnetic Resonance Imaging
5
Sequence Design, 2nd ed.” by Robert Brown et al.33 and “From Picture to Proton” by McRobbie et al.34
1.2.1
Nuclear Magnetic Resonance
At the single voxel level, signal in MRI is derived from the dissipation of energy from spinning nuclei within a magnetic field. All nuclei have a characteristic spin (I) value; however only those with non-zero spins (I=1/2, 1, 3/2, …) produce a nuclear magnetic resonance signal. In MRI, most nuclei of interest are spin ½. When a collection of spins are placed within an external magnetic field (B0), these spins either align with or against the applied field. Signal in MRI is governed by the small excess proportion of these spins in the lowest energy state; or those in alignment with B0. The energy difference between the two states is dependent on the strength of B0, as shown in Equation 1.
∆" = %&'
( (eq.1)
Where µ is the nuclei’s magnetic moment (discussed further in Table 1). As the difference in energy level increases, a higher proportion of spins align with B0. At thermal equilibrium, the ratio of spins in each population can be described with the Boltzmann distribution (Eq. 2). Here, N+ and N- represent the number of spins in alignment with or against B0 respectively, k is the Boltzmann constant, and T is the temperature of the system. For this reason, imaging at higher field strengths (7T, 9.4T, 11.7T) improves signal compared to clinical magnets (1.5T, 3T).
)*
)+ = ,
-∆.
/0 (eq.2)
In addition to spin state, nuclei also present a characteristic precession about the main magnetic field. Governed by the nuclei’s gyromagnetic ratio (g) and B0, the Larmor frequency is given by Equation 3.
Table 1: Properties of relevant nuclei
Element Gyromagnetic Ratio (MHz/T)
Natural Abundance (%)
Magnetic moment
(5/5N) Nuclear Spin
1H 42.57 99.98 2.793 ½
19F 40.08 100 2.629 ½
Energy can be provided to excite the nuclei by applying a radiofrequency (RF) pulse at the nuclei’s Larmour frequency. Following excitation, the net magnetization (M) returns to the lowest energy state through the longitudinal (T1) and transverse (T2) relaxation time constants. T1 relaxation involves the growth of magnetization (Fig 1A), along the direction of the B0 field, defined as the z-axis. This occurs through the transfer of energy from the excited nuclei to the lattice. T2 relaxation governs the exponential decay of magnetization (Fig 1B) within the xy-plane through transfer of energy between spins resulting in loss of phase coherence. The observed transverse relaxation rate (1/T2*) is accelerated due to reversible dephasing because of: off resonance effects, molecular mechanisms, and magnetic field inhomogeneities.
Figure 1: Graphs of Longitudinal and Transverse Relaxation rates. In both cases the y-axis is normalized to M0, the magnetization of the sample induced by the main
7
1.2.2
Generating an Image
In MRI a magnetic field gradient along each Cartesian axis (x,y,z) is utilized to provide spatial localization of voxels. These magnetic gradients are many orders of magnitude smaller than the main magnetic field and are highly controlled. The application of a gradient influences the precession frequency of the nuclei across the gradient, resulting in a distribution of phases associated with the spatial location. Spatial information is obtained by assigning a unique initial phase and frequency to each location. This achieved by manipulating the duration and magnitude of these gradients across the field of view.
The timed RF excitation and magnetic field manipulations are defined in the MR pulse sequence. There are two categories of sequences, characterized by the method used to generate transverse magnetization coherence. In a standard spin echo (SE) sequence, spins are first excited by a 90° RF pulse. Magnetization is refocused (known as an echo) some time later by applying a second RF pulse, which reverses the direction of the spins. This reversal causes the spins to rephase and regain spin coherence at the echo time (TE). Due to the second RF pulse, SE sequences refocus all reversible signal and have the advantage of obtaining optimal signal per excitation, governed by T2.
The second type of sequence forms an echo through inverting the applied magnetic field gradient. For gradient echo (GE) sequences, an initial RF pulse is again used to excite the spins, although the flip angle is generally <90°. After excitation, the frequency encode gradients are applied to enhance dephasing, then reversed in amplitude to form an echo at TE. However, the resulting echo does not correct for field inhomogeneities, resulting in the T2* reductions to signal. Despite obtaining lower signal per excitation, this is offset by the capability to perform lower repetition times (TR) between excitations; which allows for more signal averaging within the same time period.
contains information on low frequencies, such as crude contrast and shapes; while high frequency information is found in the periphery of k-space, providing the boundaries and details. From here the data can be extracted from k-space and an MR image formed using the Fourier transform. This acts to separate the signal into a sum of sine waves with varying frequency, phase, and amplitude.
The signal intensities of an individual image voxel are governed by three factors: the spin density, T1, and T2 values of the material being imaged. The spin density governs the maximum potential magnetization (M0) providing the upper limit on the signal available to be detected. Image contrast is also influenced by the choice of pulse sequence and can be manipulated by adjusting the TR and TE of the sequence. For example, imaging with a long TE allows material with a short T2 to relax reducing the observed signal.
Meanwhile, material with a longer T2 would appear brighter as more spins are rephased to form the echo. The manipulating the TR has a similar effect on the images by varying the magnetization excited into the xy plane.
1.2.3
Balanced Steady-State Free Precession
Balanced steady-state free precession (bSSFP) is an advanced GE pulse sequence, and is also known by the vender specific names FIESTA, TrueFISP, and Balanced FFE. Unlike with conventional sequences, magnetization is not allowed to completely return to Mo prior to re-excitation. This generates a transverse and longitudinal magnetization steady-state after successive excitations. In addition, all gradient waveforms are also balanced to a net value of zero in each TR, as shown below in Figure 2.
Due to the magnetization steady-state, contrast is dependent on the ratio between T2/T1. The optimal flip angle is given by Equation 4, and results in the magnetization amplitude given by Equation 5.35
cos 9 = :;
:<+=
:;
:<*=
(eq.4)
>?? = = @>2
A@
9
Figure 2: Balanced steady-state free precession pulse sequence diagram. The time to form an echo (TE) is commonly set to ½ the repetition time (TR). In a single sequence repetition all gradient magnitudes are balanced to produce a net of 0.
Figure adapted from “Picture to Proton”34
bSSFP has the advantage of generating high signal-per-unit time images. This is accomplished by keeping TR extremely low (TR<<T1, often <10ms), which allows for high signal averaging. However, this has the disadvantage of requiring strong gradient slew rates and increased tissue heating, measured through specific absorption rate (SAR).35
The pulse sequence displays a characteristic banding artifact. This occurs since the transverse magnetization approaches zero at multiples of 2p. This can be offset by a technique known as phase cycling, which varies the location of the dark bands allowing for them to be removed through signal averaging.
1.2.4
Iron Oxide-Contrast Agents
In MRI, regions of interest (ROIs) can be emphasized using paramagnetic and superparamagnetic agents which influence the image contrast. Localized positive enhancements to the signal can be achieved with gadolinium or manganese agents, while negative contrast can be generated with iron oxide agents. When imaged with a MRI, SPIO particles result in a reduction in the local T1, T2, and T2*. This is caused by disturbing the local magnetic susceptibility and is most pronounced in the immediate vicinity of the superparamagnetic material. With conventional sequences, the T2 and T2* reductions appear as a region of negative contrast on the image. The size of this region is dependent on a number of factors, such as: the pulse sequence timing, method of echo formation, and field strength;39 with the largest effects visible in T2*-weighted images.33 Positive image contrast is possible with certain advanced methods such as: ultrashort echo time (UTE) imaging, with the echo formed in less than the T2*;40 or through inversion recovery with on-resonance water suppression.41
1.3 Imaging Cellular Therapeutics
While pre-clinical experiments have shown that cellular therapy can be successful, despite decades of research, cellular therapy has been unable to meet clinical expectations. One problem exists in that once these cells are re-administered to the patient it often takes months before diagnostic feedback is available. In this time, it is unknown if the cells are providing any therapeutic benefit to the patient.
11
There are currently several established in vivo cell-tracking methods including: optical (fluorescence microscopy & bioluminescence imaging [BLI]), radioactive tracers (positron emission tomography [PET] & single-photon emission computed tomography [SPECT]), and MRI using heavy metal contrast agents (superparamagnetic iron oxide [SPIO] & paramagnetic gadolinium [Gd]). Each of these modalities has their respective advantages and disadvantages. For example, BLI signal is semi-quantitative and only produced by living cells, but is attenuated with tissue depth and requires non-native transfected cells.42,43 By comparison, PET is highly sensitive at all depths and is clinically translatable, but the ionizing radiation can be highly toxic to sensitive therapeutic cells.44 In addition to these methods, there are two recently developed technologies, magnetic particle imaging (MPI)45 and fluorine-MRI (19F-MRI).46 The relative differences between some of the more common techniques are compared in Table 2. The values presented are approximate guidelines of each technique; with values being highly dependent on imaging time, protocol and equipment.
1.3.1
Cellular MRI
bone and lung, can appear similar to iron oxide signal void. In addition, in vivo quantification of iron containing cells is complex. The fractional signal loss produced by SPIO is only linear at very low concentrations of iron oxide, and quickly reaches a saturation point after which further signal loss does not occur.37 This makes it extremely difficult to quantify the amount of iron present within a signal void. Nevertheless, over the years SPIO have been used to track a vast range of cells, such as: immune cells,44,51–54 stem cells,55–57 cancer cells,58–60 and pancreatic islets.61
1.3.2
Labeling Therapeutic Cells for MRI
Cells of interest must first be labeled with an imaging agent allowing for their specific detection. These agents can be genetically engineered into the cells,68 administered to the cells in culture prior to administration,69 or injected intravenously to label native cells in situ.14 For imaging cellular therapeutics with MRI, the most common method employed to label cells is in vitro. This provides the greatest control of label uptake, ensuring only the specific cells of interest are labeled.
Table 2: Comparison of common cell tracking techniques
MRI - Iron oxide MRI - 19F PET - 18F62,63 SPECT - 111In64,65 MPI - Iron oxide45,66 BLI -luciferase42,67
Sensitivity 1-10 cells
(0.01ng/voxel)37 10,000 cells (300ng/voxel) 100-1000 cells 100-1000 cells 100 cells (5ng/voxel) 1000 cells
Cellular loading >99% (1-10pg/cell)37 >99% (0.3-30pg19F/cell) 4-99% 4-25% (diluted) >99% (1-25pg/cell) >95%
Resolution µm mm mm mm mm mm
Bystander labeling Yes Yes Yes Yes Yes No
Quantifiable Semi Yes Yes Yes Yes Semi
Imaging Time Minutes Minutes Seconds Seconds Seconds Seconds
Longitudinal potential Months Months Hours Days Months Months
Total Imaging Cost $$$ $$$$ $$$ $$$ $ $
nanoparticle uptake through a variety of endocytosis pathways; including: phagocytosis, clathrin-, and caveolin-mediated endocytosis.41,72 The preferred method is dependent on
cell type, as well as the size and surface coating of the agent. Following internalization, the nanoparticles are contained within vesicles in the cytoplasm. Higher label-uptake is possible with phagocytic cells, which are capable of taking up additional label through phagocytosis.72 Following label internalization, it is also important to ensure that these agents do not induce functional or phenotypic changes in the cells that they label. Numerous studies have shown that labeling MSCs does not impact short- or long-term viability, proliferation, or differentiation into adipogenic or osteogenic lineages.56,73 However, Rohani et al. demonstrated differences in activation and migration of DCs labeled with micron-sized iron oxide particles.51
1.3.3
Imaging Inflammation
Besides labeling cells in culture, phagocytic cells can also be labeled in situ following intravenous (i.v.) administration of an imaging agent. This is particularly useful for tracking localized inflammation, through the large influx of immune cells. In mice, the cellular imaging agent is administered through the tail vein with imaging performed 24 hours later. Most of the agent is cleared from the blood through the mononuclear phagocytic system, resulting in uptake by; Kupffer cells in the liver, monocytes in the bone marrow, and macrophages in the lymph nodes and spleen. Applications have been shown in a variety of fields, such as: myocardial infarct,74,75 stroke,76 transplant
rejection,13,14,53,77 tumour-associated macrophages,78,79 and spinal cord injury.80
1.4
19F-MRI Cell Tracking
The first 19F observations were attempted with NMR in 1942,81 followed by MRI in the
15
threshold has been reached, the signal produced is linearly proportional to the number of
19F atoms, allowing for quantification;85 details of which are expanded upon later in
Chapter 2. A drawback of this direct detection is the relative insensitivity of the nuclear magnetic resonance signal. As discussed in Section 1.2.1, signal in MRI is governed by the surplus of spins in alignment with the main magnetic field. With standard MRI this is not a concern, due to the high abundance of 1H in biological tissue. For 19F-MRI, a large number of additional 19F atoms must be introduced to the cell in order to produce enough NMR signal to be detectable. This requires mM concentrations (~ 1015 19F atoms) per voxel for imaging.86 However, due to the near-absence of native 19F-atoms in biological tissue no background signal is observed, providing excellent imaging specificity.
The first application of 19F-MRI for cell tracking was demonstrated in 2005 by Ahrens et al.46 In this study, immunotherapeutic DCs were tracked following subcutaneous injection to the draining popliteal lymph node.46 Cells were labeled in vitro by co-incubation with an emulsified perflurocarbon (PFC), which was internalized through phagocytosis. Anatomical localization was achieved by overlaying the 19F image onto a traditional proton MR image. In the 11 years since this first study, the field has grown at an exponential rate,87 with significant advances in hardware,88–90 image acquisition,56,91,92 and data processing.93,94 To date, most of this work has been performed at high-field strengths (>7 T), to improve sensitivity of 19F-MRI. Studies have demonstrated 19F can be added to cells in culture and used to track stem cells from hematopoietic,95 neuronal,96 and mesenchymal progenitors;56 as well as a variety of immune cells, such as: DCs,46,97,98 NK cells,99 T-cells,100 and macrophages.77 PFC uptake has been observed in both T- and
B-cells, which have been historically difficult to label with SPIO-based agents.100
lymph node.97 In this study, extensive work was performed to show that labeling did not negatively affect the expression of surface markers, DC maturation, and T-cell stimulatory function.97 In 2011, a German group led by Dr. Waiczies showed that the
labeling efficiency of DCs increased with the PFC particle size, up to a maximum of 560nm diameter.101 Interestingly, their work showed improved T-cell activation following 19F-loading of DCs;101 suggesting heavy intracellular 19F-uptake may act to induce DC maturation processes. With these promising results, the clinical feasibility of detecting DCs in vivo was first explored in 2011 by Bonetto et al.102 In this work, they showed an intracellular uptake of 1.7x10¹³ 19F/cell, the highest reported labeling efficiency to date.102 Using a spin density weighted SE sequence on a 7T system, a minimum of 2000 cells/voxel could be detected in phantoms.102 These results were extrapolated to provide an estimation of a minimum detection threshold of 30,000 cells/voxel on a clinical 3T MRI,102 or around 5x101719F atoms.
Another common application of 19F-MRI has been for imaging stem cell transplants. The field is well suited to 19F-MRI, since large numbers of stem cells are routinely administered in translational models. Like with DCs, PFCs have been shown to not negatively influence stem cell surface markers, differentiation, or proliferation.56,103 Using relatively simple transplantation models has allowed for groups to test and optimize more advanced 19F techniques. An example of this is in 2007, Partlow et al. demonstrated that two-colour 19F-MRI could be used to distinguish separate populations of stem cells that had been labeled with different PFC agents.95 By selectively exciting each agent individually, the different cell populations could be imaged in sequential 19F
scans.
17
by Balducci et al., 19F-MRI was used to assess longitudinal responses to an arthritis therapy.108 Inflammation as marked by 19F-signal was observed to increase in untreated
controls, but 19F-signal remained constant in prednisolone treated animals.108
Unfortunately no 19F clearance was observed overtime, despite the success of therapy as measured by other clinical responses.108 This highlights one of the drawbacks of using cellular MRI for longitudinal inflammatory imaging, macrophages are known to remain in the tissue for an extended period of time after the initial inflammation subsides. In addition to imaging inflammation near bone, cardiac tissue is another region where joint
1H/19F MRI has an advantage over previous techniques. In 2008, Flogel et al. imaged
inflammation following cardiac ischemia, showing a time dependence on the observed
19F-signal between 1 and 6 days post ischemic event.75 This differed from results
observed in a similar model using SPIO, where no difference in fractional signal loss was observed after 24 hours.13 This is likely due to the saturation of the signal loss that occurs with iron-oxide, and highlights the advantage of using 19F-MRI for quantitative analysis.
19F MRI has also been utilized to image acute allograft rejection following heart
transplantation in mice.107 Inflammation could be differentiated and quantified between
the left and right ventricles of the heart,107 potential allowing for targeted interventions to be performed to prevent the organ from being rejected.
1.4.1
Perflurocarbon Imaging Agents
Due to the toxicity of ionic 19F atoms, imaging is predominately performed with
biologically inert PFC. These agents make use of the carbon-fluorine bond, the second strongest bond in organic chemistry, which cannot be naturally broken.109 This produces biologically safe, inert agents for imaging. In the 80’s, PFCs were evaluated as a blood substitute option in patients due to the high affinity for O2.110 In comparison, for cell
tracking applications only minuet quantities of PFC are used, with clearance through the monocyte-phagocyte system and lung exhalation.111,112
relaxation times at a variety of field strengths for commonly used 19F agents in cell tracking.
Table 3: PFC relaxation rates vary with agent and field strength
Agent Single
Peak
# 19F
Spins T1 (ms) T2 (ms)
PFPE No 28-36
3T: 470112 7T: 590,113 425114
9.4T: 510113 11.7T: 280,115 380115
3T: 250112 7T: 82114
11.7T: 153,115 68115
PFCE Yes 20
7T: 2500,113 950100
9.4T: 580,98 600,93
1000116 11.7T: 80097
7T: 50100 9.4T: 536,98 300,93
350116
At the moment there is only a single commercial PFC designed for cell tracking. Based on a PFPE backbone, Cell Sense (CS-1000, CelSense Inc.) is produced under the Good Manufacturing Practices (GMP) required for clinical applications. As such it is the only commercially available, FDA-approved cellular MRI agent. For pre-clinical work, the agent is available in fluorescently tagged variants (CS-1000 DM-red), as well as in a form suitable for IV injection for in situ labeling of phagocytes (VS-1000).
1.5 Purpose of Thesis
Since 2005, numerous proof-of-concept studies have been performed with a variety of cell types in various disease models. However, until recently, this work has been restricted to a handful of laboratories with the necessary combination of expertise and equipment. The purpose of this thesis was to develop technology and implement the first
19
1.5.1
Hypotheses
1. Transplanted cell number and spatial location can be non-invasively monitored with longitudinal 19F-MRI.
2. Differences in stem cell fate can be detected between isograft and xenograft transplantation models with 19F-MRI.
3. The combination of 19F-labeled stem cells and iron-labeled immune cells will allow for simultaneous MRI446 of transplant rejection.
4. Clinical cell tracking will be feasible with 19F-MRI for a future cancer immunotherapy clinical trial.
In Chapter 2, the development and implementation of small animal 19F-MRI is outlined for a 9.4T MRI system. This work introduces and provides additional details for the pre-clinical imaging protocols utilized by this thesis.
In Chapter 3, the stem cell fate in two models of murine transplantation were investigated with 19F-MRI. Validated with histology, this work shows that 19F-MRI is a powerful tool for non-invasive, longitudinal imaging. This chapter was published in PLoS ONE (Gaudet et al. Tracking the fate of stem cell implants with fluorine-19 MRI. PLoS ONE. 2015 10(3):e0118544)
In Chapter 4, the natural immune response to a rejected transplant was imaged with dual cellular MRI agents. Immune cells were tracked following in situ labeling with iron oxide, while stem cells were monitored with 19F-MRI. This chapter was published in the
journal, Magnetic Resonance in Medicine (Gaudet et al. Application of dual 19F and iron cellular MRI agents to track the infiltration of immune cells to the site of a rejected stem cell transplant. MRM. 2016)
1.6 References
1. Caplan AI. Mesenchymal stem cells. Journal of Orthopaedic Research. 1991;9(5):641– 50.
2. Psaltis P, Zannettino A. Concise review: mesenchymal stromal cells: potential for cardiovascular repair. Stem Cells. 2008:2201–2210.
3. Quevedo HC, Hatzistergos KE, Oskouei BN, Feigenbaum GS, Rodriguez JE, Valdes D, Pattany PM, Zambrano JP, Hu Q, McNiece I, et al. Allogeneic mesenchymal stem cells restore cardiac function in chronic ischemic cardiomyopathy via trilineage differentiating capacity. Proceedings of the National Academy of Sciences of the United States of America. 2009;106(33):14022–7.
4. Meirelles L da S, Nardi NB. Methodology, biology and clinical applications of mesenchymal stem cells. Frontiers in Bioscience. 2009;14(6):4281–4298. 5. Chen J, Li Y, Wang L, Zhang Z, Lu D, Lu M, Chopp M. Therapeutic benefit of
intravenous administration of bone marrow stromal cells after cerebral ischemia in rats. Stroke. 2001;32(4):1005–11.
6. Nedopil A, Klenk C, Kim C, Liu S, Wendland M, Schuster T, Sennino B, Mcdonald DM, Daldrup- HE. MR signal characteristics of viable and apoptotic human mesenchymal stem cells in MASI for treatment of osteoarthritis. Investigative radiology. 2010;45(10):634–640.
7. Keating A. Mesenchymal stromal cells: new directions. Cell Stem Cell. 2012;10(6):709–16.
8. Segers VFM, Lee RT. Stem-cell therapy for cardiac disease. Nature. 2008;451(7181):937–42.
9. Bianco P. “Mesenchymal” Stem Cells. Annual Review of Cell and Developmental Biology. 2014;30(1):677–704.
10. Trivanovic D, Krstic J, Djordjevic IO, Mojsilovic S, Santibanez JF, Bugarski D, Jaukovic A. The Roles of Mesenchymal Stromal/Stem Cells in Tumor
21
11. Dominici M, Le Blanc K, Mueller I, Slaper-Cortenbach I, Marini F, Krause D, Deans R, Keating A, Prockop D, Horwitz E. Minimal criteria for defining multipotent mesenchymal stromal cells. The International Society for Cellular Therapy position statement. Cytotherapy. 2006;8(4):315–317.
12. Ankrum J a, Ong JF, Karp JM. Mesenchymal stem cells: immune evasive, not immune privileged. Nature biotechnology. 2014;32(3):252–60.
13. Kanno S, Wu YJ, Lee PC, Dodd SJ, Williams M, Griffith BP, Ho C. Macrophage accumulation associated with rat cardiac allograft rejection detected by magnetic resonance imaging with ultrasmall superparamagnetic iron oxide particles. Circulation. 2001;104(8):934–938.
14. Zhang Y, Dodd SJ, Hendrich KS, Williams M, Ho C. Magnetic resonance imaging detection of rat renal transplant rejection by monitoring macrophage infiltration. Kidney International. 2000;58(3):1300–1310.
15. Gollackner B, Goh SK, Qawi I, Buhler L, Knosalla C, Daniel S, Kaczmarek E, Awwad M, Cooper DKC, Robson SC. Acute Vascular Rejection of Xenografts: Roles of Natural and Elicited Xenoreactive Antibodies in Activation of Vascular Endothelial Cells and Induction of Procoagulant Activity. Transplantation. 2004;77(11):1735–1741.
16. Griffin MD, Ryan AE, Alagesan S, Lohan P, Treacy O, Ritter T. Anti-donor immune responses elicited by allogeneic mesenchymal stem cells: what have we learned so far? Immunology and cell biology. 2013;91(1):40–51.
17. Satyananda V, Hara H, Ezzelarab MB, Phelps C, Ayares D, Cooper DKC. New concepts of immune modulation in xenotransplantation. Transplantation. 2013;96(11):937–45.
18. Magil AB. Monocytes/macrophages in renal allograft rejection. Transplantation Reviews. 2009;23(4):199–208.
19. Murphy SP, Porrett PM, Turka L a. Innate immunity in transplant tolerance and rejection. Immunological reviews. 2011;241(1):39–48.
Hematology. 2002;30(1):42–8.
21. Auchincloss H, Sachs DH. Xenogeneic transplantation. Annual review of immunology. 1998;16:433–470.
22. Melief CJM. Cancer Immunotherapy by Dendritic Cells. Immunity. 2008;29(3):372– 383.
23. Fong L, Engleman EG. Dendritic Cells in cancer immunotherapy. Annual Review of Immunology. 2000;(18):245–273.
24. Lubaroff DM. Prostate cancer vaccines in clinical trials. Expert Review of Vaccines. 2012;11(7):857–68.
25. Hart D. Dendritic Cells: Unique Leukocyte populations which control the primary immune response. Blood. 1997;90(9):3245–3287.
26. Betjes MGH, Haks MC, Tuk CW, Beelen RHJ. Monoclonal Antibody EBM11 (Anti-CD68) Discriminates between Dendritic Cells and Macrophages after Short-Term Culture. Immunobiology. 1991;183(1):79–87.
27. Hsu FJ, Fagnoni F, BENIKE C, Liles TM, Czerwinski D, Taidi B, Engleman EG, Levy R. Vaccination of patients with B-cell lymphoma using autologous antigen-pulsed dendritic cells. Nature Medicine. 1996;2(1):52–58.
28. Radford KJ, Tullett KM, Lahoud MH. Dendritic cells and cancer immunotherapy. Current opinion in immunology. 2014;27(DC):26–32.
29. Westdorp H, Bol KF, Coskunturk M, Schreibelt G, Vries IJM De, Figdor CG. Dendritic Cell-based Cancer Vaccines. In: Britten CM, Kreiter S, Diken M, Rammensee H-G, editors. Cancer Immunotherapy Meets Oncology. Cham: Springer International Publishing; 2014. p. 71–87.
30. Small EJ, Schellhammer PF, Higano CS, Redfern CH, Nemunaitis JJ, Valone FH, Verjee SS, Jones L a, Hershberg RM. Placebo-controlled phase III trial of immunologic therapy with sipuleucel-T (APC8015) in patients with metastatic, asymptomatic hormone refractory prostate cancer. Journal of clinical oncology : official journal of the American Society of Clinical Oncology. 2006;24(19):3089– 94.
23
immunotherapy with sipuleucel-T in androgen-dependent prostate cancer. Clinical cancer research : an official journal of the American Association for Cancer Research. 2011;17(13):4558–67.
32. Graff JN, Chamberlain ED. Sipuleucel-T in the treatment of prostate cancer: an evidence-based review of its place in therapy. Core Evidence. 2015;10:1–10. 33. Brown R, Cheng Y, Haacke E, Thompson M, Venkatesan R. Magnetic Resonance
Imaging: Physical Principles and Sequence Design, 2nd Ed. 2nd ed. John Wiley & Sons Ltd; 2014. i-xxxii.
34. McRobbie D, Moore E, Graves M, Prince M. MRI: From Picture to Proton. Radiology. 2004;232(2):474.
35. Scheffler K, Lehnhardt S. Principles and applications of balanced SSFP techniques. European Radiology. 2003;13(11):2409–18.
36. Bhosale P, Ma J, Choi H. Utility of the FIESTA pulse sequence in body oncologic imaging: review. American Journal of Roentgenology. 2009;192(6 Suppl):S83-93.
37. Heyn C, Bowen C V, Rutt BK, Foster PJ. Detection threshold of single SPIO-labeled cells with FIESTA. Magnetic Resonance in Medicine. 2005;53(2):312–20. 38. Ribot EJ, Foster PJ. In vivo MRI discrimination between live and lysed iron-labelled
cells using balanced steady state free precession. European Radiology. 2012;22(9):2027–34.
39. Joo HT, Foster P, Rosales A, Feng B, Hasilo C, Martinez V, Ramadan S, Snir J, Melling CWJ, Dhanvantari S, et al. Imaging islets labeled with magnetic nanoparticles at 1.5 Tesla. Diabetes. 2006;55(11):2931–2938.
40. Liu W, Dahnke H, Rahmer J, Jordan EK, Frank JA. Ultrashort T2* relaxometry for quantitation of highly concentrated superparamagnetic iron oxide (SPIO)
nanoparticle labeled cells. Magnetic Resonance in Medicine. 2009;61(4):761–766. 41. Liu W, Frank J a. Detection and quantification of magnetically labeled cells by
cellular MRI. European Journal of Radiology. 2009;70(2):258–64.
Society of Nuclear Medicine. 2007;48(12):2011–20.
43. Tennstaedt A, Aswendt M, Adamczak J, Hoehn M. Noninvasive Multimodal Imaging of Stem Cell Transplants in the Brain Using Bioluminescence Imaging and
Magnetic Resonance Imaging. 2013;(June):153–166.
44. de Vries IJM, Lesterhuis WJ, Barentsz JO, Verdijk P, van Krieken JH, Boerman OC, Oyen WJG, Bonenkamp JJ, Boezeman JB, Adema GJ, et al. Magnetic resonance tracking of dendritic cells in melanoma patients for monitoring of cellular therapy. Nature Biotechnology. 2005;23(11):1407–13.
45. Saritas EU, Goodwill PW, Croft LR, Konkle JJ, Lu K, Zheng B, Conolly SM. Magnetic particle imaging (MPI) for NMR and MRI researchers. Journal of Magnetic Resonance. 2013;229:116–126.
46. Ahrens ET, Flores R, Xu H, Morel PA. In vivo imaging platform for tracking immunotherapeutic cells. Nature biotechnology. 2005;23(8):983–7.
47. Bulte JWM, Hoekstra Y, Kamman RL, Webb AG, Briggs RW, Go KG, Hulstaert CE, Mitenyi S, T.H. T, Leij LD. Specific MR imaging of human lymphocytes by monoclonal antibody-guided dextran-magnetite particles. Magnetic Resonance in Medicine. 1992;25(1):1489157.
48. Yeh T c., Zhang W, Ildstad ST, Ho C. Intracellular labeling of t-cells with super paramagnetic contrast agents. Magnetic Resonance in Medicine. 1993;30(5):617– 625.
49. Bulte JWM, Ma L, Magin RL, Kamman RL, Hulstaert CE, Go KG, The TH, de Leij L. Selective MR imaging of labeled human peripheral blood mononuclear cells by liposome mediated incorporation of dextran-magnetite particles. Magnetic
Resonance in Medicne. 1993;29(1):32–37.
50. Shapiro EM, Sharer K, Skrtic S, Koretsky AP. In vivo detection of single cells by MRI. Magnetic Resonance in Medicine. 2006;55(2):242–9.
51. Rohani R, de Chickera SN, Willert C, Chen Y, Dekaban G a, Foster PJ. In vivo cellular MRI of dendritic cell migration using micrometer-sized iron oxide (MPIO) particles. Molecular imaging and biology : MIB : the official publication of the Academy of Molecular Imaging. 2011;13(4):679–94.
25
Labelling dendritic cells with SPIO has implications for their subsequent in vivo migration as assessed with cellular MRI. Contrast media & molecular imaging. 2011;6(4):314–27.
53. Khurana a., Nejadnik H, Gawande R, Lin G, Lee S, Messing S, Castaneda R,
Derugin N, Pisani L, Lue TF, et al. Intravenous Ferumoxytol Allows Noninvasive MR Imaging Monitoring of Macrophage Migration into Stem Cell Transplants. Radiology. 2012;264(3):803–811.
54. Mallett CL, McFadden C, Chen Y, Foster PJ. Migration of iron-labeled KHYG-1 natural killer cells to subcutaneous tumors in nude mice, as detected by magnetic resonance imaging. Cytotherapy. 2012;14(6):743–51.
55. Noad J, Gonzalez-Lara LE, Broughton HC, McFadden C, Chen Y, Hess D a, Foster PJ. MRI tracking of transplanted iron-labeled mesenchymal stromal cells in an immune-compromised mouse model of critical limb ischemia. NMR in
Biomedicine. 2013;26(4):458–67.
56. Ribot EJ, Gaudet JM, Chen Y, Gilbert KM, Foster PJ. In vivo MR detection of fluorine-labeled human MSC using the bSSFP sequence. International Journal of Nanomedicine. 2014;9:1731–9.
57. Gonzalez-Lara LE, Xu X, Hofstetrova K, Pniak A, Chen Y, McFadden CD, Martinez-Santiesteban FM, Rutt BK, Brown A, Foster PJ. The use of cellular magnetic resonance imaging to track the fate of iron-labeled multipotent stromal cells after direct transplantation in a mouse model of spinal cord injury. Molecular Imaging and Biology. 2011;13(4):702–11.
58. Heyn C, Ronald J a, Ramadan SS, Snir J, Barry AM, MacKenzie LT, Mikulis DJ, Palmieri D, Bronder JL, Steeg PS, et al. In vivo MRI of cancer cell fate at the single-cell level in a mouse model of breast cancer metastasis to the brain. Magnetic resonance in medicine : official journal of the Society of Magnetic Resonance in Medicine / Society of Magnetic Resonance in Medicine. 2006;56(5):1001–10.