UNIVERSITY COLLEGE LONDON
Neutron and X-ray diffraction studies
of metal amine solutions
A THESIS SUBMITTED TO
THE UNIVERSITY OF LONDON
IN THE FACULTY OF SCIENCE
FOR THE DEGREE
OF DOCTOR OF PHILOSOPHY
By
Shusaku Hayama
ProQuest Number: 10010160
All rights reserved
INFORMATION TO ALL USERS
The quality of this reproduction is dependent upon the quality of the copy submitted. In the unlikely event that the author did not send a complete manuscript and there are missing pages, these will be noted. Also, if material had to be removed,
a note will indicate the deletion.
uest.
ProQuest 10010160
Published by ProQuest LLC(2016). Copyright of the Dissertation is held by the Author. All rights reserved.
This work is protected against unauthorized copying under Title 17, United States Code. Microform Edition © ProQuest LLC.
ProQuest LLC
789 East Eisenhower Parkway P.O. Box 1346
Acknowledgement
I would like to thank my supervisor, Dr. Neal Skipper, for being extremely helpful
throughout the project. He is the kind o f supervisor every Ph.D. student dreams about:
enthusiastic, insightful, always helpful and fun to work with. I must also thank Jonathan
Wasse and Jennifer Walters for all their assistance and for many useful discussions.
I am grateful to the Rutherford Appleton Laboratory (RAL) and the Institut
Laue-Langevin (ILL) for use o f their facilities and the beam time. Thanks also to
everyone at the RAL and ILL, in particular, I owe individual thanks to Alan Soper,
Chris Benmore, Henry Fischer, Robin Humphreys, John Bones, John Dreyer and Pierre
Palleau, for their support and assistance with the experimental work. I would also like to
thank the Postgraduate Teaching Committee for the additional funding that I have
received in order to complete this work.
I am also thankful to the following friends and colleagues for their support and
encouragement over the last three years: Joe Tong, Tomoka Mukai, Laurence Passmore,
Daniel Ucko, Andrew Steer, Eamonn Beime, Louise Affleck, Jonathan Allen, Simon
Armitage, Gary Martin and Helen Thompson. Finally, thanks to my parents for not only
bringing me into this world but also making me the person I am today.
Abstract
The structure o f solutions o f lithium in ammonia and methylamine has been studied
over the concentration range 2 to 22 MPM using two complementary techniques;
neutron and X-ray diffraction. It was found that, in spite o f differences in the electrical
and physical properties, the structural changes induced by the introduction o f lithium
metal into ammonia and methylamine are similar, and that both solutions are highly
structured over short- and intermediate- length scales. The latter finding is consistent
with Mott’s suggestion that the metal-nonmetal transition is dominated by
electron-electron interactions rather than disorder (Anderson-type).
The first detailed studies o f the ion-solvent and solvent structure in
lithium-methylamine solutions by the method o f isotopic labelling (”^^Li/^Li and D/^H) in
neutron diffraction are reported. The results show that each Li^ cation is strongly
solvated by about four solvent molecules, with the nearest-neighbour Li-N distance at
2.15(2) and 2.09(2) Â for 18 and 14.5 MPM respectively. This confirms that the excess
electrons reside outside the first solvent shell o f Li^, and electrical conduction is by
Brownian-like hopping o f electrons between neighbouring localised sites formed by the
solvated cations and free solvent molecules. The solvent-solvent structure shows the
presence o f relatively strong hydrogen-bonding in methylamine at 230 K:
approximately one hydrogen bond per molecule, = 1 .0 (3 ), at =2.3(1) Â. As the
concentration o f metal is increased, hydrogen-bonding and the coordination number o f
nearest neighbour are progressively perturbed. Qualitatively similar trends have also
been observed by X-ray diffraction studies o f lithium-ammonia solutions. These trends
are consistent with the Bjerrum-type defect model o f a polaronic cavity (Catterall and
Mott 1969), which suggests that the overall decrease in density is due to ejection o f
solvent molecules from around excess electrons.
Contents
Acknowledgements
iii
Abstract
iv
List o f Figures
ix
List o f Tables
xiii
Standard Symbols and Constants
xiv
Introduction
xv
1. Properties of metal-solutions: Metal-Nonmetal transition
1
1.1. Introduction 1
1.2. Dilute solutions 4
1.2.1. Electrical and magnetic properties o f dilute metal-solutions 8
1.2.2. Mechanical properties o f metal solutions 12
1.3. Concentrated metal-solutions 15
1.4. Structure o f metal-solutions: Simulations 21
1.5. Metal-nonmetal transition 23
1.5.1 Mott transition 23
1.5.2 Herzfeld model 24
1.5.3 Percolation theory 25
1.5.4 Anderson disorder localisation 26
2. Diffraction theory
29
2.1.1 Scattering cross sections and scattering vectors 29
2.1.2. Radial distribution and pair distribution functions 32
2.2. Basic scattering theory 34
2.3. Neutron diffraction 43
2.3.1 General properties o f thermal neutrons 43
2.3.2 Static approximation 45
2.4. X-ray diffraction 47
3. Experimental
53
3.1. Sample preparation 53
3.1.1. Basic procedure 55
3.2. Neutron diffraction experiments 58
3.2.1. Introduction 58
3.2.2. The SANDALS instrument 59
3.2.3. Sample environment 61
3.2.4. Experimental measurements 64
3.3. X-ray diffraction experiments: Philips X-pert 0-0 diffractometer 65
3.3.1. Bragg-Brentano para-focusing optics 65
3.3.2. Alignment 72
3.3.3. Continuous flow liquid nitrogen cryostat and sample cells 73
3.3.4. Data acquisition 79
4. Data analysis
80
4.1. Neutron data corrections 80
i) Detector efficiencies: PURGE D 81
ii) Converting into Q-space and normalisation: NORM 81
iii) Attenuation and multiple scattering corrections: CORAL 83
iv) Normalisation: ANALYSE 83
v) Inelastic scattering and self-scattering corrections: SUBSELF 85
vi) Merging and Fourier transformation: MERGE 85
vii) Consistency checks 86
4.2. X-ray data corrections 87
i) Background correction 88
ii) Polarisation correction 89
iii) Absorption and intensity corrections 90
iv) Multiple scattering correction 94
v) Atomic self scattering, Compton scattering and Normalisation 99
5. Results I:
Neutron diffraction studies o f solutions o f lithium in methylamine - first order difference functions 1055.1. Total structure factors and pair distribution functions 105
5.2. Difference functions 114
5.2.1. Theory 114
5.2.2. Results and discussion 116
5.3. Conclusions 123
6.
Results II:
Neutron diffraction studies o f non-metallic lithium solutions- hydrogen/deuterium isotopic substitution method 124
6.1. Theory - Second-order difference method 124
6.2. Results and discussion 126
6.2.1. Total structure factors and pair distribution functions 126
6.2.2. Partial structure and distribution functions 135
6.3. Conclusions 147
7. Results III:
X-ray diffraction studies o f solutions o f lithium in ammonia148
7.1 Introduction 148
7.2 Results and discussion 150
7.3 Conclusions 157
8. Conclusions
159
8.1. Summary 159
8.2. Future work 163
Appendix A
167
References
173
List of Figures
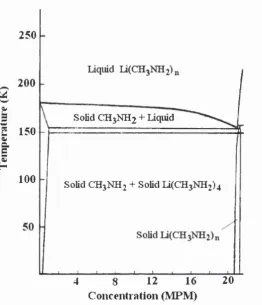
1.1a) The Phase diagrams o f lithium-ammonia solutions 3
1.1b) The Phase diagrams o f lithium-methylamine solutions 4
1.2 Absorption spectrum due to solvated electrons in dilute
sodium-ammonia solutions 6
1.3 Jortner’s model o f a solvated electron cavity and the wavefunction
and energy levels o f solvated electrons 6
1.4 Schematic representation o f the proposed ion-paired and
spin-paired species 8
1.5 The measured spin susceptibility for Na and K ammonia solutions 9
1.6 The ESR spectra from solutions o f alkali metals in ammonia,
methylamine and ethylamine 10
1.7 The density o f solutions o f K, Na and Li in ammonia 12
1.8 A schematic illustration o f electron solvation in liquid ammonia 14
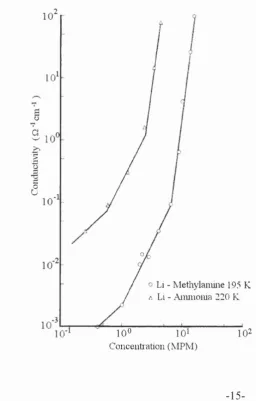
1.9 The electrical conductivity o f solutions o f Li in ammonia
and in methylamine 15
1.10 1 -D periodic with the band width B and random potential wells
and the corresponding density o f states N{E) 27
1.11 Density o f states o f conduction bands 27
2.1 Typical scattering experiment geometry 30
2.2 Vector diagram representing a scattering event 30
2.3 Schematic illustration o f the radial distribution for.... 33
2.4 Neutron and X-ray Scattering lengths as function o f atomic number 46
2.4 Schematic illustrations o f the atomic scattering (coherent)
and the Compton scattering (incoherent) factors 51
3.1 Schematic illustration o f the stainless steel gas-rig 54
3.2 Normalised raw neutron data for L1-CD3ND2 as a function o f time 57
3.3 Schematic diagram o f the instrument SANDALS 60
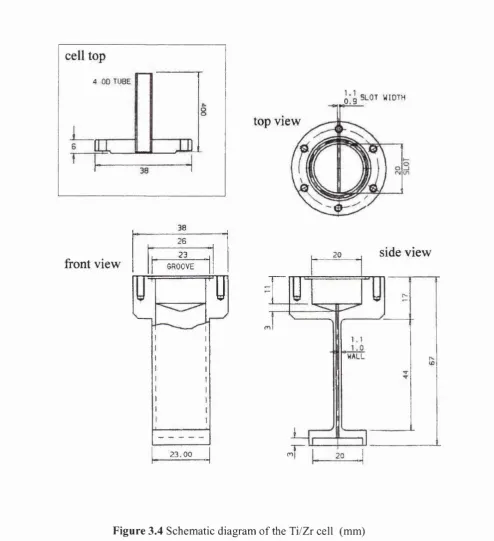
3.4 Schematic diagram o f the Ti/Zr cell 62
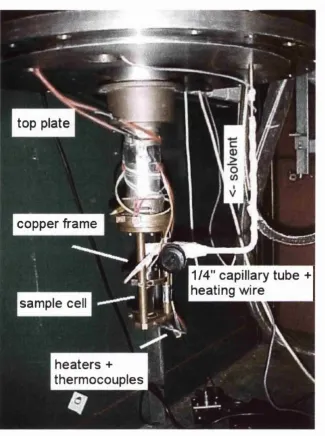
3.5 The sample cell mounting assembly 63
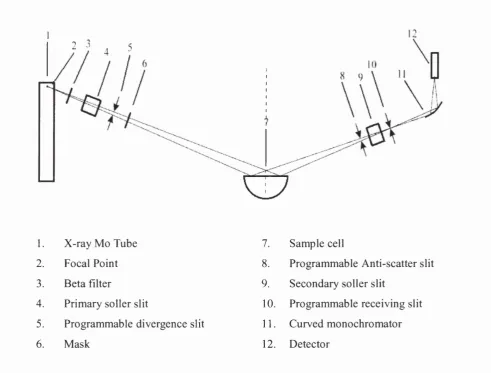
3.6 Schematic illustration o f the in-house Philips X-Pert 0-0 diffractometer 66
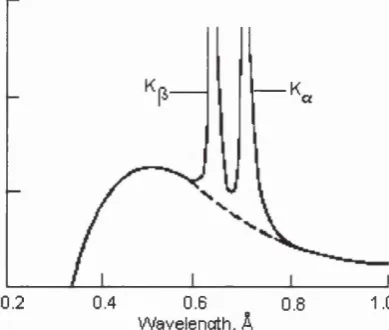
3.7 Schematic illustration o f the X-ray spectrum o f a Mo tube 67
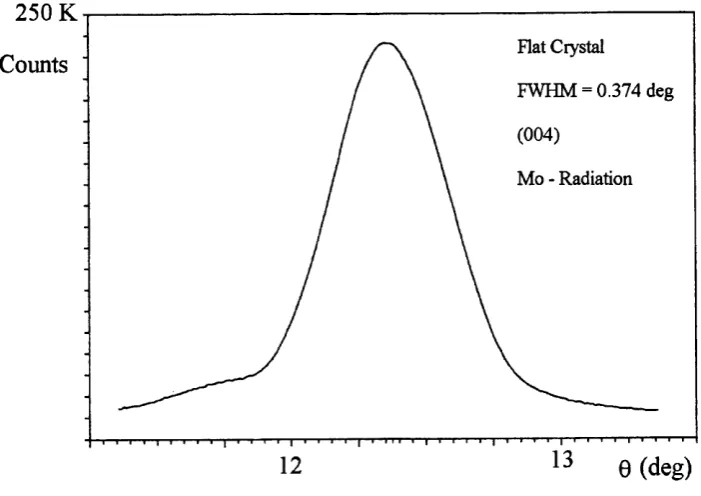
3.8 The rocking curve o f a flat graphite monochromator 71
3.9 Schematic illustration o f the liquid nitrogen cryostat 75
3.10a) Photograph o f the cryostat mounted on the
Philips X-Pert 0-0 diffractometer 76
3.10b) Schematic illustration o f X-ray diffraction geometry 76
3.11 Photographs o f the stainless steel sample cells 78
4.1 The total cross section for CD3ND2 calculated from the
transmission monitor data 81
4.2 Normalised raw neutron data o f a) sample (8 MPM Li:CD3ND2)
in a 1mm Ti/Zr cell, b) empty Ti/Zr cell and c) background 82
4.3 Example o f a smoothed vanadium spectrum 84
4.4 The measured X-ray data o f water 87
4.5 Comparison o f the polarization correction factors
4.6 0-0 scattering geometry for a weakly absorbing sample 92
4.7 Form o f sin(a) against sin (0 93
4.8 Examples o f absorption correction factors for water 93
4.9 Double scattering geometry 94
4.10 Example o f intensity ratio for water 97
4.11 Generated sample points (x, y) for the first scattering in water 98
4 1 2 I^ ^ D (Q )o iw a \sx 100
y j
4.13 Corrected diffraction data for water scaled to electron units by
4.14 The total structure factor and the radial distribution function
for water at ~20®C 104
5.1 The measured total structure factors for 0 ,2 , 4, 8 ,1 1 ,1 4 .5 ,1 8
and 20 MPM solutions o f ”“^Li in fully deuterated methylamine 108
5.2 The pair distribution fiinctions 0 ,2 ,4 , 8 ,1 1 ,1 4 .5 ,1 8 and 20 MPM
solutions o f ”®^Li in fully deuterated methylamine 109
5.3 The measured total structure factors for liquid ammonia, saturated lithium-ammonia solution at 230 K and saturated
potassium-ammonia solutions at 160 K 111
5.4 The measured total structure factors for 14.5 and 18 MPM solutions
o f “^^Li and ^Li in fully deuterated methylamine at 230 K 117
5.5 The difference functions for 18 and 14.5 MPM
lithium-methylamine solutions 118
5.6 The real space difference functions for 18 and 14.5 MPM
lithium-methylamine solutions 120
5.7 The real space difference function AGj^.{r) for saturated
lithium-ammonia solutions at 230 K 121
6.1 The measured total structure factors for 0, 2 and 8 MPM solutions
o f ”®^Li in methylamine at 230 K 131
6.2 The pair correlation functions for 0 2 and 8 MPM solutions o f ”®^Li in
methylamine at 230 K 133
6.3 The partial structure factors: a) H-H, b) X-H and c) X-X, for
0, 2 and 8 MPM lithium-methylamine solutions 136
6.4 The partial distribution functions: a) H-H, b) X-H and c) X-X, for
0 ,2 and 8 MPM lithium-methylamine solutions 139
6.5 Schematic illustration o f hydrogen-bonding in liquid methylamine 140
6.5 Gaussian fits to the real space functions (r) for 0, 2 and
8 MPM lithium-methylamine solutions 140
7.1 The structure factors Q*F{Q) for 0 ,2 , 8 and 22 MPM solutions
o f lithium in ammonia 149
7.2 The radial distribution functions for 0 ,2 , 8 and 22 MPM
lithium-ammonia solutions 154
7.3 An example o f Gaussian fit to the radial distribution 155
7.4 Gaussian fit to the feature at 2.01(3) Â in the y(r) for 22 MPM solution 157
8.1 Mean distance between electrons versus concentration 162
8.2 Free number o f solvent molecules per electron versus concentration 162
List of Tables
1.1 Properties o f ammonia and methylamine 2
1.2 Cation solvation properties in metal-ammonia solutions obtained
from compressibility measurements 19
1.3 Solvation properties obtained from various simulations 22
2.1 Values o f bound neutron scattering lengths 44
5.1 Summary o f the experimental parameters o f the solutions studied 106
5.2 The principal peak positions at the different concentrations 107
5.3 The intramolecular distances o f methylamine 112
5.4 The nearest neighbour peak positions and coordination numbers 113
5.5 The weighting coefficients for the 18MPM "^^LiiCDgND]
and *Li:CD3ND2 115
5.6 The weighting coefficients o f the different terms contributing
to the first order difference functions 119
6.1 The Faber-Ziman weighting coefficients for the 0 ,2 and
8 MPM ""'LiiCDsNDz solutions 128
6.2 The Faber-Ziman weighting coefficients for the 0, 2 and
8 MPM “ 'Li:CD3NH2 solutions 129
6.3 The peak positions in the real-space functions 134
6.3 The weighting coefficients o f the contributions to the X-H and X-X
factors for the 0 ,2 and 8 MPM lithium-methylamine solutions 141
6.4 Peak positions and peak area o f the Gaussian peaks in
gxxi^y^
146
7.1 Sample characteristics and the experimental parameters 150
7.2 Peak positions o f the X-ray structure factor 151
7.3 Details o f the first neighbour shell and the results o f Gaussian fittings 155
standard Symbols and Constants
Q Scattering (momentum transfer) vector
w Scattering angle
G Total scattering cross section
d a
Differential cross section dQ
4 Wavelength o f the incident beam
b Bound coherent neutron scattering length
X-ray scattering factor
/ ( 0 Measured intensity
Measured (static) total structure factor
Partial structure factor
J{r) Radial distribution function
G(r) Total pair distribution function
gab{r) Partial pair distribution function
ToF Time-of-flight
z Atomic number
e Electron charge, 1.602x10"^^ coulomb
trie Electron rest mass, 9.1095x10"^^ kg
rrip Proton rest mass, 1.672 x 10“^^ kg
Na Avogadro number, 6.022xlO^^mol"^
h Planck constant, 6.626 xlO'^'^Js
k Boltzmann constant, 1.3807x 10"^^ JK“^
Introduction
Solutions o f alkali metals in ammonia were first prepared by Sir Humphrey Davy in
1808 (Edwards, 1982). Since then, the resulting solutions have been at the centre o f
intense experimental and theoretical interest primarily because they exhibit a fascinating
variety o f properties, such as low density, high electrical conductivity, liquid-liquid
separation and metal-nonmetal transitions (Thompson 1976; Lepoutre 1984; Colloque
Weyl). In spite o f this enduring interest, covering almost two centuries, a detailed
understanding o f the microscopic nature o f these solutions remains elusive. For this
reason they are one o f the most studied liquids in condensed matter physics and electro
chemistry.
Knowledge o f the structural arrangement o f atoms and molecules in a material is
essential for a full understanding o f its physical and electrical properties (Howell 1996;
Soper 1997; Bowron et al 1998). This is especially true in the case o f metal-amine
solutions, as one would expect the microscopic and macroscopic properties to result
from a subtle balance between intermolecular solvent-solvent (hydrogen-bonding),
solvent-ion and solvent-electron interactions. However, literature records only one set o f
relevant diffraction experiments (Chieux and Bertagnolli 1984), and therefore there is a
pressing need for high-resolution structural measurements on metal-solutions. In this
thesis, I present the first extensive X-ray and neutron diffraction studies o f solutions o f
lithium in ammonia and methylamine. In particular, considerable improvements in
diffractometer performance and data analysis techniques in recent years have made it
possible to apply the technique o f isotopic labelling (H/D and in neutron
I
diffraction (Howell 1996; Soper 1997). Using this technique I have for the first time
established the local solvent-solvent and ion-solvent structure o f the metal-amine
solutions.
CHAPTER I. PROPERTIES OF METAL SOLUTIONS
CHAPTER 1
Properties of metal-solutions: Metal-Nonmetal
transition
1.1 Introduction
Ammonia and amines are polarizable liquids which are able to act as a solvent for a
variety o f solids, including alkali metals. The physical properties o f liquid ammonia and
methylamine are listed in table 1. The resulting solutions o f alkali metals dissolved in
ammonia and amines are generally referred to as metal-solutions*. These solutions are
intense blue and salt-like in the dilute concentration regime, and bronze-gold and
metallic in the concentrated regime (Thompson 1976). The solvation o f metals in these
solvents was first extensively studied by Kraus (1907, 1908, 1914, 1921). He showed
that the dissolution process resembles that o f salt in water and metals dissociated into
solvated electrons (anions) and solvated metal cations i.e.
M o M j + e " . (1.1)
* Other solvents such as ethers are also known to dissolve metals to yield metal-solutions, but
these solutions will not be discussed here.
1-CHAPTER 1. PROPERTIES O F METAL SOLUTIONS
Indeed, at infinite dilution, many o f the properties o f metal solutions have been
found to resemble those o f aqueous solutions (Thompson 1976). The solvation process
is reversible and takes place without chemical reaction, but metal-solutions are
metastable and in the presence o f impurities they may decompose to form the metal
amide and hydrogen i.e.
M J + N H 3 = i . M " ( N H - ) + i H , ( g ) . (1.2)
Metal-solutions, especially alkali metal-ammonia and lithium-methylamine
solutions, have been extensively studied because they exhibit a fascinating variety o f
physical and electrical properties (Lepoutre 1984). As a result, a vast number o f
experimental data already exist in the literature (Thompson 1976; Colloque Weyl). The
aim o f this chapter is therefore not to provide a comprehensive discussion o f each o f
these previous studies, but to give a basic overview and to discuss the data that are most
relevant to this work. Emphasis is placed on the similarities and differences between
metal-ammonia and metal-amine solutions. For a more detailed discussion the reader is
referred to the seminal book by Thompson (1976).
Ammonia, NH3 Methylamine, CH3NH2
Dielectric constant, e 16.5at293K 9.4at293K
Dipole moment (Debye) 1.847 1.479
Boiling Point (K) 239 266
Melting Point (K) 195 179
Density (gcm'^) 0.68at240K 0.75at220K
Table 1.1 Physical properties o f ammonia and methylamine (CRC 1994).
-2-CHAPTER I. PROPERTIES OF METAL SOLUTIONS
The phase diagrams o f Li-ammonia and Li-methylamine solutions are shown in
figure 1.1. Here, the concentration o f the solutions is expressed in units o f mole percent
metal (MPM), which is defined as (moles metal)/(moles metal+moles solvent)xlOO. In
simplified terms, the solutions can be classified into three regimes with significantly
different physical properties: I) dilute salt-like solutions, II) two coexisting liquids, and
III) concentrated metallic solutions. In Region II, a metal-solution phase separates into
immiscible dilute and concentrated solutions, with the concentrated phase floating on
top o f the dilute phase. This remarkable characteristic is one o f the most studied
properties o f metal-ammonia solutions, and it has been conceptually linked with the
Mott discontinuous metal-nonmetal transition (Thompson 1976; Mott 1990) - ""The
immiscibility o f concentrated and dilute solutions suggests that there is a discontinuity
in the number o f charge carriers due to a long range fluctuation in density
Figure L ia
240
Coexisting liquids
200
Solid NH3+ Solid Li(NHÿ^
^ 160
120
20
16 12
0 4 8
CHAPTER 1. PROPERTIES OF METAL SOLUTIONS
Figure L ib
250
200
g
1
2
150 &I
H 100
SoUd CH )NH 2 + Liqmd
SoUd CH3NH2 + Solid Li(CH)NH2)4
20
12 16
4 8
Concentration (MPM)
Figure 1.1 The phase diagrams of a) lithium-ammonia and b) lithium-methylamine solutions. The figures are taken from Thompson (1976) and Page et al (1994) respectively.
1.2 Dilute metal-solutions
Dilute metal-solutions have a characteristic blue colour, and in the very dilute regime (<10'^ MPM) one finds paramagnetic species ( and e~^ ). The absorption spectrum of dilute sodium-ammonia solutions (with the solvent contributions removed) is shown in figure 1.2. Similar optical absorption spectra with the long tail extending to high energies, which are responsible for the blue colour, are observed for all dilute
-4-CHAPTER 1. PRO PERTIES OF METAL SOLUTIONS
solutions. This solute and solvent independent absorption characteristic indicates the
presence o f common absorbing species in these systems, and has been suggested as one
o f the main pieces o f evidence for the existence o f solvated electrons. Jortner (1959,
1973) successfully demonstrated that a simple model o f an electron trapped in a cavity
o f radius ~3 to 4 Â (see figure 1.3) formed by four to six polarised solvent molecules
can be attributed to the broad absorption spectra. He proposed that the absorption is due
to the Is—>2s transition o f an electron in a spherically symmetric potential well
produced by this cavity. In metal-amine solutions, with the exception o f Li, there are
two additional absorption bands at higher energies that are dependent on the solute and
the solvent. These extra absorption bands in metal-amine solutions indicate that there
are metal dependent species that are not present in metal-ammonia solutions. Matalon,
Golden and Ottolenghi (1969) have characterised these bands and their results strongly
point to the existence o f species o f stoichiometry M‘; a pair o f electrons trapped at a
cation, in dilute metal-amine solutions.
As the concentration o f metal is increased (>10'^ MPM), the interactions
between solvated ions become significant and ion-pairing takes place. This is
particularly evident in metal-amine solutions, where the anion-cation interactions are
considerably stronger than in metal-ammonia solutions. The most widely accepted
models for ion-pair species are associated metal-electron pair types (See figure 1.4),
which may be illustrated by the following equation
M s " + e - -^ M j e -. (1.3)
As the concentration o f metal is further increased (10'^ —> 10^ MPM), various
experiments indicate spin-pairing takes place, leading to diamagnetic species
(Thompson 1976; Mott 1990). Although the formation o f diamagnetic species has been
widely known for many years, the exact nature o f diamagnetic species is still the subject
o f intense dispute {Colloque Weyl; Edwards 1984). The problem is that so many
-5-CHAPTER 1. PROPERTIES OF METAL SOLUTIONS
properties that are expected to be affected are in fact unaffected by the spin-pairing process (Thompson 1976). Proposed models o f spin-paired species are schematically illustrated in figure 1.4.
.o
2-0
6
0.2
0.6 1 0 1,4 1.8
Photon eneigy (eV)
Figure 1.2 Absorption spectrum due to solvated electrons in dilute sodium-ammonia solutions (Burow and Lagowski 1965). The high-energy tail is the source of the intense blue colour of dilute solutions.
^ 0.2
2 p
-2R
Figure 1.3 Jortner’s model of a solvated electron cavity and the wavefunction and energy levels o f solvated electrons (Jortner 1959). The arrows indicate the direction of dipole moments.
-6-CHAPTER 1. PROPERTIES OF METAL SOLUTIONS
Figure 1.4a Ion-paired species
(i) Loose ion-pair
\ /
(ii) Contact ion-pair
(iii) Monomer
(i) and (ii) electron-cation ion pairs (single electron cavity in association with a cation) and (iii) solvated metal ion.
(i) and (ii) are weakly associated electron-cation and (iii) is more tightly associated metal-dependent species.
Figure 1.4b Spin-paired species
iv) Bipolarons
v) Loose triple-ion
\ /
/ \
ii
/ \-7-CHAPTER 1. PROPERTIES OF METAL SOLUTIONS
(vi) Contact triple ion
(vii) M etal-anion
(iv) two electrons trapped in a single cavity, (v) and (vi) molecular dimers (a pair of single electron cavities in association with a cation) and (vii) metal anion.
(v) and (vi) are weakly associated electron-ion and (vii) is strongly metal dependent species.
Figure 1.4 Schematic representation of the proposed a) ion-paired and b) spin-paired species in dilute metal solutions (Edwards 1982).
1.2.1 Electrical and magnetic properties of dilute metal-solutions
Dilute metal solutions are ionically conducting, and have the electrical characteristics of ideal electrolytes. The diffusion coefficients for solvated electrons and cations in very dilute solutions have been measured by Catterall (1970)
D(e") = 2.6 6x l0^cm"s2„-l
D(Na*) = 4.66xlO-*cm"s-'.,2„-l
CHAPTER 1. PROPERTIES OF METAL SOLUTIONS
with the increasing concentration in a manner similar to that of aqueous solutions. The effect o f temperature and pressure on the conductivity has also been studied (Schindewolf et al 1966, 1967). The conductivity is an increasing function of temperature and a decreasing function of pressure. The temperature coefficient
d l n a / d T decreases with concentration and the pressure coefficient d l n a / d P is effectively independent of concentration. Both coefficients show a strong maximum at about 1 MPM.
%
Î
VO b *
I
I
o •
,2 10
• •
10
10-1 1
C oncentiation (MPM)
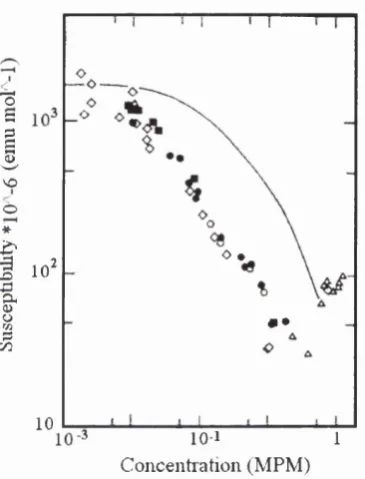
Figure 1.5 The measured spin susceptibility for Na (open symbols) and K (solid symbols) ammonia solutions at 240 K. The solid line represents the calculated free spin susceptibility (Cohen and Thompson 1968).
Figure 1.5 shows the molar spin susceptibilities for solutions of sodium and potassium in ammonia (Cohen and Thompson 1968). The solvent contribution, which is diamagnetic, has been removed from the measured susceptibility by the use o f the Wiedemann rule (Myers 1952). For concentrations below 10'^ MPM, the spin
-9-CHAPTER 1. PROPERTIES OF METAL SOLUTIONS
susceptibility tends to the calculated non-interacting free spin value (solid line).
However, above 10'^ MPM, the spin susceptibility begins to deviate from the free spin
value and it falls to about 20 per cent o f the free value at 0.1 MPM. This drop in
susceptibility is indicative o f spin-pairing taking place and suggests a transformation in
the nature o f the species from paramagnetic to diamagnetic. In contrast to this, the spin
susceptibility o f lithium-methylamine solutions (Stancy et al 1984; Nakayama et al
1984) shows only a slight deviation from the free spin values. Hence, the spin-pair
interactions in lithium-methylamine solutions are less pronounced than they are in
metal-ammonia solutions.
Electron spin resonance (ESR) and nuclear magnetic resonance (NMR)
techniques have been extensively used to study the nature o f metal solutions. Both
techniques have attracted considerable attention because they permit the study o f the
local environment o f constituent ions in metal solutions. Indeed, the current
understanding on the local electronic stmcture and the dynamics o f the constituent
species has been provided almost solely by the resonance experiments. For an
extensive review o f the resonance and susceptibility studies refer to Edwards (1984).
/V-
-/
/
K
“ / i ---♦
---/
/
/
f ---y --- - W r
Na
u
/
---4
---Ammonia Methylamine Ethylamine
Figure 1.6 The ESR spectra from solutions o f alkali metals in ammonia, methylamine
and ethylamine (Edwards 1984).
10-CHAPTER 1. PROPERTIES OF METAL SOLUTIONS
The ESR spectra o f ammonia, methylamine and ethylamine solutions are
illustrated in figure 1.6. Clearly, the characteristics o f the ESR spectrum are strongly
dependent on both the solvent and the solute. The ESR spectra o f metal-ammonia and
methylamine (except for Cs and Rb) solutions consists o f a single line with a g-factor
close to that o f the free electron value (2.0023). The line width is broader for heavier
metal-ammonia and metal-methylamine solutions, which reflects the increasing
importance o f the electron-cation interactions. For Rb-methylamine, Cs-methylamine
and metal-ethylamine solutions the ESR spectra consist o f multiple lines, showing that
the cation-electron interactions are sufficiently strong so that the relaxation time is long
enough (10‘* to lO'^s) to show resolved hyperfine coupling to the nucleus: For example,
the ESR spectrum o f lithium-ethylamine solutions is attributed to hyperfine coupling to
four equilivalent nitrogen nuclei. In these cases, more strongly interacting species, such
as M' have been proposed as the possible source o f the observed ESR spectrum.
In metal-solutions, the nuclear resonance line at the nitrogen, hydrogen and
metal nuclei shifts (Hughes 1963; O’Reilly 1964). This is known as a Knight shift,
which occurs as a result o f a slight change in the magnetic field at the nucleus caused by
the hyperfine coupling between unpaired electrons and the nucleus. The nitrogen Knight
shift in metal-ammonia and lithium-methylamine solutions shows that the total unpaired
spin density at nitrogen nuclei is independent o f concentration, hence independent o f the
ion-pairing and spin-pairing processes. The application o f nitrogen Knight shifts to the
study o f the solvent structure around the solvated electron is discussed in Edwards
(1984). In this paper, six and twelve solvent molecules for the first and second solvation
shell o f metal-ammonia solutions, and four solvent molecules for the first solvation
shell o f lithium-methylamine solutions have been estimated. Knight shifts at the metal
nuclei o f Li, Na, Rb and Cs o f metal-ammonia solutions have been measured by
O’Reilly (1964). The data o f very dilute solutions shows the absence o f a shift and thus
supports the model o f isolated species at infinite dilution. At higher concentrations.
-11-CHAPTER 1. PROPERTIES OF METAL SOLUTIONS
metal Knight shifts indicate a positive electron spin density on metal nuclei, which is indicative o f ion-pairing taking place.
1.2.2 Bulk properties of metal solutions
A number of bulk properties of metal solutions, such as density, vapour pressure, viscosity and compressibility, differ completely from those o f salt solutions. Here, these properties are discussed as knowledge of the bulk properties of metal solutions, especially the density and vapour pressure as a function of concentration and temperature, were essential for our experimental studies.
0-65
Na
^ 0 55
Concentration (IVIPM)
Figure 1.7 The density of solutions o f K, Na and Li in ammonia {Colloque Weyl //, P253).
O f all the bulk properties, the density of metal solutions is the most studied. On adding the metal, the density of the solution decreases with respect to that of the pure solvent (see figure 1.7). This effect is opposite to that observed for salt solutions, and therefore suggests that the reduction in the density is due to the accommodation of
-CHAPTER 1. PROPERTIES OF METAL SOLUTIONS
excess electrons. For a given concentration the density is lowest for lithium solutions: in
actual fact a saturated lithium-ammonia solution is the lightest liquid known at room
temperature, 0.477 gcm'^. The excess volume per mole*, AV, o f metal solutions remains
approximately constant up to 1 MPM (100 cm^mol'^) and then it increases slightly
above this concentration. Several researchers have assigned this expansion to the
formation o f a cavity around a solvated electron and have estimated the cavity size
(Jortner 1959; Cohen and Thompson 1968; Catterall and Mott 1969). These studies
reveal a cavity o f radius 3 to 4 A is required to account for the observed excess volume.
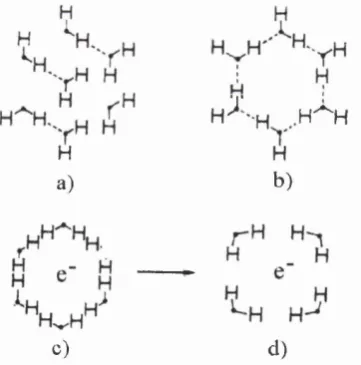
A schematic illustration o f electron solvation in a vacancy defect in liquid ammonia
(Bjerrum-type defect) proposed by Mott and Catterall (1969) is shown in figure 1.8.
According to this model, the electron solvation in ammonia is accompanied by an
increase in volume o f about three ammonia molecules per electron.
The viscosity and vapour pressure o f metal solutions are less than those o f the
pure solvent and they are a decreasing function o f concentration and temperature. Once
more, these trends are the opposite to those observed for salt solutions. The viscosity o f
metal-ammonia solutions varies with concentration in the following manner; at dilute
concentration, the fall is very slow, but at approximately 1 MPM it begins to fall more
rapidly. The rate o f fall then decreases around 10 MPM, and approaches a lowest value
at the saturated concentration. For lithium-ammonia solutions, this value is
approximately ten times lower than that o f a typical liquid metal. Similarly, the vapour
pressure o f concentrated metal-ammonia solutions is extremely low and its lowest value
is at the saturated concentration. In the case o f saturated lithium-ammonia solutions, this
value is as low as 393 Pa (Marshall 1962).
* AV = — — — ^ , where Vs is the solution volume, Vi is the volume o f the solvent, M
V2 is the volume o f the metal and M is the number o f moles o f metal
-13-CHAPTER 1. PROPERTIES OF METAL SOLUTIONS
The adiabatic compressibility has been determined by Bowen (1969) from the
measurements o f the sound velocity in dilute and concentrated metal-ammonia
solutions. The speed of sound is a decreasing function o f concentration, and it is
independent of cations in the dilute region. This suggests that in this region, the
structure is dominated by cation-independent species and supports the existence of the
solvated electron. Above 1 MPM, the sound speeds become dependent on cations, and
at any given concentration, their magnitude decreases with the increasing atomic
number of the cation. This cation-dependence has been interpreted as being due to a
difference in the solvation properties (coordination number and solvation radius) of
solutes. Thompson estimated the coordination number o f the solvated cation of each
case by choosing a value that gives the best fit to the compressibility measurements
(Thompson 1976). He treated the concentrated metal solutions as consisting o f free
solvent molecules, cations and delocalised electrons. The cation solvation number
yielded is 4, 4-5, 6 and 8 for Li, Na, K and Cs ammonia solutions respectively.
H^’-h H -H
H H
a) b)
c) d)
Figure 1.8 A schematic illustration of electron solvation in liquid ammonia: a) liquid
ammonia b) a vacancy defect found in liquid ammonia, c) Vacancy defect with an
electron, and d) formation o f a Bjerrum-type defect with solvent shell polarised around
the electron. Figure taken from Catterall and Mott (1969).
-CHAPTER 1. PROPERTIES OF METAL SOLUTIONS
1.3 Concentrated metal-solutions
In the concentration range 1-7 MPM, the electronic and bulk properties of
metal-ammonia solutions undergo dramatic changes, to yield metallic-bronze colour solutions.
One of the most notable changes that take place in this transition regime is a rapid
increase in the electrical conductivity cr (see figure 1.9). In the case o f highly
concentrated lithium-ammonia solutions (>20 MPM), the value o f cr (10^ cm"')
exceeds that of liquid mercury (10^^ Q"' cm’'). Kraus (1921) and Herzfeld (1927) were
the first to note that this transition is a metal-nonmetal (M-NM) transition and suggested
that the solvated electrons were delocalised in the metallic concentrated range.
Ü
s
2
a
o Li - Methylanmie 195 K A Li - Aiiuuoma 220 K
IQO IQi
Concentration (MPM)
Figure 1.9 The electrical conductivity
of solutions of Li in ammonia and in
methylamine (Cohen and Thompson
1968; Nakamura et al 1974).
-CHAPTER 1. PROPERTIES O F METAL SOLUTIONS
A M-NM transition also occurs in the concentration range between 14 to 16
MPM in lithium-methylamine solutions (see figure 1.9). However, the electrical
conductivity o f saturated lithium-methylamine solutions is about 400 Q'^cm'\ which is
about 40 times lower than that o f saturated metal-ammonia solutions and it lies just
above Mott’s minimum for metallic states -2 0 0 Q'^cm’^ (Thompson 1976). Moreover,
the colour o f lithium-methylamine solutions does not change from blue to
metallic-bronze, even at saturation. These observations imply a much stronger localisation o f
electrons in methylamine solutions than in metal-ammonia, and suggest that a metallic
state in lithium-methylamine solutions is o f a strongly scattering type.
Other properties o f concentrated metal solutions are briefly summarised below
i) The variation o f the conductivity with concentration in the concentrated region
is approximately proportional to (metal content)^, and is essentially independent
o f the cation.
ii) The electrical conductivity is an increasing function o f temperature (except for
caesium and very concentrated lithium solutions), and a decreasing function o f
pressure at all concentrations. The relationship between a and T, g and P are
approximately linear and these trends are opposite to those observed for typical
liquid metals.
iii) Hall effect measurements are rather limited, and data are only available for
metal-ammonia solutions with concentrations higher than 1 MPM (Kyser and
Thompson 1965; Nasby and Thompson 1968). The Hall coefficient, Rh^ in this
concentration range is independent o f temperature and tends to the calculated
free electron value for concentrations above 8 MPM. The Hall mobility,
PLh^RhO, o f lithium-ammonia solutions has been computed by Nasby and
-CHAPTER 1. PROPERTIES OF METAL SOLUTIONS
Thompson (1968). They found that jin is an increasing function o f concentration
and it increases most rapidly in the region 3 - 5 MPM.
iv) The thermoelectric power is a decreasing function o f concentration, and it is
negative except for sodium-ammonia solutions o f concentration higher than 14
MPM. The change in the sign o f the thermoelectric power is somewhat
unexpected, as the positive sign is normally attributed to positive charge carriers.
The magnitude o f the thermoelectric power for both sodium and potassium
ammonia solutions o f concentrations above 8 MPM is approximately equal to
the value expected if the electrons are free.
v) The Knight shifts o f protons (for both methyl and amine group) and ^Li in
solutions o f lithium in ammonia and methylamine increases with concentration.
The nuclear Li-spin relaxation rate obtained from the Knight shifts by the
Korringa relation (Korringa 1950) show a considerably larger enhancement in
lithium-methylamine than in lithium-ammonia solutions (Edwards et al 1980;
Nakamura et al 1984). This reflects fundamental differences in the electronic
state o f two solutions and suggests excess electron localisation at Li^ in
methylamine solutions (Nakamura e ta l 1984).
vi) The optical property o f metal-ammonia solutions begins to transform from blue
to a metallic bronze colour at about 2 MPM. Comparisons between the measured
optical constants and the Drude free electron theory (Drude 1900) show the that
optical transition becomes complete above 8 MPM.
It has been widely accepted that metal-ammonia solutions o f concentration
higher than about 9 MPM can be interpreted in terms o f a nearly free electron (NFE)
model that is comprised o f solvated cations, free solvent molecules and delocalised
electrons. This model is in line with each one o f the properties discussed above, with the
-CHAPTER 1. PROPERTIES O F METAL SOLUTIONS
exception o f the sign o f the thermoelectric power and the trends o f conductivity with
temperature and pressure. The Mott criterion for the metal-nonmetal transition: kpl ^ \ ,
where / is the mean free path, is met above 5 MPM, and reaches a value o f 30 at
saturation. The large mean free path is indicative o f the conduction process being
propagation rather than hopping. This is further supported by the Hall coefficient
measurements, which show that the Hall effect is independent o f temperature, thus
thermal hopping o f the charge carriers is unlikely. Furthermore, according to the Hall
mobility data, the free electron density increases from 1x10^^ cm'^ at 4 MPM to 4x10^^
cm'^ at saturation.
In contrast, the electrical properties o f concentrated lithium-methylamine
solutions are in many ways more like that o f liquid semiconductors. Indeed, Edwards
and Sienko (1980) have pointed out that electrical conduction in concentrated
lithium-methylamine solutions are best described in terms o f Brownian-like hopping o f weakly
interacting electrons. In this case, the mean free path becomes comparable with the
interatomic spacing and the NFE description is no longer appropriate. The observation
o f antiferromagnetic ordering occurring in a solid Li(CH3NH2)4 (Stancy et al 1982;
Nakamura et al 1984) further supports the weakly interacting electrons description o f
the concentrated lithium-methylamine solutions.
The solvation number and diameter o f the solvated cation complexes in
concentrated metal-ammonia solutions have been estimated from the conductivity
(self-diffusion coefficients) and compressibility measurements. Garroway and Cotts (1973)
predicted that both sodium and lithium solvated ions are in association with four
ammonia molecules and this number is essentially independent o f concentration. The
coordination number and diameter estimated by Thompson (1971, 1976) from the
compressibility data is shown in table 1.2. It should be noted that these values are
attained by the best-fit method o f the measured data and should not be relied upon as
the true values. Nevertheless, these studies provide support for the model which regards
-CHAPTER 1. PROPERTIES OF METAL SOLUTIONS
concentrated metal-ammonia solutions to be consisting o f strongly solvated cations, free
solvent molecules and delocalised electrons.
Solute Coordination number Diameter o f solvated ion
(A)
Li 4 6.30
Na 4 6.45
K 6 7.33
Cs 8 8.04
Table 1.2 Cation solvation properties in metal-ammonia solutions obtained from
compressibility measurements (Thompson 1976).
The theoretical interpretation o f the electrical properties o f concentrated
metal-ammonia solutions in terms o f the above model has been successfully carried out using
the Ziman theory (Ziman 1961, 1967). This theory describes the electrical properties o f
simple liquid and amorphous metals by treating the conduction electrons as plane
waves. Then the resistivity arises from two mechanisms: i) scattering from the effective
potentials o f atoms, and ii) weak coherent scattering from the constituent atoms. The
latter mechanism is simply related to the scattering factor F(Q) and therefore, according
to this theory, the resistivity is a function o f the structure factor o f scattering centres and
the atomic potential factor.
Ashcroft and Russakoff (1970) have obtained a satisfactory expression for the
conductivity o f concentrated metal-ammonia solutions by assuming that the sources o f
electron scattering are solvated cations and the dipole moment o f free ammonia
molecules. In this model, they have: i) used the cation-cation structure factor calculated
-CHAPTER 1. PROPERTIES O F METAL SOLUTIONS
by Schroeder and Thompson (1968); ii) assumed that the scattering o f electrons by
dipoles is independent o f the structure and is only proportional to the number o f free
ammonia molecules and iii) considered the angular dependent dipole potential function
as a source o f the scattering potential. They concluded that the decrease in the number
o f free ammonia molecules, i.e. unbound to cations, with concentration is a key reason
for the increase in the conductivity in the metallic region.
Thompson and Schroeder (Thompson 1976) have also successfully modelled the
concentrated metal solutions, but instead o f using the dipole potential, they used a
repulsive pseudopotential as in the case o f simple metals. The reason for this was
because they believed that the Coulomb repulsion o f electrons from the filled orbitals
would be significantly stronger than the dipole potential. Thus, the repulsive potential
would be the one needing to be considered. The pseudopotential factors which are
equilivalent to the form factors for the ammonia and solvated cation were established
empirically by treating 20 MPM lithium-ammonia solution as a single component
liquid: Li(NHs)4^. According to the analysis o f Thompson-Schroeder:
i) The increase in conductivity with concentration is due to a decrease in the
number o f free ammonia molecules and the increasing local order o f solutions.
They pointed out that if the solvation structure around the cation varies with
concentration and/or temperature, it could have a slight but significant effect on
the electrical properties.
ii) The observed temperature dependence o f the conductivity, da/dT^ can be
reproduced if the pseudopotential is represented by a temperature dependent
constant. The Thompson-Schroeder model requires a weakening o f the repulsion
potential with temperature for dc/dT to be positive.
-CHAPTER 1. PROPERTIES O F METAL SOLUTIONS
iii) The thermoelectric power is extremely sensitive to the choice o f pseudopotential
and no reliable agreement between the observed and calculated values was
reached with this model. They underlined this problem to the over-simplification
o f the potential used.
One o f the properties that does not show a marked change in the transition region is
the density o f the solution. The density data shows that the large increase in the volume
with increasing concentration continues to saturation. At first sight, this observation is
somewhat surprising because in the dilute regions the excess volume has been attributed
to the formation o f polaronic cavities. Thompson and Cohen (1968) explained these
increases by supposing that cavities are still forming in the metallic region, but with
large overlaps o f the electronic wavefunctions between the electrons in the cavities. In
this picture, the conduction then arises from excess electrons moving through a random
network o f overlapping polaronic cavities.
1.4 Structure of metal-solutions:
Simulations
Although metal-solutions have been studied extensively using a variety o f experimental
techniques (Thompson 1976; Colloque Weyl), the focus o f most studies has been on the
macroscopic nature o f the solutions, and very little is known about the microscopic
stmcture o f metal-solutions. Indeed, the literature records only one experiment which
studied directly the microscopic stmcture o f lithium-ammonia solutions (Chieux and
Bertagnolli 1984).
In contrast, over the past decade or so a considerable amount o f effort has been
devoted to modelling the electronic and solvation stmctures o f metal-solutions using a
wide range o f classical and quantum simulation techniques (Impey 1987; Hannongbua
-CHAPTER 1. PROPERTIES OF METAL SOLUTIONS
et al 1988; Deng et al 1992,1993,1994; Kerdcharoren et al 1996; Rizzo and Jorgensen
1999). The cation-solvation structural results obtained from various simulations o f
metal solutions are tabulated in table 1.3. Although the details o f these results are
clearly different, the basic results are qualitatively similar, i.e. cations are strongly
solvated by solvent molecules due to the strong electrostatic interactions between the
cation and the dipoles on solvent molecules. The nature o f excess electrons in liquid
ammonia has been studied recently using Car-Parrinello quantum simulation techniques
(Deng et al 1992, 1993, 1994). These studies have shown that in dilute metal ammonia
solutions, excess electrons can exist as either polarons or bipolarons (spin paired
species), with the polarons and bipolarons having a spherical shape o f about 3.0 Â and a
peanut-shape o f about 6.5 Â respectively.
Method Tmax (Â) Tmin (Â) n Temp (K)
Hot Spot (ab initio) [ 1 ] 2.15 3.20 4.0 235
Hot Spot (semi-empirical) [1] 2.42 3.14 6.0 235
MD (pair potential) [1] 2.15 2.60 6 235
MD (pair potential) [2] 2.20 2.53 6 235
MD (Li‘^-H2 0 potential) [3] 2.05 2.35 4 247
Monte Carlo (pair and 3-body potential) [2] 2.25 3.05 4.4 277
Monte Carlo (classical) [4] 2.05 • • • 4 260
Monte Carlo (Quantum path integral) [4] 2.05(5) 2-3 260
Table 1.3 Solvation properties obtained from various simulations o f Li ion in liquid
ammonia, where rmax is the first maximum Li-NHs distance, is the first minimum
Li-NH3 distance and n is the first shell Li-NHs coordination number. [1] - Kerdcharoen et
al (1996), [2] - Hannongbua et al (1992), [3] - Impey et al (1987) and [4] - Marchi et
a / (1990).
-CHAPTER 1. PROPERTIES OF METAL SOLUTIONS
1.5 Metal-nonmetal transition
In the previous sections we have seen that metal-solutions undergo a M-NM transition.
This section briefly discusses the mechanisms that have been proposed for the M-NM
transition in metal ammonia solutions (Mott 1975) and other disordered systems, such
as fluid mercury, metal oxides and doped semiconductors. For a detailed discussion o f
metal-nonmetal transitions the reader is referred to the excellent book by Sir Nevill
Mott (Mott 1990). It should be noted that establishing a theoretical concept for M-NM
transition is a complicated subject and it remains one o f the most outstanding problems
in condensed matter science (Mott 1982; Edwards and Rao 1985; Edwards et al 1995,
1998; Logan and Nozieres 1998).
The classification o f materials into insulators and conductors is simply done by
their value o f electrical conductivity i.e. materials with <7 in excess o f 10^ Q'^cm'’ are
classified as conductors and materials with c less than 1 0^ Q’^cm'^ are classified as
insulators. This implies that the valence electrons o f conductors are free (delocalised)
and the mean free path o f electrons in a conductor is long compared to its interatomic
spacing. In contrast, the valence electrons o f insulators are localised and their
wavefunctions are not spatially extended. Clearly therefore, a M-NM transition must be
accompanied by a major change in the electronic and physical properties o f the system
and the mechanism(s) responsible for this transition must somehow free (délocalisé) the
excess electrons on the transition from insulator to metal.
1.5.1 Mott transition: Screening
In 1949, Mott proposed the critical condition, now commonly known as the Mott
criterion, for a metal-nonmetal transition to occur in doped semiconductors which was
later extended to other systems, including metal-ammonia solutions. The Mott criterion
is expressed as:
-CHAPTER 1. PROPERTIES OF METAL SOLUTIONS
n ^ a „ > 0 .2 5 (1.4)
where tic is the critical density o f charge carriers, % = ^ y / * , is the effective
atomic length o f the localised centre, w* is the effective mass and e is the dielectric
constant o f the medium. This relatively simple condition is valid over a wide range o f
densities, «c, and has been shown to provide accurate predictions for metal-nonmetal
transitions to take place in a large number o f systems, including metal-ammonia
solutions (for metal-ammonia solutions, the Mott criterion is met above ~4 MPM
(Edwards and Sienko 1982)). In a simplified view, the Mott model considers the
competitions between the Coulomb interactions among the excess electrons and
localised centres and the screening o f these interactions: At a low electron
concentration, the Coulomb potentials are sufficiently strong that the excess electrons
are localised at positive centres and thereby the system is insulating. As the
concentration o f excess electrons is increased, the Coulomb (binding) potentials are
increasingly perturbed due to the screening effect, and eventually the electrons are
released and the system becomes metallic. Mott argued that this type o f mechanism
would give rise to a first-order transition in which the number o f charge carriers would
jump from zero to a finite value. Furthermore, he postulated that as a consequence o f
the discontinuity in the electron density, a kink in the free energy curve and a phase
separation should be observed at and near this type o f M-NM transitions (Mott 1990)
1.5.2 Herzfeld model: Polarization
The Herzfeld mechanism (Herzfeld 1927; Edwards et al 1998) considers the effect o f
the local field created by surrounding atoms (molecules) on an arbitrary atom.
According to this model, an insulator consists o f atoms with the polarizability olq and
the polarizability o f such a system can be expressed in terms o f the Claussius-Mossotti
relationship (Edwards and Sienko 1982):
-CHAPTER 1. PROPERTIES O F METAL SOLUTIONS
(n" +1) V
where n is the index o f reflection (the high frequency dielectric constant), R is the molar
reflectivity (4/3;z#CKo) and V is the molar volume. Herzfeld pointed out that as the
number density increases the ratio {R/V) will increase and when {R/V) = 1 the dielectric
constant will diverge to infinity (dielectric catastrophe), (n-\) = («+1) (Herzfeld 1927).
At this point excess electrons are totally released (ionised) by the local fields created by
surrounding atoms and a M-NM transition takes place. This type o f M-NM transition is
continuous since the dielectric constant diverges linearly as the density approaches the
critical value.
The Herzfeld model relates the electronic state o f systems with the
experimentally accessible properties R/V and this simple criterion (the system is
metallic for > 1 and nonmetallic for ^ <1) has been successfully applied by
Edwards and Sienko (Edwards and Sienko 1982) to classify the periodic elements into
metals and insulators. Furthermore, Hensel and Edwards (1996) have recently used the
Herzfeld model to obtain excellent estimates for the density at which metallization
occurs for fluid hydrogen and expanded alkali metals.
1.5.3 Percolation theory
In our discussion so far we have implicitly assumed the structure and composition o f
metal-ammonia solutions, except in the miscibility region, to be homogeneous on a
microscopic scale. However, this assumption has not been verified experimentally and
metal-ammonia solutions may exhibit compositional and structural inhomogeneities o f
the order o f tens or hundreds o f angstroms. Cohen and Jortner (1973, 1974) were the
first to consider such a view and they proposed that solutions in the M-NM transition
range consist o f an inhomogeneous mixture o f metallic (~9 MPM) and nonmetallic (-2