Study of transient temperature rise during coke burning and effect of coking on effective diffusivity of single zeolite SDX cracking catalyst pellet
Subhi A. Al -BayatyDepartment of Chemistry College of Science,Wasit University, Kut, Wasit, Iraq
ABSTRACT
This study comprises two sections dealing with separate aspects. First is the major part reports measurement of transient temperature rise during regeneration of coked zeolite SDX catalyst pellet. The pellets were instrumented with fine thermocouple wires with a junction situated at different radial location within the spherical pellets. From thermocouple profiles in the pellet with both position and time could be obtained. The effect initial temperature, oxygen concentration, coke concentration, and flow rate on maximum temperature rise during regeneration has been studied. In the second part, the effect of coke deposition on effective diffusivity of helium/nitrogen mixture in zeolite SDX is measured using the pulse modification of the standard Wicke-Kallenbach technique. Mercury prosimeter and nitrogen adsorption measurement have been used to determine the pore size distribution and micropore surface area of fresh and coked catalysts.
Keywords:- Regeneration, zeolite SDX, Transient temperature, Effective diffusivity, Coking
Introduction
The activity of zeolite catalyst declines due to coke deposition inside the pores, and formation of coke and its influence of the catalyst depend upon the characteristic and the nature of reactions. Several workers have been reported of this process [1-4]. In the recent years thermal gravimetric applied to study the behavior and kinetics of coke burnt off, coke converted completely to gas during oxidation in temperature range 339-511 Co [5-8]. It is important the measure the increase in temperature within a catalyst pellet during regeneration under transient condition to determine whether sintering of catalysts may become significant during regeneration process. Nacimento [9] studied the effect of different parameters on the maximum temperature rise; an interesting feature was the effect of heat treatment of coked catalysts in nitrogen stream for several hours. This treatment was found to reduce the maximum temperature in the pellet on regeneration. Hashimoto et al [10] reported temperature profiles during regeneration at very low oxygen concentration, the reaction observed to be isothermal. Schulz et al [11] concluded that the coke deposit inside zeolite pores consist two ring aromatic, meanwhile Karge et al [12] reported two kind of coke on zeolite catalyst first at low temperature coke consisted of oligomers of polymer, while the second at high temperature coke consist highly unsaturated polymeric aromatic. Other investigator [7] reported coke consist highly unsaturated polyaromatic with property similar to graphite. Several workers reported catalyst activity decline because of a progressive reduction in pore volume and mean pore radius, pore blockage, and decrease in diffusivity [13- 21]
Experimental and Discussion
Coking and regeneration
The reaction products were water vapor, carbon monoxide, and carbon dioxide. Water vapor was absorbed by passing the exit gas through silica gel and drierite. The dried gas was then passed through the Hopcalite bed to oxidize carbon monoxide to carbon dioxide. The initial coke concentration was evaluated by the following [22]
∫
Where y is percentage of carbon dioxide. Wt, weight of coke deposit, and F is average flow rate of regeneration gas. However the integral can be easily approximated by the trapezoidal rule.
Effect of initial temperature, oxygen concentration, coke concentration, and air flow rate on the regeneration temperature profiles within the coked pellets have been studied. The pellets contained Pt/Pt-13%Rh thermocouples of 0.025 mm diameter with junction situated at different location within the spherical pellets. From these thermocouples measurements the variation of the temperature profiles in the pellet with both position and time could be obtained. Table (1) gives details of overall experimental runs.
Table (1): Experimental details of regeneration coked zeolite SDX pellets Tg , Co Wt% Coke V% Oxygen Flow rate x 105, m3/sec ΔTmax , Co
450 1.30 21.0 0.833 20.0
500 1.30 21.0 0.833 21.0
540 1.30 21.0 0.833 24.0
560 1.30 21.0 0.833 30.0
580 1.30 21.0 0.833 34.0
560 1.30 3.15 0.833 10.0
560 1.30 8.40 0.833 21.8
560 1.30 16.8 0.833 26.0
560 1.30 21.0 0.833 30.0
560 1.70 21.0 0.833 42.0
560 2.06 21.0 0.833 54.0
560 2.38 21.0 0.833 70.0
560 1.30 21.0 1.660 35.0
560 1.30 21.0 5.000 33.0
560 1.30 21.0 8.330 27.0
Effect of initial temperature
Figure (1): Effect of initial temperature in the maximum temperature peak
Effect of oxygen concentration
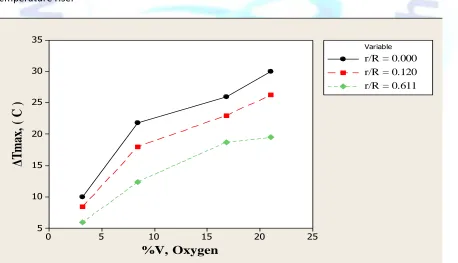
The effect of oxygen concentration on the maximum temperature rise was studied for various oxygen concentrations, at an initial temperature of 500 Co for 1.3 wt% of coke deposit. The oxygen concentration employed were 3.15, 8.4, 16.8, and 21 V% and the maximum temperature recorded in each case. A plot of the maximum temperature rise against oxygen concentration is presented in Fig. (2), shows that there is a significant relationship between oxygen concentration and maximum temperature rise.
Figure (2): Effect of oxygen concentration in the maximum temperature peak
580 560 540 520 500 480 460 440 35
30
25
20
15
10
Initial temperature, ( C )
Δ
T
m
a
x
,
(
C
)
r/R = 0.000 r/R =0.120 r/R = 0.611
Variable
25 20
15 10
5 0
35
30
25
20
15
10
5
%V, Oxygen
ΔT
m
ax
,
(
C
)
r/R = 0.000 r/R = 0.120 r/R = 0.611
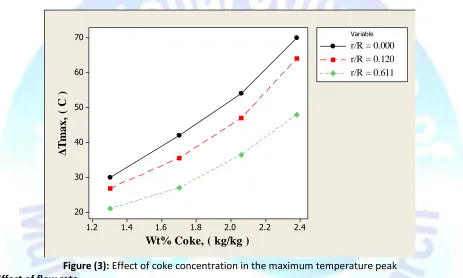
and higher coke concentration was found to give higher maximum temperature rises. The maximum temperatures observed are shown in Fig. (3) and confirm that the maximum temperature rise increases with increasing coke level. At 2.38 wt% coke the maximum temperature recorded was 70 Co, decreasing through at 2.06 wt% coke 54 Co, 42 Co at 1.7 wt% and finally at 1.3 wt% coke the maximum temperature rise was 30 Co . Carbon dioxide evolution from oxidizing coke on zeolite appears faster than silica alumina cracking catalyst; however this is because the coke in zeolite is deposited mainly in the larger macrospores and some mesopores. The transient temperature rise is attributed to the oxidizing of hydrogen at the beginning the course of reaction, whereas coke consists of carbon and hydrogen.
Figure (3): Effect of coke concentration in the maximum temperature peak
Effect of flow rate
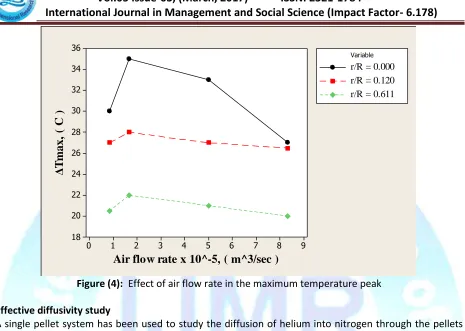
The effect of air flow rate on maximum temperature rise has been studied using different air flow rate. The experimental results are shown in Fig. (4). However, the flow rate range employed was 0.833 x 10⁻⁶ to 8.33 x 10⁻⁵ m3/sec. The maximum temperature rise was observed to increase with increasing air flow rates up to 1.66 x 10⁻⁵ m3/sec, with further increase beyond this level, the maximum temperature declined. At higher air flow rates the thickness of the gas film around the pellet would be reduced and hence the maximum temperature would increases. However, at sufficiently high flow rates the maximum recoded pellet temperature decreased due to the cooling effect of increased gas flow. Also at higher flow rates, the peak temperature occurred at earlier stages than when low flow rates were used.
2.4 2.2
2.0 1.8
1.6 1.4
1.2 70
60
50
40
30
20
Wt% Coke, ( kg/kg )
Δ
T
m
a
x
,
(
C
)
r/R = 0.000 r/R = 0.120 r/R = 0.611
Figure (4): Effect of air flow rate in the maximum temperature peak
Effective diffusivity study
A single pellet system has been used to study the diffusion of helium into nitrogen through the pellets using the pulse variation of the Wicke – Kallenbach technique [22]. The relation between effective diffusivity and temperature has been obtained by regression analysis and the results obtained suggest that the diffusion is occurring in the transition region.
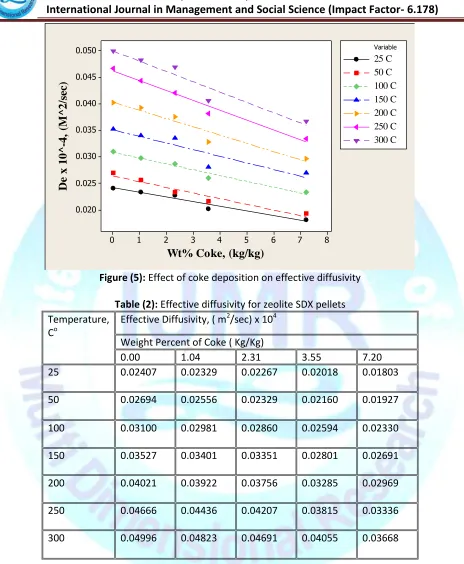
The result shown in Table (2) and Fig (5) indicates that coking does affect the effective diffusivity of the zolite catalyst pellets. The maximum amount of coke deposit on the pellet was 7.2 wt% and this reduced the effective diffusivity about 26%.
9 8 7 6 5 4 3 2 1 0 36
34
32
30
28
26
24
22
20
18
Air flow rate x 10^-5, ( m^3/sec )
Δ
T
m
a
x
,
(
C
)
r/R = 0.000 r/R = 0.120 r/R = 0.611
Figure (5): Effect of coke deposition on effective diffusivity
Table (2): Effective diffusivity for zeolite SDX pellets Temperature,
Co
Effective Diffusivity, ( m2/sec) x 104
Weight Percent of Coke ( Kg/Kg)
0.00 1.04 2.31 3.55 7.20
25 0.02407 0.02329 0.02267 0.02018 0.01803
50 0.02694 0.02556 0.02329 0.02160 0.01927
100 0.03100 0.02981 0.02860 0.02594 0.02330
150 0.03527 0.03401 0.03351 0.02801 0.02691
200 0.04021 0.03922 0.03756 0.03285 0.02969
250 0.04666 0.04436 0.04207 0.03815 0.03336
300 0.04996 0.04823 0.04691 0.04055 0.03668
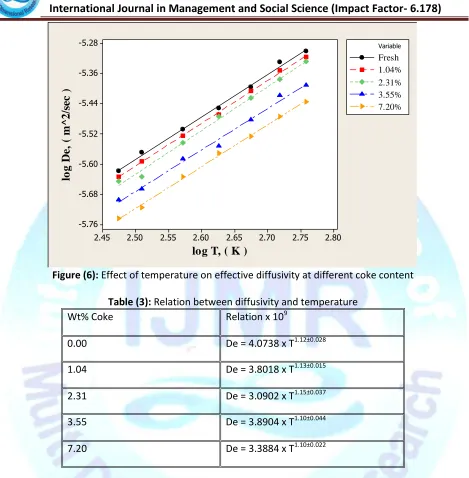
A log – log plot of diffusivity against temperature in Fig. (6) gave reasonably good straight lines, and the temperature exponent of the effective diffusivity are listed in Table (3).
8 7 6 5 4 3 2 1 0 0.045
0.040
0.035
0.030
0.025
0.020
Wt% Coke, (kg/kg)
D
e
x
1
0
^
-4
,
(M
^
2
/s
ec
)
Figure (6): Effect of temperature on effective diffusivity at different coke content
Table (3): Relation between diffusivity and temperature
Wt% Coke Relation x 109
0.00 De = 4.0738 x T1.12±0.028
1.04 De = 3.8018 x T1.13±0.015
2.31 De = 3.0902 x T1.15±0.037
3.55 De = 3.8904 x T1.10±0.044
7.20 De = 3.3884 x T1.10±0.022
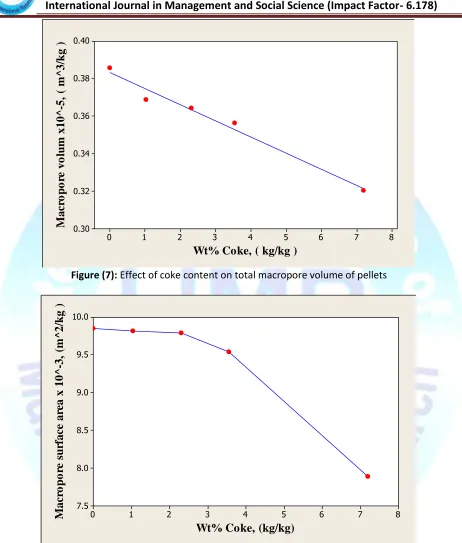
The reduction in total macropore volume of the pellet due to coking caused an appreciable decline in effective diffusivity as depicted in Fig. (7), where it can be seen that 7.2 wt% of coke caused a reduction of 18% in the total macropore volume of catalyst pellet. Coke deposited inside the large macropores and some mesopores, a reduction of about 11% occurs in the large macropores at 200 nm and no mesopores less than 10 nm are present at a coke deposition of 7.2 wt% and therefore these pores are not available for diffusion [13]. Consequently macro surface area decreases as shown in Fig. (8)
2.80 2.75 2.70 2.65 2.60 2.55 2.50 2.45 -5.28
-5.36
-5.44
-5.52
-5.60
-5.68
-5.76
log T, ( K )
lo
g
D
e,
(
m
^
2
/s
ec
)
Figure (7): Effect of coke content on total macropore volume of pellets
Figure (8): Effect of coke content on macropore surface area of pellets
Table (4) shows the physical property of fresh of coked catalyst, which obtained by using mercury prosimeter. 8 7 6 5 4 3 2 1 0 0.38 0.36 0.34 0.32 0.30
Wt% Coke, ( kg/kg )
M a cr o p o re v o lu m x 1 0 ^ -5 , ( m ^ 3 /k 8 7 6 5 4 3 2 1 0 10.0 9.5 9.0 8.5 8.0 7.5
Wt% Coke, (kg/kg)
Table (4): Shows the physical property of fresh and coked zeolite SDX catalyst pellet. %Wt Coke Macropore
surface area x10-3,
(m2/kg)
Macropore volume x 10-3, (m3/kg)
% Reduction in macropore volume
Macro porosity Total porosity
0.00 9.85 0.38593 0.0000 0.46875 0.49798
1.04 9.82 0.36900 1.6930 0.44818 0.47741
2.31 9.79 0.36421 5.6270 0.44236 0.47159
3.55 9.54 0.35647 7.6330 0.43296 0.46219
7.20 7.89 0.32044 16.969 0.38920 0.41843
Conclusions
Single pellet rector was used to study the regeneration of coke on zeolite SDX cracking catalysts. The effect of initial temperature, oxygen concentration, coke concentration, and flow rate on the measured temperature profiles was investigated. The maximum temperature rise was found to be sensitive mainly to coke concentration, oxygen concentration, and flow rate. The effect of coke deposition on effective diffusivity and total macrospore volume has been found to be significant. The variation of effective diffusivity with temperature showed that diffusion in fresh and coked pellet occurs in transition region. Therefore it seems coke is not a factor in shifting the diffusion process to another regime.
References
*1+ Derouane, E. G. and Gabelica, Z.,”J. Catal.”, Vol. 65, PP. (486), (1980). *2+ Olson, D. H., and Haag, W. O.,”ACS Sympos, Ser.”, Vol. 248, PP. (275), (1984).
*3+ Magnoux, P., Carfraud, P., Mignard, S., and Guisnet, M. J.,”J. Catal.”, Vol. 106, PP. (242), (1987). *4+ Wojciechowski, B. W., and Corma, A., “Catalytic Cracking”, Dekker, New York, (1986).
*5+ Sarkany, A., Lieske, H., Szilagyi, T., and Toth, L.,”8th Int. Congr. Catal.”, Berlin, Vol. 2, PP.9613), (1984). *6+ Webb, G., “Catal. Today”, Vol.7, PP. (139), (1990).
*7+ Li, C. L., Novaro, O., Bokhimi, X., “Catalysis Letters”, Vol. 65, PP. (209-216), (2000).
*8+ Ahmed, C. M., Sinnathambi, and Subbarao, D., “J. Applied. Sci.”, Vol. 11, No. 7, PP. (1225-1230), (2011). [9] Nacimento, C. A. O., Ph.D. Thesis, Salford University, (1982).
*10+ Hashimoto, K., Takatani, K., Iwasa, H., and Masuda, T., “Chem.Eng.J.”, Vol.27, PP. (177), (1983).
*11+ Schulz, Z., Siwei, and Baumgartner, W., “Catalyst Deactivation”, Delmon, B., and Froment, G. F. (Eds), Elsevier, Amsterdam, PP. (479), (1987).
*12+ Karge, H. G., Lange, J. P., Gutsze, A., and Laniecki, M. J.,”J. Catal. “, Vol. 114, PP. (144), (1988).
[13] Al –Bayaty S., Acharya D. R., Hughes R., “Applied Catalysis A: General”, Vol. 110, PP. (109-119), (1994). [14] Wood J., Goladden, L. F., “Applied Catalysis A: General”, Vol. 249, PP. (241-253), (2003).
*15+ Garcia Ochoa, and Santos A., “AIChE Journal”, Vol. 42, Issue 2, PP. (524-531), (1996).
*16+ Garcia Ochoa, and Santos A., “Chemical Engineering Science”, Vol. 49, Issue 18, PP. (3091-3102), (1994). *17+ Staffan Asplund, “Journal of Catalysis”, Vol. 158, Issue 1, PP. (267-278), (1996).
*18+ Chen D., Rebo H. P. , Moljord K., and Holmen A., “Ind. Eng. Chem. Res.”, Vol. 38, Issue 11, PP.(4241-4249), (1999).
[19] Sarah B., and Bala S., “AIChE Journal “, Vol. 38, Issue 7, PP. (1027-1037), (1992).
*20+ Chen D., Moljord K., Holmen A., “Microporous and Mesoporous”, Vol. 164, PP. (239-250), (2012).