THE INFLUENCE OF SHAPE
ON THE PROPERTIES OF PHARMACEUTICAL
PELLETS.
T h e sis p re se n te d for th e d eg ree o f D o c to r o f P h ilo so p h y in the F a c u lty o f M ed ic in e
o f the U n iv e rsity o f L o n d o n
R an jan a C h o p ra.
O c to b e r 1997
T h e S chool o f P h arm acy U n iv ersity o f L o n d o n 29 -3 9 B ru n sw ic k S q u are
ProQuest Number: 10104365
All rights reserved
INFORMATION TO ALL USERS
The quality of this reproduction is dependent upon the quality of the copy submitted.
In the unlikely event that the author did not send a complete manuscript and there are missing pages, these will be noted. Also, if material had to be removed,
a note will indicate the deletion.
uest.
ProQuest 10104365
Published by ProQuest LLC(2016). Copyright of the Dissertation is held by the Author.
All rights reserved.
This work is protected against unauthorized copying under Title 17, United States Code. Microform Edition © ProQuest LLC.
ProQuest LLC
789 East Eisenhower Parkway P.O. Box 1346
ABSTRACT
A common aim o f all pharmaceutical pelletization techniques is to produce good quality spheres o f uniform size with smooth surfaces to facilitate adequate performance in further processing such as capsule filling, film coating, and drug release. Although the need to work with uniform smooth spheres has been recognized in the literature, the full extent o f the influence o f shape on the properties o f pellets has not been investigated directly.
Batches o f pellets were produced using different techniques such as extrusion- spheronisation and granulation, with the same basic formulation but differing slightly to manipulate shape and surface properties o f the end product. The pellets were then film coated with different thicknesses o f insoluble polymer coating.
The shapes of the different pellet batches were determined using the relatively new shape factors Cc3 (three-dimensional) and Or (two-dimensional), as well as more conventional shape descriptors such as Heywood’s and aspect ratios.
The pellets were characterized in terms o f internal structure, external features and evaluated by studying drug release and capsule filling performance. Commonly used techniques such as mercury penetration for determining porosity and air permeametry for studying surface area were employed, and also novel methods such as laser profilimetry for characterizing surface roughness o f pellets.
ACKNOWLEDGEMENTS
I would like to acknowledge all those who have helped me along the path to completing this thesis. In particular my thanks must go to:
Professor Newton for his absolute guidance for so many years, for always being able to put me back on the right track again, and for his understanding.
Dr.Podczeck for always finding time to help me, and for being so patient when I was being my ‘paranormal’ self.
Professor Christer Nystrom for allowing me to join the Pharmaceutics Department of Uppsala University for a wonderful year.
Professor Goran Alderbom for all his help during my time spent in Uppsala, and for including me so completely in his research group.
All my friends and colleagues in Uppsala, for making it so difficult for me to leave!
Professor Jon Sjogren o f Astra Hassle for his interest in this project and for arranging funding for the work in Sweden.
Mats Johansson for taking me under his wing whilst I was at Astra Hassle, and Jorgen Lindqvist for his help with the bisecting and photographing o f pellets.
Dr.Seyfang o f Pharmakapsel for organizing the capsule filling studies done in Germany, and Mr.Kâfer o f Harro Hofliger for his time and help whilst I was there.
My friends in London and everywhere, for sticking by me all these years, you know who you are!
TABLE OF CONTENTS
Page number
Title page 1
Abstract 2
Acknowledgements 3
Dedication 4
Table o f contents 5
List o f tables 9
List o f figures 16
List o f symbols and abbreviations 20
Chapter One : Introduction 24
1.1 Pellets as multiparticulate dosage forms 24
1.2 The size o f pellets 26
1.3 The shape o f pellets 29
1.4 The surface roughness o f pellets 35
1.5 The density o f pellets 39
1.6 The porosity o f pellets 41
1.7 The surface area o f pellets 43
1.8 The coating o f pellets 47
1.9 The filling o f pellets into capsules 50
1.10 Aims o f this work 54
Chapter Two: Materials and Methods 55
2.1 Materials used in the basic pellet formulation 55
2.2 Production o f pellets 56
2.2.1 Mixing 56
2.2.2 Extrusion 56
2.2.2.1 ACER 2000 56
2 2 2 2 Ram extruder 57
2.2.4 Spheronisation 58
2.2.5 Drying 58
2.3 Fluidized-bed film coating o f pellets 58
2.3.1 Selection o f coating solution 58
2.3.2 Coating equipment and process parameters 59
2.3.3 Coating procedure 59
2.4 Characterization o f pellets 59
2.4.1 Size 59
2.4.1.1 Sieve analysis 59
2.4.1.2 Ring gap sizing 60
2.4.1.3 Image analysis 60
2.4.1.3.1 Dimensions o f pellets 60
2.4.1.3.2 Coat thickness 61
2.4.2 Shape 61
2.4.2.1 Visual assessment 61
2.4.2.2 Scanning electron microscopy 61
2.4.2.3 Two dimensional image analysis using
shape factor eR 61
2.4.2.4 Three dimensional image analysis using
the shape factor Cc3 62
2.4.3 Density 63
2.4.3.1 Bulk/tapped density studies 63
2.4.3.2 Apparent density studies 63
2.4.3.3. Effective density studies 64
2.4.4 Porosity measurements 64
2.4.5 Surface area measurements 66
2.4.6 Surface roughness 67
2.4.6.1 Roughness by image analysis 67
2.4.6.2 Laser profilimetry 67
2.4.7 Drug release characteristics 68
2.5 Filling o f pellets into capsules 69
Chapter Three: Results and Discussion 71
3.1 Production o f pellets 71
3.1.1 Preliminary investigations 71
3.1.2 Selection o f final batches for further work 71
3.2 Coating o f pellets 89
3.2.1 Selection o f coating solution 89
3.2.2 Selection o f process parameters 89
3.3 Characterisation o f pellets 90
3.3.1 Size 90
3.3.1.1. Sieve analysis 90
3.3.1.2 Ring gap sizing 90
3.3.1.3 Image analysis 91
3.3.1.3.1 Dimensions o f pellets 91
3.3.1.3.2 Coat thickness 92
3.3.2 Shape 94
3.3.2.1 Two dimensional image analysis 94 3.3.2.2 Three dimensional image analysis 101 3.3.2.3 Heywood’s shape coefficients 114
3.3.3 Density 122
3.3.3.1 Bulk/tapped density 122
3.3.3.2 Apparent/true density 126
3.3.3.3 Effective density 129
3.3.4 Porosity 130
3.3.5 Surface area 132
3.3.6 Surface roughness 136
3.3.6.1 Image analysis 136
3.3.6.2 Laser profilimetry 137
3.4 Capsule filling 150
3.5 Drug release profiles 164
Chapter Four: General Discussion 184
4.1 Morphological studies 184
4.3 Surface studies 187
4.4 Pellet performance 189
4.5 Relationships between different pellet properties 191
Chapter Five: Conclusions 196
Appendix 199
LIST OF TABLES
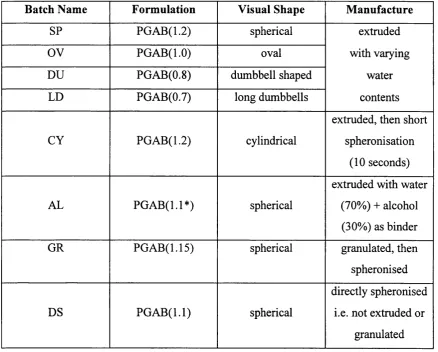
Page 3.1 Summary o f the eight batches chosen for further work, with
P=paracetamol, G=giyceryl monostearate, A=Avicel P H I01®, B==barium sulphate and the number within brackets ( ) indicating the
ratio o f water to Avicel. 72
3.2 The thickness o f pellet formulations (uncoated and final coated) as
determined by the ring gap sizer. 90
3.3 Coat thickness assessed by dimensional changes from image analysis. 92 3.4a Changes in shape (2-dimensional) o f the SP batch o f granules as a
function o f coating level, showing means and standard deviations. 94 3.4b ANOVA for the eR results shown in table 3.4a showing values where F
is significant. 95
3.5a Changes in shape (2-dimensional) for the AL batch o f pellets as a
function o f coating level, showing means and standard deviations. 96 3.5b ANOVA for the eR results shown in table 3.5a showing values where F
is significant. 96
3.6 Changes in shape (2-dimensional) for the GR batch o f pellets as a
function o f coating level, showing means and standard deviations. 97 3.7 Changes in shape (2-dimensional) for the DS batch o f granules as a
function o f coating level, showing means and standard deviations. 97 3.8 Changes in shape (2-dimensional) for the GY batch o f pellets as a
function o f coating level, showing means and standard deviations. 98 3.9a Changes in shape (2-dimensional) for the DU batch o f pellets as a
function o f coating level, showing means and standard deviations. 98 3.9b ANOVA for the results shown in table 3.9a showing the significant
F values. 99
3.10a Changes in shape (2-dimensional) for the LD batch o f pellets as a function o f coating level, showing means and standard deviations. 99 3.10b ANOVA for the eR results shown in table 3.10a showing significant
3.11 Changes in shape (2-dimensional) for the CY batch o f pellets as a function o f coating level, showing means and standard deviations. 100 3.12 ANOVA for the shape factor cr o f all uncoated pellet batches showing the
significant F values. 101
3.13a Changes in shape (3-dimensional) for SP batch o f pellets as a function o f coating level, showing means and standard deviations. 102 3.13b ANOVA o f shape factor Cc3 results shown in table 3.13a showing the
significant F values. 102
3.13c ANOVA o f ellipticity results shown in table 3.13a showing the
significant F values. 102
3.13d ANOVA o f roughness results shown in table 3.13a showing the
significant F values. 103
3.14a Changes in shape (3-dimensional) for AL batch o f pellets as a function
o f coating level, showing means and standard deviations. 104 3.14b ANOVA o f shape factor Ccs results shown in table 3.14a showing the
significant F values. 104
3.14c ANOVA o f ellipticity results shown in table 3.14a showing the
significant F values. 104
3.14d ANOV A o f roughness results shown in table 3.14a showing the
significant F values. 105
3.15a Changes in shape (3-dimensional) for GR batch o f pellets as a function o f coating level, showing means and standard deviations. 105 3.15b ANOVA o f roughness results shown in table 3.15a showing the
significant F values. 105
3.16a Changes in shape (3-dimensional) for DS batch o f pellets as a function o f coating level, showing means and standard deviations. 106 3.16b ANOVA o f shape factor Cc3 results shown in table 3.16a showing the
significant F values. 106
3.16c ANOVA o f ellipticity results shown in table 3.16a showing the
significant F values. 106
3.16d ANOVA o f roughness results shown in table 3.16a showing the
3.17a Changes in shape (3-dimensional) for OV batch o f pellets as a function of coating level, showing means and standard deviations. 107 3.17b ANOVA o f shape factor Cc3 results shown in table 3.17a showing the
significant F values. 107
3.17c ANOVA o f ellipticity results shown in table 3.17a showing the
significant F values. 108
3.18a Changes in shape (3-dimensional) for DU batch o f pellets as a function o f coating level, showing means and standard deviations. 108 3.18b ANOVA o f shape factor Cc3 results shown in table 3.18a showing the
significant F values. 108
3.18c ANOVA o f ellipticity results shown in table 3.18a showing the
significant F values. 109
3.18d ANOVA o f roughness results shown in table 3.18a showing the
significant F values. 109
3.19a Changes in shape (3-dimensional) for LD batch o f pellets as a function of coating level, showing means and standard deviations. 109 3.19b ANOVA o f shape factor Cc3 results shown in table 3.19a showing the
significant F values. 110
3.19c ANOVA o f ellipticity results shown in table 3.19a showing the
significant F values. 110
3.20a Changes in shape (3-dimensional) for CY batch o f pellets as a function o f coating level, showing means and standard deviations. 111 3.20b ANOVA o f shape factor Cc3 results shown in table 3.20a showing the
significant F values. 111
3.20c ANOVA o f ellipticity results shown in table 3.20a showing the
significant F values. 111
3.21a ANOVA o f shape factor Cc3 results o f all uncoated batches showing
significant F values. 112
3.21b ANOVA o f ellipticity results o f all uncoated batches showing significant
F values. 112
3.21c ANOVA o f roughness results for all uncoated batches showing significant
3.22 ANOVA o f shape factor Cc3 results for all final coat batches (coat 5)
showing significant F values. 113
3.23a Heywood’s volume coefficient, k, as a function o f coating level,
calculated using dimensions measured by image analysis. 115 3.23b ANOVA o f Heywood’s volume coefficient, (k), for all uncoated pellets
showing significant F values (F table?,200 = 4.02). 116 3.23c ANOVA o f Heywood’s volume coefficient, (k), for all coat 2 pellet
batches showing significant F values. 116
3.23d ANOVA o f Heywood’s volume coefficient, (k), for all coat 3 pellet
batches showing significant F values. 116
3.23e ANOVA o f Heywood’s volume coefficient, (k), for all final coated
batches (coat 5) showing significant F values. 117 3.24a Heywood’s surface coefficient, f, for all batches as a function o f coating
level, calculated using dimensions measured by image analysis. 117 3.24b ANOVA o f Heywood’s surface coefficient, (f), for all uncoated pellet
batches showing significant F values. 117
3.24c ANOVA of Heywood’s surface coefficient, (f), for all coat 1 pellet
batches showing significant F values. 118
3.24d ANOVA o f Heywood’s surface coefficient, (f), for all coat 2 pellet
batches showing significant F values. 118
3.24e ANOVA o f Heywood’s surface coefficient, (f), for all coat 3 pellet
batches showing significant F values. 118
3.24f ANOVA o f Heywood’s surface coefficient, (f), for all coat 4 pellet
batches showing significant F values. 119
3.24g ANOVA o f Heywood’s surface coefficient, (f), for all coat 5 pellet batches
showing significant F values. 119
3.25 Heywood’s surface to volume ratio (f/k) for all pellet batches as a function
o f coating level. 120
3.26 Heywood’s shape coefficients for uncoated and final coated pellets, calculated using thickness values measured by ring gap sizing and
length and breadth values by image analysis. 120
3.27b ANOVA o f bulk density at 1000 taps for uncoated pellet results shown
in table 3.27a. 123
3.27c ANOVA o f the bulk density at 1000 taps for coated pellet results in table
3.27a. 123
3.28 Apparent densities o f the raw materials used in pellet formulations. 126 3.29a Measured apparent densities o f uncoated and fully coated pellets. 127 3.29b ANOVA o f the results in table 3.29a for uncoated whole pellets. 127 3.29c ANOVA o f the results in table 3.29a for uncoated crushed pellets. 127 3.29d ANOVA o f the results in table 3.29a for coated pellets (coat 5). 128 3.30a Effective densities o f uncoated and coated pellets determined by mercury
penetration (n=3). 129
3.30b ANOVA o f the results in table 3.30a for coated pellets. 129
3.31a Porosities for uncoated pellets. 131
3.31b ANOVA o f the results in table 3.31a. 131
3.32a Surface areas o f uncoated (U) and fully coated (C) pellets. 134 3.32b ANOVA o f surface area by volume results for uncoated pellets. 135 3.32c ANOVA o f surface area by weight results for uncoated pellets. 135 3.32d ANOVA o f surface area by volume results for coated (coat 5) pellets. 135 3.32e ANOVA o f surface area by weight results for coated (coat 5) pellets. 135 3.33 Roughness measured by image analysis for uncoated and fully coated
pellets. 137
3.34a Surface roughness parameters for uncoated pellets expressed as the means
and standard deviations. 137
3.34b ANOVA o f Rq values for uncoated pellets. 146
3.34c ANOVA o f Ra values for uncoated pellets. 146
3.34d ANOVA o f Rtm values for uncoated pellets. 147
3.34e ANOVA o f Rt values for uncoated pellets. 147
3.35 Comparison o f surface roughness with and without a gold sputtered layer. 147 3.36 Surface roughness parameters for coated pellets o f all batches (coat 5). 148 3.37 Surface roughness parameters after dissolution o f coated pellets. 148 3.38 Indicating the batches where coated pellets were significantly rougher
3.39 Results o f check weighing capsules filled with uncoated pellet batches. 151 3.40 Results o f check weighing capsules filled with coated pellet batches. 152 3.41 ANOVA o f the MDT, AUC and VDT for all uncoated pellets showing
the values where F is significant. 176
3.42 ANOVA o f the MDT, AUC and VDT for coat 1 o f all batches showing
the values where F is significant. 176
3.43 ANOVA o f the MDT, AUC and VDT for coat 2 o f all batches showing
the values where F is significant. 177
3.44 ANOVA o f the MDT, AUC and VDT for coat 3 o f all batches showing
the values where F is significant. 177
3.45 ANOVA o f the MDT, AUC and VDT for coat 4 o f all batches showing
the values where F is significant. 178
3.46 ANOVA o f the MDT, AUC and VDT for coat 5 o f all batches showing
the values where F is significant. 178
3.47 ANOVA o f the MDT, AUC and VDT for all SP batches showing the
values where F is significant. 179
3.48 ANOVA o f the MDT, AUC and VDT for all AL batches showing the
values where F is significant. 179
3.49 ANOVA o f the MDT, AUC and VDT for all GR batches showing the
values where F is significant. 180
3.50 ANOVA o f the MDT, AUC and VDT for all DS batches showing the
values where F is significant. 180
3.51 ANOVA o f the MDT, AUC and VDT for all OV batches showing the
values where F is significant. 181
3.52 ANOVA o f the MDT, AUC and VDT for all DU batches showing the
values where F is significant. 181
3.53 ANOVA o f the MDT, AUC and VDT for all LD batches showing the
values where F is significant. 182
3.54 ANOVA o f the MDT, AUC and VDT for all CY batches showing the
values where F is significant. 182
A1 Mean dimensions (± standard deviation) o f all pellet batches as measured
A2 Dissolution parameters measured for SP pellet batches; AUC = area under the curve, MDT = mean dissolution time (in minutes for uncoated batches and in hours for coated batches), VDT = variation
in dissolution time, RD = dispersion coefficient. 200 A3 Dissolution parameters measured for AL pellet batches; AUC = area
under the curve, MDT = mean dissolution time (in minutes for uncoated batches and in hours for coated batches), VDT = variation
in dissolution time, RD = dispersion coefficient. 201 A4 Dissolution parameters measured for GR pellet batches; AUC = area
under the curve, MDT = mean dissolution time (in minutes for uncoated batches and in hours for coated batches), VDT = variation
in dissolution time, RD = dispersion coefficient. 202 A5 Dissolution parameters measured for DS pellet batches; AUC = area
under the curve, MDT = mean dissolution time (in minutes for uncoated batches and in hours for coated batches), VDT = variation
in dissolution time, RD = dispersion coefficient. 203 A6 Dissolution parameters measured for OV pellet batches; AUC = area
under the curve, MDT = mean dissolution time (in minutes for uncoated batches and in hours for coated batches), VDT = variation
in dissolution time, RD = dispersion coefficient. 204 A7 Dissolution parameters measured for DU pellet batches; AUC = area
under the curve, MDT = mean dissolution time (in minutes for uncoated batches and in hours for coated batches), VDT = variation
in dissolution time, RD = dispersion coefficient. 205 A 8 Dissolution parameters measured for LD pellet batches; AUC = area
under the curve, MDT = mean dissolution time (in minutes for uncoated batches and in hours for coated batches), VDT = variation
in dissolution time, RD = dispersion coefficient. 206 A9 Dissolution parameters measured for CY pellet batches; AUC = area
under the curve, MDT = mean dissolution time (in minutes for uncoated batches and in hours for coated batches), VDT = variation
LIST OF FIGURES
Page 1.1 Shape changes during the spheronisation process. 26
1.2 Two types o f statistical diameters. 27
1.3 A line scan o f a surface profile. 38
1.4 Piston method for filling capsules with pellets. 51 1.5 Double slide method for filling capsules with pellets. 52 1.6 Piston and slide method for filling capsules with pellets. 52 2.1 The two positions from which the image analysis measurements were
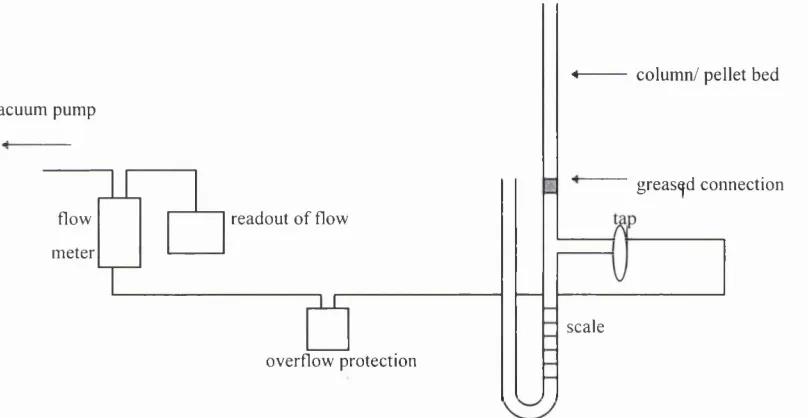
made by turning the sample holder through 90 degrees. 63 2.2 Diagram o f the pycnometer used in porosity determinations. 65 2.3 Diagram o f the steady-state permeametry apparatus used in determining
surface area. 66
2.4 Pellet filling station on the KFM III capsule filling and closing machine. 69
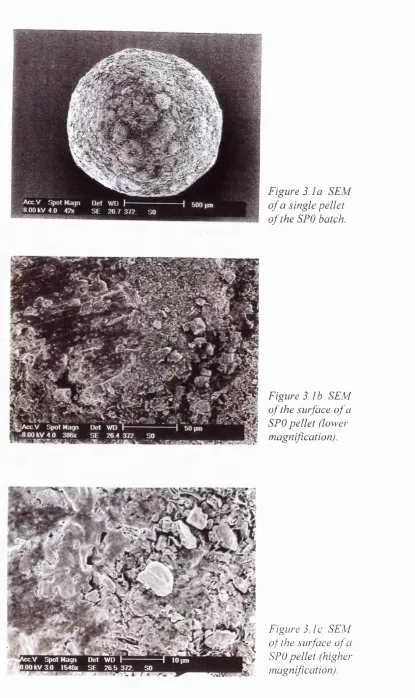
3.1a SEM o f a single pellet o f the SPG batch. 73
3.1b SEM o f the surface o f a SPG pellet (lower magnification). 73 3.1c SEM o f the surface o f a SPG pellet (higher magnification). 73
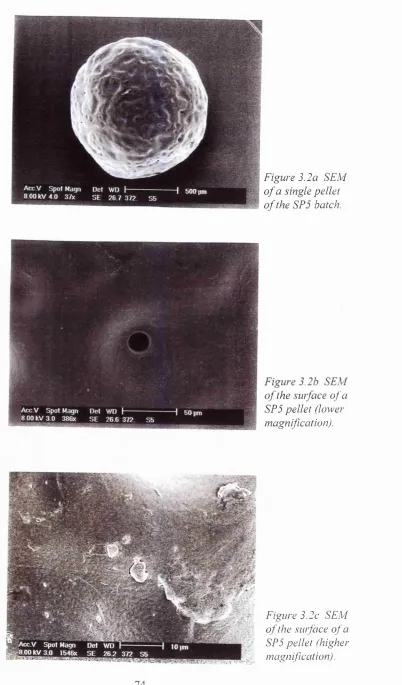
3.2a SEM o f a single pellet o f the SP5 batch. 74
3.2b SEM o f the surface o f a SP5 pellet (lower magnification). 74 3.2c SEM o f the surface o f a SP5 pellet (higher magnification). 74
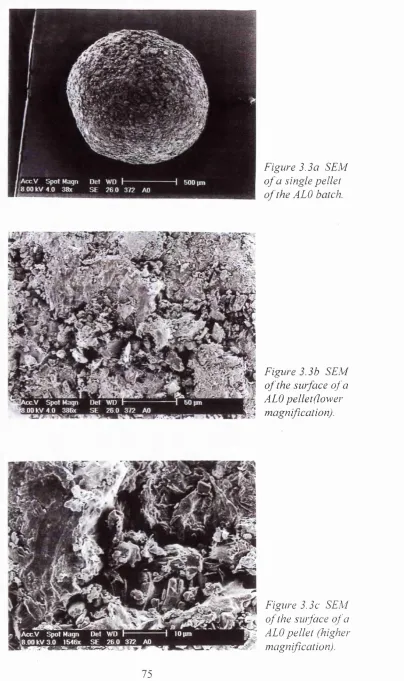
3.3a SEM o f a single pellet o f the AEG batch. 75
3.3b SEM o f the surface o f an AEG pellet (lower magnification). 75 3.3c SEM o f the surface o f an AEG pellet (higher magnification). 75
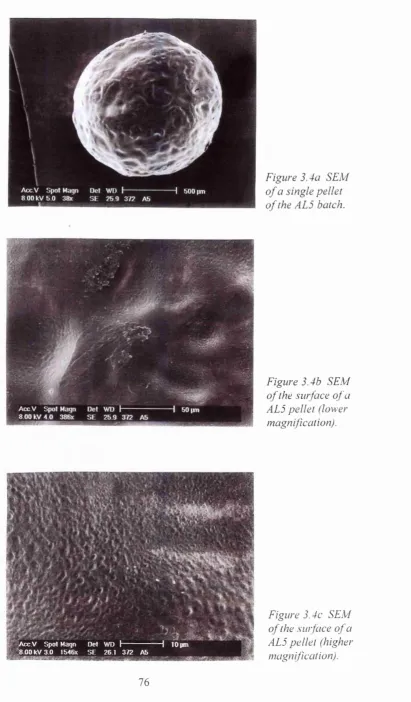
3.4a SEM o f a single pellet o f the AE5 batch. 76
3.4b SEM o f the surface o f an AE5 pellet (lower magnification). 76 3.4c SEM o f the surface o f an AE5 pellet (higher magnification). 76
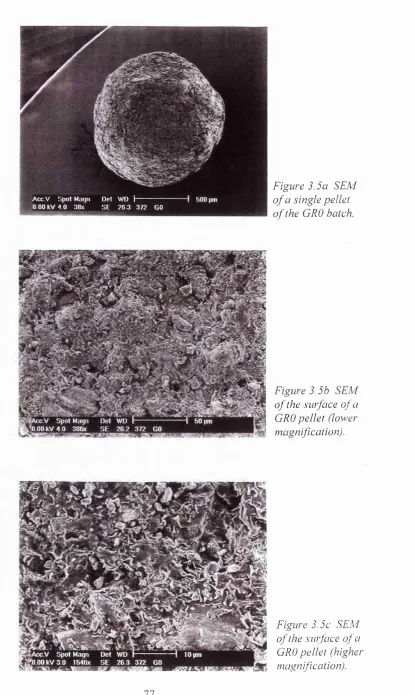
3.5a SEM o f a single pellet o f the GRG batch. 77
3.5b SEM o f the surface o f a GRG pellet (lower magnification). 77 3.5c SEM o f the surface of a GRG pellet (higher magnification). 77
3.6a SEM o f a single pellet o f the GR5 batch. 78
3.7a SEM o f a single pellet o f the DSO batch. 79 3.7b SEM o f the surface o f a DSO pellet (lower magnification). 79 3.7c SEM o f the surface o f a DSO pellet (higher magnification). 79
3.8a SEM o f a single pellet o f the DS5 batch. 80
3.8b SEM o f the surface o f a DS5 pellet (lower magnification). 80 3.8c SEM o f the surface o f a DS5 pellet (higher magnification). 80
3.9a SEM o f a single pellet o f the OVO batch. 81
3.9b SEM o f the surface of a OVO pellet (lower magnification). 81 3.9c SEM o f the surface o f a OVO pellet (higher magnification). 81
3.10a SEM o f a single pellet o f the OV 5 batch. 82
3.10b SEM o f the surface o f a OV 5 pellet (lower magnification). 82 3.10c SEM o f the surface o f a 0V 5 pellet (higher magnification). 82
3.11a SEM o f a single pellet o f the DUO batch. 83
3.11b SEM o f the surface o f a DUO pellet (lower magnification). 83 3.11c SEM o f the surface o f a DUO pellet (higher magnification). 83
3.12a SEM o f a single pellet o f the DU5 batch. 84
3.12b SEM o f the surface o f a DU 5 pellet (lower magnification). 84 3.12c SEM o f the surface o f a DU5 pellet (higher magnification). 84
3.13a SEM o f a single pellet o f the EDO batch. 85
3.13b SEM o f the surface o f a EDO pellet (lower magnification). 85 3.13c SEM o f the surface o f a EDO pellet (higher magnification). 85
3.14a SEM o f a single pellet o f the ED5 batch. 86
3.14b SEM o f the surface o f a ED5 pellet (lower magnification). 86 3.14c SEM o f the surface o f a ED5 pellet (higher magnification). 86
3.15a SEM o f a single pellet o f the CYO batch. 87
3.15b SEM o f the surface o f a C Y0 pellet (lower magnification). 87 3.15c SEM o f the surface o f a CY 0 pellet (higher magnification). 87
3.16a SEM o f a single pellet o f the CY5 batch. 8 8
3.16b SEM o f the surface o f a CY 5 pellet (lower magnification). 88 3.16c SEM o f the surface o f a CY 5 pellet (higher magnification). 88 3.17a A series o f negatives showing sections o f bisected pellets o f SPl - SP5
3.17b A series o f negatives showing sections o f bisected pellets o f LD l - LD5
with increasing coat thickness. 93
3.18 Graph showing increase in coat thickness as a function o f coating time for
all pellet batches. 94
3.19 Graph showing the relationship between tap number (N) and change in
volume (N/C). 124
3.20 Graph showing pressure difference per unit length (P/L) against air
velocity for SPG pellets. 133
3.37 The weight distribution of capsules filled with fully coated SP5 pellets. 157 3.38 The weight distribution o f capsules filled with fully coated AL5 pellets. 157 3.39 The weight distribution o f capsules filled with fully coated GR5 pellets. 158 3.40 The weight distribution o f capsules filled with fully coated DS5 pellets. 158 3.41 The weight distribution of capsules filled with fully coated 0V 5 pellets. 159 3.42 The weight distribution o f capsules filled with fully coated DU5 pellets. 159 3.43 The weight distribution o f capsules filled with fully coated LD5 pellets. 160 3.44 The weight distribution o f capsules filled with fully coated CY5 pellets. 160
3.45 Dissolution profiles for SP pellet batches. 166
3.46 Dissolution profiles for AL pellet batches. 167
3.47 Dissolution profiles for GR pellet batches. 168
3.45 Dissolution profiles for DS pellet batches. 169
3.49 Dissolution profiles for OV pellet batches. 170
3.50 Dissolution profiles for DU pellet batches. 171
3.51 Dissolution profiles for LD pellet batches. 172
3.52 Dissolution profiles for CY pellet batches. 173
3.53 Mean dissolution time for all pellet batches as a function o f coat thickness. 174 3.54 Area under the curve for all pellet batches as a function o f coat thickness. 174 3.55 Variation in dissolution time for all pellet batches as a function o f coat
thickness. 175
3.56 Graph showing MDT/coat thickness for each pellet batch at different
LIST OF SYMBOLS AND ABBREVIATIONS
0 = contact angle
s = porosity o f particle bed
Y = surface tension
n = viscosity o f air fj.m micrometers/ microns
AP = pressure difference across particle bed CXsv = Heywood surface to volume shape factor
°C = degrees Celsius
A - Avicel P H I01® (pellet formulation)
a = constant
A = cross-sectional area o f bed (Kozeny-Carmen equation) ANOVA = analysis o f variance
AUC - area under the curve
B - barium sulphate
b = breadth o f ellipse
b = constant (Kawakita’s equation)
C = degree o f volume reduction (Kawakita’s equation)
c
= empirical constant (Heywood’s equation)CAP = cellulose acetate phthalate CLA = centre line average
cm = centimeter
D = density
d = difference between rank orders Do = initial bulk density
D50 = median thickness da = projected area diameter De = apparent density
Df = final bulk density
Dt = true density
Cc3 shape factor (three-dimensional)
ei ellipticity
en surface roughness
Cr shape factor (two-dimensional)
f correction factor (shape factor Ccs equation) f Heywood’s surface coefficient
G glyceryl mono stearate
g grams
h = hours
HPMC = hydroxypropyl methyl cellulose IQR = interquartile range
k aspect factor (Kozeny-Carmen equation) k = Heywood’s volume coefficient
k packing fraction (bulk density studies)
ke volume coefficient for a particular geometrii
kN kilo Newtons
kPa = kilo Pascals 1 = length o f ellipse
L length (of surface profile/ particle bed) m = flakiness ratio (Heywood’s equations)
M mass
m = meters
MCC = microcrystalline cellulose MDT = mean dissolution time
mg milligram
min. = minutes ml = millilitres
mm = millimeters
mmHg = millimeters o f mercury
n = elongation ratio (Heywood’s equations) n = number o f samples
nm = nanometer
OPCS = one plane critical stability P = applied pressure
P = paracetamol (pellet formulation) p = statistical level o f confidence Pc = permeability coefficient Pm = measured perimeter PVP = polyvinylpyrrolidone r = pore radius
Ra = arithmetic mean roughness RD = relative dispersion coefficient re = mean radius
revs. = revolutions
RMS = root mean square roughness Rp = largest peak
rpm = revolutions per minute
Rq = standard deviation o f the height distribution rs = rank correlation coefficient
Rt = maximum peak value Rtm = average peak-to-valley ratio Rv = deepest valley
Rz = ten-point height S = particle surface SD = standard deviation sec. = seconds
SEM = scanning electron microscopy Sv = volume specific surface area t = thickness o f ellipsoid
t = time for air flow through bed (Kozeny-Carmen equation) u = air velocity
UV = ultraviolet
CHAPTER ONE: INTRODUCTION
1.1 Pellets As Multiparticulate Dosage Forms:
The flexibility and advantages o f multiparticulate dosage forms, which include pellets, granules and mini-tablets, have resulted in their popularity increasing steadily over the past few decades.
Multiparticulates offer the opportunity o f exact dosing using a variety o f presentations such as hard capsules, sachets or tablets. There is also the possibility o f mixing a combination o f different drugs or the same drug with different in vivo release properties within one such product to achieve the desired blood levels.
The therapeutic advantages o f multiparticulate oral delivery o f drugs include minimized side effects due to a lower risk o f dose-dumping, maximized absorption since they are well-distributed, and less inter- and intra-patient variation due to their predictable and reproducible transit through the gastro-intestinal tract.
From a marketing point o f view, rather than launching a new chemical entity it may be desirable to improve on formulations already available, and reformulating as a controlled release product is one option. Multiparticulates are a good base for such formulations since they may be designed to release their drug content slowly, for example by a matrix system or a polymer coating layer, or they may be targeted to release their contents at a specific site in the gastrointestinal tract, for example by enteric coating. Numerous controlled release products consisting o f pellets have been brought on to the market [Sandberg et al 1988; Ghebre-Sellassie 1989a; Daumesnil
1994].
Pellets may be defined as small geometrically shaped agglomerates with diameters between 0.5 - 1.5 mm [Ghebre-Sellassie 1989a] and as such present an ideal multiparticulate form with which to work.
granulators, high shear mixers, and extruders and spheronisers. The advantage o f being able to use or adapt equipment already available in the industry is very desirable, as is the case with fluid bed driers and coating pans. However, specialized equipment such as rotary granulators, extruders and spheronisers have been designed to increase process times, yields and drug loads and thus the extra cost may be off-set by increased efficiency and better products. Extrusion-spheronisation has become one o f the most popular methods employed to produce pharmaceutical pellets since its introduction to the world nearly three decades ago [Conine and Hadley 1970; Reynolds 1970]. The growing interest in multiparticulate dosage forms has resulted in a lot o f research being undertaken in this area over recent years, and thus pelletization is gradually becoming less o f an ‘art’ as more knowledge is gathered about the process.
Looking closer at the mechanisms involved in pellet formation shows up differences between the various methods available to produce pellets. Ghebre-Sellassie [1989b] discussed the bonding forces that hold the primary particles together and described the basic growth mechanisms as being nucléation, coalescence, layering, abrasion transfer, and size reduction. Thus a pelletisation process such as balling, performed in rotating pans or drums, relies on random collisions between particles to form nuclei which then may coalesce or undergo layering in order to grow. This type o f process results in pellets with a wide size distribution, and it would seem to be difficult to control the shape o f the pellets produced. Drug layering on the other hand, is the slow process o f depositing layers o f solutions, suspensions, or powders onto the surface o f a core granule, and as drying proceeds, the binder evaporates leaving behind a solid layer. This may be achieved by using several types o f equipment including fluidized bed driers and coating pans. Globulation is a method o f directly producing solid particles by atomisation o f hot melts or solutions, followed by evaporation and cooling. This type o f process often results in hollow particles due to the initial formation of an outer crust before the inner liquid evaporates.
undergoes a series o f shape transformations (see figure 1.1), first being chopped into shorter lengths, then forming dumbells, then ellipses, and finally spheres. If the optimum conditions do not exist or it is not a successful formulation, the sphere forming process may not be fully completed and a non-spherical product may result.
o
8
• 0 ° —
( ÿ o
extrudate chopped dumbbells ellipses spheres
extrudate
Figure 1.1 Shape changes during the spheronisation process.
Despite the variety o f methods available for the production o f spheres, each with its own variables affecting the final product, the ultimate aim o f all the processes must be to produce the optimum product possible in a repeatable manner.
Characterization o f the product resulting from the manufacturing process is thus necessary and reflects on the production methods and variables as well as providing information concerning the properties o f the finished dosage form. Pellets may be studied in terms o f their morphological characteristics, their structural and surface properties, as well as evaluating their performance as a finished product. These will now be discussed in turn.
1.2 The Size o f Pellets:
measurement [Allen 1990]. Most measure a physical property o f the particle in question and relate it to that o f an equivalent spheroid, e.g. the volume diameter is that o f a sphere having the same volume as the particle, and the surface diameter is that o f a sphere having an equivalent surface area. The surface volume diameter is the diameter o f a sphere with the same external surface to volume ratio as the particle, and measurement o f this would obviously require determining two characteristics o f the particle. Other types o f diameter include the free-falling diameter which is the diameter o f a sphere with the same density and free-falling speed as the particle in a fluid o f the same density and viscosity, and Stokes’ diameter which is the free-falling diameter in the laminar flow region.
The techniques o f microscopy and sieving involve measuring a defined diameter o f a large number o f particles and then calculating mean values; these types o f diameters are known as statistical diameters. Statistical diameters include the projected area diameter which is the diameter o f a circle having the same area as the projected area o f the particle; and Feref s diameter which is the distance between two parallel tangents to the particle outline, in a fixed direction. M artin’s diameter is also determined parallel to a fixed direction and is equal to the distance between opposite sides o f the particle along a line bisecting the projected area. Figure 1.2 illustrates the difference between measuring a F erefs diameter and M artin’s diameter on an ireggular particle; it should be noted however that if the outline was that o f a perfect sphere, the two diameters would be equal. When considering statistical diameters it is important to measure sufficient numbers o f samples in order to get representative values o f the entire population. And for all particle size analysis it is essential to clearly define the dimensions and parameters being measured.
F eref s diameter M artin’s diameter
Sieving is one o f the oldest and simplest methods o f classifying and separating particles according to their size. The lower aperture sizes, down to 5 pm, are produced by electroformed screens whereas standard woven wire sieves have apertures ranging from 37 pm upto a few millimeters. The process o f sieving determines the minimum aperture through which a particle can pass, and for standard sieves with square or round apertures, the particles are classified according to their widths. Unless extremely elongated, the length o f a particle plays no part in the sieving process since it does not hinder its passage through the sieve aperture. Another type o f sieve having rectangular apertures, a slotted sieve, is able to separate particles according to their thickness [Whiteman and Ridgway 1986; Whiteman 1986] but so far is not in common use for pharmaceuticals.
The two dimensions length and breadth are thus more readily obtainable and are usually enough to describe the size o f a particle. However, in certain cases the thickness may be desirable as well, for example when calculating three dimensional shape descriptors. One method developed specifically to determine the minimum dimension o f a particle i.e. its thickness, is ring gap sizing which was found to obtain lower values o f median particle size than microscopic or sieving techniques [Nystrom and Stanley-Wood 1976 and 1977; Nystrom 1978]. The equipment consists o f a sizing table made up o f two eccentrically placed rings, rotating in the same direction, thus producing a gap that increases from 0 to 2000 pm. The sizing table is attached to an electromagnetic vibrator and particles are fed onto it, and then rotate and move on the widening gap until they fall through into a collection tube below. Thus the sample is divided into size fractions according to particle thickness. With this technique, the feed rate o f the particles needs to be controlled and the vibration amplitude should be optimum so that clumping together o f particles or jumping ahead o f particles is avoided.
consuming and this has led to semi-automatic and automatic image analysis systems being developed. Semi-automatic techniques include image-splitting, or shearing, where two images o f a particle are formed which are first made to coincide and then moved across till their edges are just touching - the distance sheared is then proportional to the diameter o f the particle. Automatic systems usually involve a camera attached to some type o f microscope e.g. optical, transmission or scanning electron microscope, and the image is analysed electronically with the aid o f a computer. Many such systems exist and equipment differences, such as resolution power and the soft-ware running the system, make it difficult to compare the results obtained using different image analysis methods.
1.3 The Shape of Pellets:
The measurement o f shape is a challenge that is faced by scientists across the disciplines.To fully describe the shape o f an object, ideally the position o f every point on its surface would have to be identified. This poses an interesting problem and, as is often the case, numerous different solutions have been proposed. The multitude o f methods used to describe shape have resulted in work that may not be comparable with other studies, or use o f traditional shape descriptors that perhaps are not the most appropriate or powerful methods.
The shape o f pellets is an important characteristic which influences the behaviour o f the individual particle and the batch as a whole. Often the shape effects are overlooked or the assumption is made that the pellets being studied are o f uniform spherical shape. Unfortunately this is rarely the case with pharmaceutical pellets. The influence o f shape has not been fully investigated but it is generally acknowledged that the shape o f pellets may affect many o f their properties including how they flow and pack, and their performance when filmcoated.
which describes shape in words e.g. needle-shaped is acicular, an approximately equidimensional irregular shape is granular, and a global shape is defined as spherical.
However, often it is not enough to describe the shape qualitatively, and a quantitative method is desirable. Expressing particle shape as a single number is perhaps not ideal since the shape cannot be reproduced from it, and, in some cases more than one shape could be represented by the same number. On the other hand, a single number descriptor makes it possible to relate shape mathematically to other properties o f the particle, and makes it easier to compare particles.
When using a single dimension to characterize shape usually the size parameters discussed in section 1.2 are utilized which relate a property o f the particle to an equivalent sphere parameter.
Two-dimensional measurements are widely used and there are many ways o f relating two size measurements o f a particle to give rise to a shape factor. As a particle becomes more irregular, the difference between two different diameters becomes greater and thus performing particle size analysis by more than one method also provides the opportunity o f calculating shape factors.
Just to provide a glimpse o f the variety o f shape factors and approaches that have been discussed in the literature, a few methods o f particle shape characterisation follow. One o f the earlier shape expressions was introduced by a geologist, Wadell [1932], who said that the degree o f true sphericity was equal to the ratio betwen the surface area o f a sphere o f the same volume as the particle and the actual surface area o f the particle. Wadell also stated that sphericity is essentially a three-dimensional concept while roundness is obtained by measurements in one plane only.
by Furuuchi and Gotoh [1992], which may be useful in improving the quality o f particulate products despite not providing a direct measure o f shape.
Another approach was taken by Aoki and Suzuki [1970], who used a shape factor, y , defined as the ratio o f the diameter o f an inscribed sphere to that o f a circumscribed sphere for a particle. Fractal analysis has also been suggested as a method o f characterizing shape although it is more appropriate for investigating the surface roughness o f a particle (discussed further in section 1.4). However, as mentioned by Carstensen and Franchini [1993], where does a shape factor end and a surface roughness measure begin?
More common shape factors include the aspect ratio which is defined as the length to breadth ratio [Schneiderhohn 1954], and has been widely used to characterize shape. Podczeck and Newton [1994] demonstrated the weakness o f this shape factor in being unable to distinguish between polygonally symmetrical shapes such as a circle and a square, whereas other methods such as the one-plane critical stability and the shape factor cr were able to do so. The one-plane critical stability, or OPCS, introduced by Chapman et al [1988], involves tracing round the projected image o f a particle placed under a camera, and then computing the angle necessary to tilt a plane to start the particle rolling. This angle would be greater for a more elliptical particle and thus it gives an indication o f shape. Despite being a fairly powerful technique which has been shown to be able to differentiate between shapes, this method is rather tedious, time- consuming and dependant on the skill o f the operator.
The shape factor cr [Podczeck and Newton 1994] was shown to be a faster technique
2 .7 t.re
Shape fa c to rcr = —- — 1 - — (equation 1.1)
P m V V / /
where r^ is the mean radius, Pm is the measured perimeter, b is the breadth o f the ellipse, and 1 is the length o f the ellipse.
The theoretical value o f Or for a perfect sphere is 1.00 and any deviation fom sphericity would result in a decrease in this value. Podczeck and Newton [1994] suggested an eR value o f 0.75 to use as a standard with which to compare practical granules, since steel ball-bearings produced a similar value. This limitation is possibly due to the difficulties involved with projecting a three-dimensional object as a two- dimensional image e.g. shadows caused by light reflection and focusing the camera on the maximum perimeter o f the object. The shape factor cr was found to have a different value for a circle as compared to other polygonally symmetrical figures, and it was thus seen to be more powerful than other shape factors such as the aspect ratio.
Heywood [1963] used the three dimensions o f a particle to calculate shape coefficients and characterize its shape. He defined thickness as the height o f a particle when resting in its most stable position, breadth as the minimum distance between two tangential planes perpendicular to the plane o f maximum stablility, and length as the distance between two tangential planes perpendicular to those defining thickness and breadth. This is useful in microscopy where the particle usually lies in its most stable position and the view is perpendicular to it. It also means that the length and breadth are easier to obtain than the thickness. Heywood also named the length/breadth ratio the elongation ratio(n), and breadth/thickness was termed the fiakiness ratio(m). Heywood used the projected area diameter and related it to the particle surface and volume:
The surface coefficient,f, is not easy to determine directly on small particles and thus Heywood [1954] experimentally established a mathematical relationship between f and k using coarse particles. The final equations are:
f M + 1
/ = 1.57 + C|^—J ^ )• (equation 1.4)
ke
and k = — j = (equation 1.5)
m^n
where C is an empirical constant depending on the geometrical form o f the particle. Heywood assigned his particles to different shape groups such as cubical and spherical, as well as irregular approximate forms such as sub-angular and rounded, and determined values for ke and C for each o f them. Sometimes the surface and volume coefficients, f and k, are used on their own to describe shape, but since f is not as sensitive to a change in shape as k is, the ratio f/k may be used instead.
A three-dimensional shape factor was also developed by Podczeck and Newton [1995], following on from the shape factor cr discussed earlier [Podczeck and Newton 1994]. As seen in equation 1.6, the shape factor Cc3 consists o f two components, one describing surface roughness and one concerned with linear eccentricity, using the three dimensions o f an ellipsoid.
2. TV. re { 2 . 7 1 : . r e +
\ Pm. f J \ P m . f J
Shape factor Cc3 = --- J 2 - | (equation 1.6)
thickness o f the sample. This three-dimensional shape factor, Cc3, was shown to be more powerful than the two-dimensional shape factor cr, which in turn was more powerful than the aspect ratio [Podczeck et al 1995].
As mentioned earlier, the shape o f pellets has sometimes been overlooked when working with pelletized dosage forms. This is not to say that many authors have not used shape as a way o f evaluating the quality o f their product. Hileman et al [1993a] visually ranked their pellet batches using two independant observers. They were able to do this because the shape differences were perhaps very distinct. Hellén et al [1993b] also classified their pellets into shape groups visually. However, many workers do attempt to measure the shape and assign a numerical value to it. Hellén et al [1993a] compared seven different shape factors calculated for the same pellet batches. They measured the minimum and maximum diameters, perimeter, convex perimeter and two-dimensional area o f the projection, and with these they calculated the parameters circularity, roundness, elongation, pellips, rectang, modelx and roughness.
Lovgren and Lundberg [1989] actually followed changes in particle shape during the extrusion/spheronisation process; they measured the length/width ratio (similar to aspect ratio) for large numbers o f particles using an image analysis system. Kleinebudde et al [1994] also used an image analysis system in their evaluation o f the shape o f pellets. They measured length (as the longest o f eight Feret diameters), width (shortest Feret), and calculated the aspect ratio and projected area. Other authors have presented different methods o f measuring particle dimensions and properties e.g. ring gap sizing to determine thickness values [Nystrom 1978], and permeametry to determine surface area [Eriksson et al 1993], and then used this information in the calculation o f shape factors such as Heywood’s surface and volume coefficients.
definitions for the dimensions measured e.g. length being the longest measurement and breadth being perpendicular to it, or vice versa. However, in the end, the method o f shape characterization must fit the objective o f the study and be clearly explained. Thus, for example, as mentioned by Podczeck et al [1995], their two-dimensional shape factor c r is faster and more suitable for quality control procedures whereas the three-dimensional shape factor Cc3 provides more information and has been shown to be superior to other two-dimensional methods which indicates its suitability for formulation development work.
1.4 The Surface Roughness of Pellets:
The characteristics o f the pellet surfaces have a great impact on their properties, not only affecting how the pellets within one batch interact with each other i.e. flow and packing, but influencing any further processing that may be undertaken as well as their final performance as a dosage form. Thus in the scenario where pellets are to be coated or filled into capsules, knowledge o f the nature o f their surfaces is helpful. A coated pellet surface can possess any o f a number o f recognized defects [Aulton and Twitchell 1995], o f which surface roughness is one, described as small vertical irregularities affecting the smoothness and the gloss o f the film. And even after coating the pellets the roughness o f the surface plays an important role; it has been suggested that the main factor influencing the roughness o f the coated surface is the roughness o f the original surface [Rowe 1981].
In theory, the possible types o f surface and coat combinations can be visualised as follows:
i) a smooth sample surface and a smooth coat
\ \ \ \ \ \ \ \ \ \ \
ii) a smooth sample surface and a rough coat
iii) a rough sample surface and a smooth coat
iv) a rough sample surface and a rough coat
W W A W W W
The coating layer is usually applied in order to control the drug release from the pellets, and since for insoluble polymers the rate o f release is directly proportional to the thickness o f the layer, it is clear that any o f the above combinations may produce different release profiles. Also, the ideal combination would be the first example shown, with both a smooth sample surface and a smooth coating layer present. This would result in the least variations in the thickness o f the coat and thus the most uniform drug release. This emphasises the need to produce, as far as possible, smooth pellets and good coatings, and gives rise to the need for a method o f assessing the roughness o f pellet surfaces.
Techniques that have been used to examine pharmaceutical surface roughness include visual assessment, light-section microscopy, scanning electron microscopy, and profilimetry.
the scanning electron micrographs. However the determination o f standard roughness parameters is not feasible.
Twitchell et al [1995], used a light-section microscope to measure the thickness and roughness o f transparent film coats on tablets. The method involves having a band o f light reflecting/refracting off the sample surfaces at 45° and then being observed through a microscope. The image seen shows both the profile o f the core and o f the coat surface depicted as a series o f peaks and troughs which can be measured to calculate roughness parameters. This technique has the advantage o f being non destructive and non-contacting but it does not allow for easy calculation o f one o f the most commonly used roughness parameters i.e. the arithmetic mean roughness, Ra, without photographic records being taken.
More traditionally, profilimeters have been used to study solid surfaces. This instrument uses a fine, sharply pointed stylus to trace along the surface o f a solid. The vertical movements produced are changed into an electrical signal which can then be processed to determine standard roughness parameters [James 1983]. However, the dimensions o f the tip o f the stylus limit the resolution o f the technique since it would not be able to reach into troughs that are smaller than it. This may lead to misrepresentation o f the surface profile. Another concern is the possibility o f the stylus damaging the surface whilst in contact with it. More recently a non-contact profilimeter was introduced, using a laser beam to traverse the surface, as described by Healy et al [1995]. Besides eliminating the possibility o f surface damage and increasing the resolution power, this technique also enables a three-dimensional profile o f the surface to be built up.
equation 1.7). The mean surface level is drawn so that the areas above and below the line are equal. Thus
Ra = sum o f areas above the mean line + sum o f areas below (equation 1.7) L
where L is the length o f the measured distance.
Similarly in the case where an area is scanned and a three-dimensional profile is obtained, Ra is the arithmetic average o f the absolute values o f all points on the profile. The root mean square roughness, RMS or Rq, is another parameter which is derived in a similar fashion to Ra: it is the standard deviation o f the height distribution.
.--- L .
Rp (highest point)
profile trace mean line --- ».
Rv (lowest point)
Figure 1.3 A line scan o f a surface profile
Looking at figure 1.3, another parameter that may be defined is the largest measured value, Rt, which in this case would be equal to the sum o f Rp, the largest peak, and Rv, the deepest valley.
A more valuable roughness parameter is Rtm which is the arithmetic average o f the largest height difference (each equivalent to Rt) in each o f 25 rectangles obtained by splitting the surface into a 5 x 5 grid. This provides information about the surface that a two-dimensional line scan would not detect.
Work done in the field o f pharmacy using roughness parameters such as these includes that o f Rowe [1978a; 1978b; 1979] who has extensively investigated the roughness o f both uncoated and filmcoated tablet surfaces.
Another approach to measuring surface roughness is the use o f fractal dimensions. Fractal measurements are based on the fact that the measured perimeter o f an object depends on the length o f the ‘measuring stick’ or the scaling length being used [Carstensen and Franchini 1993]. It offers an explanation for the differences in boundary length o f the same object obtained at different resolutions. Using this concept it is possible to obtain a value o f a fractal increment which represents the surface irregularity. This may be achieved by analysing the outlines o f particles using image analysis methods, or other surface characterizing techniques such as gas adsorption. Thibert et al [1988] determined fractal dimensions for particle outlines using image analysis, and then related these to other physical properties such as packing and flow properties. Farin and Avnir [1992] incorporated a fractal dimension into the Noyes-Whitney equation in order to study the influence o f surface morphology on dissolution. Thus it has been shown that the fractal approach is applicable in studies investigating surface roughness o f pharmaceutical products, although it is time-consuming and may need further work to simplify the procedure.
1.5 The Density o f Pellets:
enter open pores i.e. the external surface would be considered as the boundary o f the particle.
The density o f pellets may be influenced by the individual components o f the formulation; for example increased density could be achieved by including a dense material such as barium sulphate as a filler [Boutell 1995]. Several steps in the manufacturing process could also lead to consolidation o f the initial wet mix i.e. the pressure exerted on pushing the mass through a die during the extrusion process or through a sieve/mesh when granulation takes place. The spheronisation process also results in densification o f the extrudate, and thus any change in formulation or production may affect the final density characteristics o f the product.
As mentioned previously, the true density o f a material is purely the ratio o f its mass to the volume occupied by it, excluding any pores in the volume measured. Thus the accuracy o f a true density value depends on the method used to determine the volume o f the sample. For a non-porous material the volume may be determined by fluid displacement as long as there is no interaction between the sample and fluid. However most solid particles do contain pores or surface features which would not be penetrated by a displaced fluid, in which case a gas may be used instead. Commercially there are many pycnometers available for density determinations, the simple ones just using air displacement, and others using gases such as helium which has the advantages o f being inert and having small atoms [Lowell and Shields 1984]. The apparatus is able to purge the system with the gas and control the pressures within the system using modem pressure transducers. With a measure o f the volume o f the sample, it is a simple matter to find its mass and thus calculate its density (density = mass/volume).
However, if the fluid being used is not able to penetrate any closed pores and cracks within the sample then the measured volume would be greater than the actual, and thus the density value would be lowered; this is known as the apparent density value. In the case o f mercury pycnometry, where the penetration fluid has a high contact angle and thus does not penetrate small open pores at ambient pressures, the volume measured includes both open and closed pores leading to a lower density value. This is termed the effective density o f the sample.
1.6 The Porosity o f Pellets:
deposition and formation o f a coating layer. Thus it is desirable to obtain information about the porosity characteristics o f the pellets.
Qualitatively, porosity may be evaluated using scanning electron microscopy to examine the surface o f the sample. However, in certain cases a quantitative description expressing pores or void space as a percentage o f the total volume may be more useful.
The main experimental method for determining the porous properties o f solids is mercury porosimetry which uses the Washburn equation [Orr 1969]:
Pr = -2y COS0 (equation 1.8)
where P is the applied pressure, r is the pore radius, y is the surface tension o f the
intrusion liquid, and 0 is the contact angle.
For a non-wetting liquid such as mercury, pressure needs to be applied before it will enter small diameter pores or void spaces in a solid material. The Washburn equation (see equation 1.8) relates the applied pressure to the radius o f the pores penetrated, taking into account the contact angle and surface tension o f mercury. Thus increasing the pressure on a material with a specific pore structure results in a specific mercury intrusion curve.
Strickland et al [1956] described a mercury pycnometer apparatus with which they determined the apparent density o f granulation samples. The apparatus consisted o f a glass pycnometer or dilatometer o f known volume, used as a sample cell, attached to a vacuum pump and a mercury manometer. Then using the true density measured from compression studies, they calculated the porosity o f their granulations with the following equation:
porosity % = (1 - Dg/DJ.lOO (equation 1.9)
where De is the apparent density and Dt is the true density.
the hysteresis o f the two curves would indicate the extent o f these pores. Another possible factor is the effect o f the contact angle. Attempts are being made to interpret the mercury intrusion and retraction data and devise analyses in which no geometrical assumptions are made [Shively 1991]. Other authors [Schroder and Kleinebudde
1995] have used fractal dimensions to measure and compare the complexity o f pore systems o f similar sized pellets. However in most cases the results o f mercury penetration studies analysed using the Washburn equation produce sufficient information to gain an insight into the porosity characteristics o f the sample being studied [Niskanen 1992; Lindner and Kleinebudde 1994].
1.7 The Surface Area of Pellets:
The surface area o f a particulate mass can actually be defined in two ways as a result o f the complicated characteristics o f pharmaceuticals. Thus surface area can be referred to as either the total area or the external area. The total area includes all the surface irregularities present such as surface roughness and pores within the structure. The external surface area excludes internal pores; however it is unclear whether surface irregularities are included or not. The method employed to study the surface area determines which o f the two, total or external, surfaces areas are measured. The surface area o f a solid dosage form influences several o f its properties, including its dissolution where a larger surface area would lead to an increased dissolution rate. A knowledge o f the surface area o f a pelletized material is also useful when filmcoating is required since a rougher or larger area would need more coating material to produce an equally thick layer when compared to pellets with a lesser surface area. The surface area is related to the size and shape o f the pellets, as well as being affected by the surface roughness and the porosity o f the structure. A perfectly spherical and smooth non-porous pellet would present the minimum surface to volume ratio and this would provide the ideal shape on which to form a coating layer o f uniform thickness. Mehta [1989], and Alderbom and Nystrom [1993] have described the techniques available to characterize the surface area o f particles.
different surface areas. Thus it is more appropriate to consider both the pellet size and shape - this is possible using the volume-surface mean diameter which is defined as the diameter o f a sphere having the same volume to surface ratio as the sample pellet [Alderbom and Nystrom 1993]. The volume specific surface area is related to the size and shape by:
Sv = ttsv / dvs (equation 1.10)
where Sv is the volume specific surface area, asv is the Heywood surface to volume shape factor, and dvs is the volume-surface diameter o f the particle. The drawbacks o f this type o f calculation include the complicated estimation o f Heywood’s shape factor (see section 1.3), as well as the different methods o f determining particle size leading to different values (see section 1.2).
will result in different measures o f surface area due to their varying molecular sizes affecting their pore penetration.
Air permeability is based on the concept that the rate o f flow o f a fluid through a particle bed is dependant on the pore characteristics o f the bed, which is related to the external surface area o f the particles i.e. the surface area exposed to the fluid. Traditionally permeametry has been used to study the surface area o f fine particles (<50-100 pm), but Eriksson et al [1990] investigated its use in determining the surface area o f coarse particles i.e. pellets. They used the widely accepted Kozeny-Carmen equation in order to interpret the results o f permeametry studies and calculate a surface area. Other equations do exist and some are discussed by Allen [1990].
By assuming the powder bed to be made up o f cylindrical, parallel pores whose total area is equivalent to the powder surface area, the Kozeny-Carmen equation takes the form:
^ 2 AfL4
(e q u a tio n l.il)
where Sv is the volume specific surface area, AP is the pressure difference across the particle bed, t is the time for air flow through the particle bed, A is the cross-sectional area o f the bed, k is the aspect factor, L is the length o f the bed o f particles, V is the volume o f air flowing through it, p is the viscosity o f air, and s is the porosity o f the particle bed.
The equation is modified to suit the different types o f permeameters available commercially, including transient permeameters (i.e. constant volume such as the Fisher Sub-Sieve Sizer) or steady-state permeameters (i.e. constant pressure such as the Blaine apparatus) [Alderbom and Nystrom 1993]. W ith a steady state permeameter, the pressure is measured when air o f a certain velocity flows through a bed o f known dimensions. The permeability coefficient ?c is found by plotting the
pressure per unit length o f the particle bed, AP/L, against the air velocity,u.
AP
![Figure 1.4 Piston method for filling capsules with pellets [from Cole 1987b].](https://thumb-us.123doks.com/thumbv2/123dok_us/8628077.1417785/52.595.43.520.436.699/figure-piston-method-filling-capsules-pellets-cole-b.webp)
![Figure 1.6 Piston and slide method for filling capsules with pellets [from Cole 1987b].](https://thumb-us.123doks.com/thumbv2/123dok_us/8628077.1417785/53.599.60.465.395.694/figure-piston-slide-method-filling-capsules-pellets-cole.webp)