Journal of Sports Sciences
Machine and deep learning for sport-specific movement recognition: a systematic
review of model development and performance
--Manuscript
Draft--Full Title: Machine and deep learning for sport-specific movement recognition: a systematic review of model development and performance
Manuscript Number: RJSP-2018-0332R2
Article Type: Original Manuscript
Keywords: Sport movement classification; inertial sensors; computer vision; Machine learning; performance analysis.
Abstract: Objective assessment of an athlete’s performance is of importance in elite sports to facilitate detailed analysis. The implementation of automated detection and recognition of sport-specific movements overcomes the limitations associated with manual performance analysis methods. The object of this study was to systematically review the literature on machine and deep learning for sport-specific movement recognition using inertial measurement unit (IMU) and, or computer vision data inputs. A search of multiple databases was undertaken. Included studies must have investigated a sport-specific movement and analysed via machine or deep learning methods for model development. A total of 52 studies met the inclusion and exclusion criteria. Data pre-processing, pre-processing, model development and evaluation methods varied across the studies. Model development for movement recognition were predominantly undertaken using supervised classification approaches. A kernel form of the Support Vector Machine algorithm was used in 53% of IMU and 50% of vision-based studies. Twelve studies used a deep learning method as a form of Convolutional Neural Network algorithm and one study also adopted a Long Short Term Memory architecture in their model. The adaptation of experimental set-up, data pre-processing, and model development methods are best considered in relation to the characteristics of the targeted sports movement(s).
Order of Authors: Emily Elizabeth Cust
Alice J Sweeting
Kevin Ball
Sam Robertson
Response to Reviewers: The authorship team have read and responded to the comments of reviewer #3. The red coloured text in the revised manuscript highlights the new alterations and additions.
Reviewer #1: The authors replied to my previous comments in a satisfactory way, then, I would approve the publication of this systematic review.
Author’s response:
The authorship team thank Reviewer #1 for their previous constructive comments.
Reviewer #3:
I think two important datasets are missing here.
oThe Volleyball dataset proposed by [1]. This dataset is for group activity recognition in sport footage. I think most of the team sport datasets contains multiple people, so group activity recognition is an important task in the team sport analysis.
oNCAA Basketball dataset, this is a multi-person action video dataset in team sport context. [5]
Author’s response:
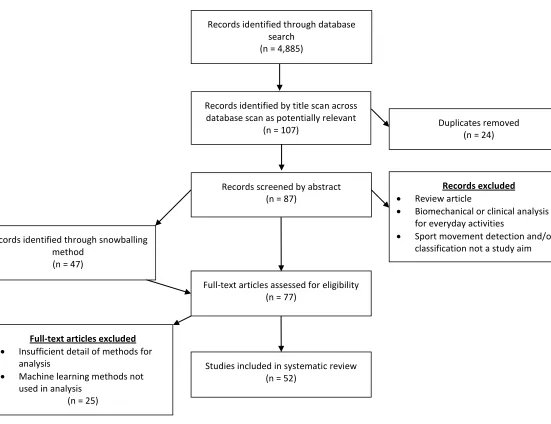
We thank the reviewer for alerting us to these two papers. Given that they meet the requirements for inclusion, both these articles have now been included in the review. Tables 4, 7, 8 have been amended to include the relevant information. Also, these articles have been cited in the discussion section on lines 543 - 545. The Prisma flow diagram (Figure 1) has been updated and the study result numbers throughout this review have also been updated to reflect the additional articles.
Reviewer #3:
One resource is missed here, MIT SLOAN SPORTS ANALYTICS Conference [2] is a one important source for recent works on sport analytics.
Author’s response:
The papers mentioned by the reviewer did not meet the whole inclusion and exclusion criteria for this review paper.
Reviewer #3:
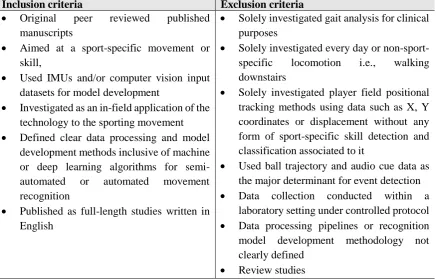
Table 2 shows the inclusion and exclusion criteria for the search. In the Exclusion criteria, it has been mentioned that works with this condition are excluded:
"Solely investigated player field positional tracking methods using data such as X, Y coordinates or displacement without any form of sport-specific skill detection and classification associated to it" and "Used ball trajectory and audio cue data as the major determinant for event detection".
I don't understand why these works are excludes. I think that trajectories (Players X,Y coordinates) are a valuable source for activity recognition.[3][4]
Author’s response:
The papers mentioned by the reviewer did not meet the whole inclusion and exclusion criteria for this review paper.
Reviewer #3: Missing reference: [6] Author’s response:
This article has now been included in the review. Tables 4, 7, 8 have been amended to include the relevant information. Also, this article has been cited in the discussion section on lines 543 -545. The Prisma flow diagram (Figure 1) has been updated and the study result numbers throughout this review have also been updated to reflect the additional article.
Reviewer #3 references provided:
[1] Mostafa S. Ibrahim, Srikanth Muralidharan, Zhiwei Deng, Arash Vahdat, Greg Mori. A Hierarchical Deep Temporal Model for Group Activity Recognition. CVPR 2016. [2] www.sloansportsconference.com
[3] N Mehrasa, Y Zhong, F Tung, L Bornn, G Mori. Deep Learning of Player Trajectory Representations for Team Activity Analysis. SLOAN 2018.
[4] Kuan-Chieh Wang and Richard Zemel. Classifying nba offensive plays using neural networks. In MIT SLOAN Sports Analytics Conference, 2016.
[5] Vignesh Ramanathan, Jonathan Huang, Sami Abu-El-Haija, Alexander Gorban, Kevin Murphy, and Li Fei-Fei. Detecting events and key actors in multi-person videos. CVPR 2016.
[6] Moumita Roy Tora, Jianhui Chen, James J. Little.Classification of Puck Possession Events in Ice Hockey. CVPR Workshop. 2017
1
Machine and deep learning for sport-specific movement recognition: a systematic review of
1
model development and performance
2
3
Emily E. Cust1, 2*,Alice J. Sweeting1, 2, Kevin Ball1 and Sam Robertson1, 2
4
5
Author details:
6
1 Institute for Health and Sport (IHES), Victoria University, Melbourne, Australia
7
2 Western Bulldogs Football Club, Footscray, Melbourne, Australia
8
9
Author ORCID
10
Sam Robertson 0000-0002-8330-0011
11
Alice Sweeting 0000-0002-9185-6773
12
Emily Cust 0000-0001-6927-6329
13
14
Author contact details:
15
* Corresponding author:
16
Emily E. Cust
17
Email: [email protected]
18
Institute for Health and Sport (IHES), Victoria University, P.O. Box 14428, Melbourne, VIC 8001,
19
Australia. Western Bulldogs Football Club, Footscray, Melbourne, Australia
20
21
Alice J. Sweeting
22
Email: [email protected]
23
Institute for Health and Sport (IHES), Victoria University, P.O. Box 14428, Melbourne, VIC 8001,
24
Australia. Western Bulldogs Football Club, Footscray, Melbourne, Australia
25
26
Kevin Ball
27
Email: [email protected]
28
Institute for Health and Sport (IHES), Victoria University, P.O. Box 14428, Melbourne, VIC 8001,
29
Australia.
30
31
Sam Robertson
32
Email: [email protected]
33
Institute for Health and Sport (IHES), Victoria University, P.O. Box 14428, Melbourne, VIC 8001,
34
Australia. Western Bulldogs Football Club, Footscray, Melbourne, Australia
35
36
Running title:
37
Machine and deep learning for sport movement recognition review
38
39
.
40
Manuscript - with author details
2
Abstract41
42
Objective assessment of an athlete’s performance is of importance in elite sports to facilitate
43
detailed analysis. The implementation of automated detection and recognition of sport-specific
44
movements overcomes the limitations associated with manual performance analysis methods. The
45
object of this study was to systematically review the literature on machine and deep learning for
46
sport-specific movement recognition using inertial measurement unit (IMU) and, or computer
47
vision data inputs. A search of multiple databases was undertaken. Included studies must have
48
investigated a sport-specific movement and analysed via machine or deep learning methods for
49
model development. A total of 52 studies met the inclusion and exclusion criteria. Data
pre-50
processing, processing, model development and evaluation methods varied across the studies.
51
Model development for movement recognition were predominantly undertaken using supervised
52
classification approaches. A kernel form of the Support Vector Machine algorithm was used in
53
53% of IMU and 50% of vision-based studies. Twelve studies used a deep learning method as a
54
form of Convolutional Neural Network algorithm and one study also adopted a Long Short Term
55
Memory architecture in their model. The adaptation of experimental set-up, data pre-processing,
56
and model development methods are best considered in relation to the characteristics of the
57
targeted sports movement(s).
58
59
60
Key Words:
61
Sport movement classification; inertial sensors; computer vision; machine learning; performance
62
analysis.
63
3
64
1. Introduction
65
66
Performance analysis in sport science has experienced considerable recent changes, due largely to
67
access to improved technology and increased applications from computer science. Manual
68
notational analysis or coding in sports, even when performed by trained analysts, has limitations.
69
Such methods are typically time intensive, subjective in nature, and prone to human error and bias.
70
Automating sport movement recognition and its application towards coding has the potential to
71
enhance both the efficiency and accuracy of sport performance analysis. The potential automation
72
of recognising human movements, commonly referred to as human activity recognition (HAR), can
73
be achieved through machine or deep learning model approaches. Common data inputs are
74
obtained from inertial measurement units (IMUs) or vision. Detection refers to the identification of
75
a targeted instance, i.e., tennis strokes within a continuous data input signal (Bulling, Blanke, &
76
Schiele, 2014). Recognition or classification of movements involves further interpretations and
77
labelled predictions of the identified instance (Bulling et al., 2014; Bux, Angelov, & Habib, 2017),
78
i.e., differentiating tennis strokes as a forehand or backhand. In machine and deep learning, a
79
model represents the statistical operations involved in the development of an automated prediction
80
task (LeCun, Yoshua, & Geoffrey, 2015; Shalev-Shwartz & Ben-David, 2014).
81
Human activities detected by inertial sensing devices and computer vision are represented
82
as wave signal features corresponding to specific actions, which can be logged and extracted.
83
Human movement activities are considered hierarchically structured and can be broken down to
84
basic movements. Therefore, the context of signal use, intra-class variability, and inter-class
85
similarity between activities require consideration during experimental set-up and model
86
development. Wearable IMUs contain a combination of accelerometer, gyroscope, and
87
magnetometer sensors measuring along one to three axes. These sensors quantify acceleration,
88
angular velocity, and the direction and orientation of travel respectively (Gastin, McLean, Breed, &
89
Spittle, 2014). These sensors can capture repeated movement patterns during sport training and
90
competitions (Camomilla, Bergamini, Fantozzi, & Vannozzi, 2018; Chambers, Gabbett, Cole, &
91
Beard, 2015; J. F. Wagner, 2018). Advantages include being wireless, lightweight and
self-92
contained in operation. Inertial measurement units have been utilised in quantifying physical output
93
4
and tackling impacts in Australian Rules football (Gastin et al., 2014; Gastin, McLean, Spittle, &
94
Breed, 2013) and rugby (Gabbett, Jenkins, & Abernethy, 2012, 2011; Howe, Aughey, Hopkins,
95
Stewart, & Cavanagh, 2017; Hulin, Gabbett, Johnston, & Jenkins, 2017). Other applications
96
include swimming analysis (Mooney, Corley, Godfrey, Quinlan, & ÓLaighin, 2015), golf swing
97
kinematics (Lai, Hetchl, Wei, Ball, & McLaughlin, 2011), over-ground running speeds (Wixted,
98
Billing, & James, 2010), full motions in alpine skiing (Yu et al., 2016); and the detection and
99
evaluation of cricket bowling (McNamara, Gabbett, Blanch, & Kelly, 2017; McNamara, Gabbett,
100
Chapman, Naughton, & Farhart, 2015; Wixted, Portus, Spratford, & James, 2011).
101
Computer vision has applications for performance analysis including player tracking,
102
semantic analysis, and movement analysis (Stein et al., 2018; Thomas, Gade, Moeslund, Carr, &
103
Hilton, 2017). Automated movement recognition approaches require several pre-processing steps
104
including athlete detection and tracking, temporal cropping and targeted action recognition, which
105
are dependent upon the sport and footage type (Barris & Button, 2008; Saba & Altameem, 2013;
106
Thomas et al., 2017). Several challenges including occlusion, viewpoint variations, and
107
environmental conditions may impact results, depending on the camera set-up (Poppe, 2010; Zhang
108
et al., 2017). Developing models to automate sports-vision coding may improve resource efficiency
109
and reduce feedback times. For example, coaches and athletes involved in time-intensive notational
110
tasks, including post-swim race analysis, may benefit from rapid objective feedback before the next
111
race in the event program (Liao, Liao, & Liu, 2003; Victor, He, Morgan, & Miniutti, 2017). For
112
detecting and recognising movements, body worn sensor signals do not suffer from the same
113
environmental constraints and stationary set-up of video cameras. Furthermore, multiple sensors
114
located on different body segments have been argued to provide more specific signal
115
representations of targeted movements (J. B. Yang, Nguyen, San, Li, & Shonali, 2015). But it is
116
not clear if this is solely conclusive, and the use of body worn sensors in some sport competitions
117
may be impractical or not possible.
118
Machine learning algorithms learn from data input for automated model building and
119
perform tasks without being explicitly programmed. The algorithm goal is to output a response
120
function that will predict a ground truth variable from an input vector of variables . Models
121
are run for classification techniques to predict a target class (Kotsiantis, Zaharakis, & Pintelas,
122
2007), or regression to predict discrete or continuous values. Models are aimed at finding an
123
5
optimal set of parameters to describe the response function, and then make predictions on unseen
124
unlabelled data input. Within these, model training approaches can generally run as supervised
125
learning, unsupervised learning or semi-supervised learning (Mohammed, Khan, & Bashier, 2016;
126
Sze, Chen, Yang, & Emer, 2017).
127
Processing raw data is limited for conventional machine learning algorithms, as they are
128
unable to effectively be trained on abstract and high-dimensional data that is inconsistent, contains
129
missing values or noisy artefacts (Bux et al., 2017; Kautz, 2017). Consequently, several
pre-130
processing stages are required to create a suitable data form for input into the classifier algorithm
131
(Figo, Diniz, Ferreira, & Cardoso, 2010). Filtering (Figo et al., 2010; Wundersitz, Gastin,
132
Robertson, Davey, & Netto, 2015), window capture durations (Mitchell, Monaghan, & O’Connor,
133
2013; Preece, Goulermas, Kenney, & Howard, 2009; Wundersitz, Josman, et al., 2015), and signal
134
frequency cut-offs (Wundersitz, Gastin, Richter, Robertson, & Netto, 2015; Wundersitz, Gastin,
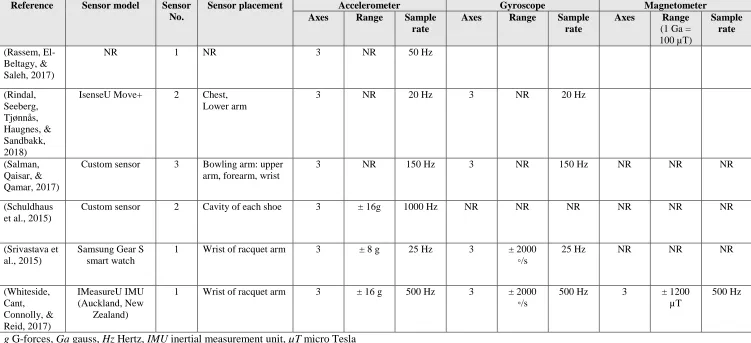
135
Robertson, et al., 2015) are common techniques applied prior to data prior to dynamic human
136
movement recognition. Well-established filters for processing motion signal data include the
137
Kalman filter (Kautz, 2017; Titterton & Weston, 2009; D. Wagner, Kalischewski, Velten, &
138
Kummert, 2017) and a Fourier transform filter (Preece, Goulermas, Kenney, Howard, et al., 2009)
139
such as a fast Fourier transform (Kapela, Świetlicka, Rybarczyk, Kolanowski, & O’Connor, 2015;
140
Preece, Goulermas, Kenney, & Howard, 2009). Near real-time processing benefits from reducing
141
memory requirements, computational demands, and essential bandwidth during whole model
142
implementation. Signal feature extraction and selection favours faster processing by reducing the
143
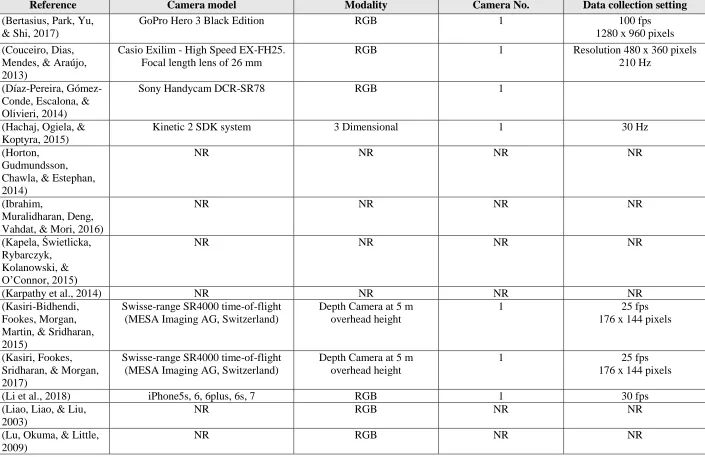
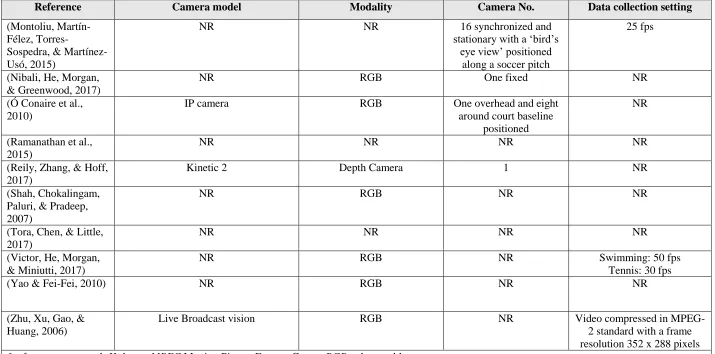
signals to the critical features that can discriminate the targeted activities (Bulling et al., 2014).
144
Feature extraction involves identifying the key features that help maximise classifier success, and
145
removing features that have minimal impact in the model (Mannini & Sabatini, 2010). Thus,
146
feature selection involves constructing data representations in subspaces with reduced dimensions.
147
These identified variables are represented in a compact feature variable (Mannini & Sabatini,
148
2010). Common methods include principal component analysis (PCA) (Gløersen, Myklebust,
149
Hallén, & Federolf, 2018; Young & Reinkensmeyer, 2014), vector coding techniques (Hafer &
150
Boyer, 2017) and empirical cumulative distribution functions (ECDF) (Plötz, Hammerla, &
151
Olivier, 2011). An ECDF approach has been shown to be advantageous over PCA as it derives
152
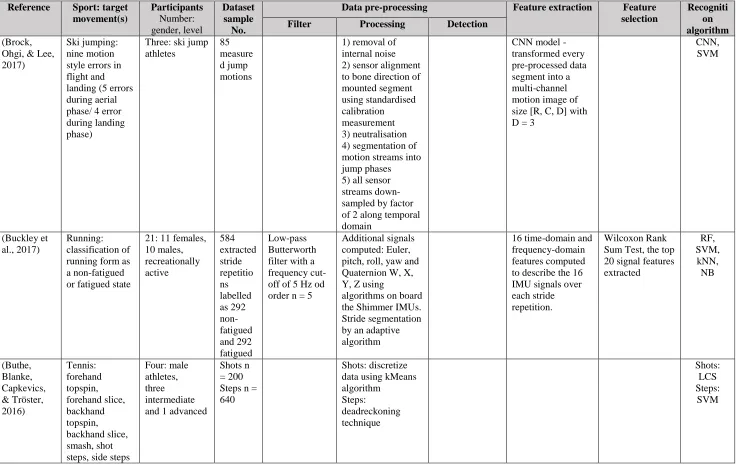
representations of raw input independent of the absolute data ranges, whereas PCA is known to
153
6
have reduced performance when the input data is not properly normalised (Plötz et al., 2011). For
154
further detailed information on the acquisition, filtering and analysis of IMU data for sports
155
application and vision-based human activity recognition, see (Kautz, 2017) and (Bux et al., 2017),
156
respectively.
157
Deep learning is a division of machine learning, characterised by deeper neural network
158
model architectures and are inspired by the biological neural networks of the human brain (Bengio,
159
2013; LeCun et al., 2015; Sze et al., 2017). The deeper hierarchical models create a profound
160
architecture of multiple hidden layers based on representative learning with several processing and
161
abstraction layers (Bux et al., 2017; J. B. Yang et al., 2015). These computational models allow
162
data input features to be automatically extracted from raw data and transformed to handle
163
unstructured data, including vision (LeCun et al., 2015; Ravi, Wong, Lo, & Yang, 2016). This
164
direct input avoids several processing steps required in machine learning during training and
165
testing, therefore reducing overall computational times. A current key element within deep learning
166
is backpropagation (Hecht-Nielsen, 1989; LeCun, Bottou, Orr, & Müller, 1998). Backpropagation
167
is a fast and computationally efficient algorithm, using gradient descent, that allows training deep
168
neural networks to be tractable (Sze et al., 2017). Human activity recognition has mainly been
169
performed using conventional machine learning classifiers. Recently, deep learning techniques
170
have enhanced the bench mark and applications for IMUs (Kautz et al., 2017; Ravi et al., 2016;
171
Ronao & Cho, 2016; J. B. Yang et al., 2015; Zebin, Scully, & Ozanyan, 2016; Zeng et al., 2014)
172
and vision (Ji, Yang, Yu, & Xu, 2013; Karpathy et al., 2014a; Krizhevsky, Sutskever, & Hinton,
173
2012; Nibali, He, Morgan, & Greenwood, 2017) in human movement recognition producing more
174
superior model performance accuracy.
175
The objective of this study was to systematically review the literature investigating
sport-176
specific automated movement detection and recognition. The review focusses on the various
177
technologies, analysis techniques and performance outcome measures utilised. There are several
178
reviews within this field that are sensor-based including wearable IMUs for lower limb
179
biomechanics and exercises (Fong & Chan, 2010; M. O’Reilly, Caulfield, Ward, Johnston, &
180
Doherty, 2018), swimming analysis (Magalhaes, Vannozzi, Gatta, & Fantozzi, 2015; Mooney et
181
al., 2015), quantifying sporting movements (Chambers et al., 2015) and physical activity
182
monitoring (C. C. Yang & Hsu, 2010). A recent systematic review has provided an evaluation on
183
7
the in-field use of inertial-based sensors for various performance evaluation applications
184
(Camomilla et al., 2018). Vision-based methods for human activity recognition (Aggarwal & Xia,
185
2014; Bux et al., 2017; Ke et al., 2013; Zhang et al., 2017), semantic human activity recognition
186
(Ziaeefard & Bergevin, 2015) and motion analysis in sport (Barris & Button, 2008) have also been
187
reviewed. However, to date, there is no systematic review across sport-specific movement
188
detection and recognition via machine or deep learning. Specifically, incorporating IMUs and
189
vision-based data input, focussing on in-field applications as opposed to laboratory-based protocols
190
and detailing the analysis and machine learning methods used.
191
Considering the growth in research and potential field applications, such a review is
192
required to understand the research area. This review aims to characterise the evolving techniques
193
and inform researchers of possible improvements in sports analysis applications. Specifically: 1)
194
What is the current scope for IMUs and computer vision in sport movement detection and
195
recognition? 2) Which methodologies, inclusive of signal processing and model learning
196
techniques, have been used to achieve sport movement recognition? 3) Which evaluation methods
197
have been used in assessing the performance of these developed models?
198
199
2. Methods
200
201
2.1 Search strategy
202
The preferred PRISMA recommendations (Moher, Liberati, Tetzlaff, Altman, & Group, 2009) for
203
systematic reviews were used. A literature search was undertaken by the first author on the
204
following databases; IEEE Xplore, PubMed, ScienceDirect, Scopus, Academic Search Premier,
205
and Computer and Applied Science Complete. The searched terms were categorised in order to
206
define the specific participants, methodology and evaluated outcome measure in-line with the
207
review aims. Searches used a combination of key words with AND/OR phrases which are detailed
208
in Table 1. Searches were filtered for studies from January 2000 to May 2018 as no relevant studies
209
were identified prior to this. Further studies were manually identified from the bibliographies of
210
database-searched studies identified from the abstract screen phase, known as snowballing. Table 2
211
provides the inclusion and exclusion criteria of this review.
212
213
18
***Table 1 near here: Key word search term strings per database ***
214
215
***Table 2 near here: Inclusion and exclusion criteria***
216
217
2.2 Data extraction
218
The first author extracted and collated the relevant information from the full manuscripts identified
219
for final review. A total of 18 parameters were extracted from the 52 research studies, including the
220
title, author, year of publication, sport, participant details, sport movement target(s), device
221
specifications, device sample frequency, pre-processing methods, processing methods, feature
222
selected, feature extraction, machine learning model used, model evaluation, model performance
223
accuracy, validation method, samples collected, and computational information. A customised
224
Microsoft ExcelTM spreadsheet was developed to categorise the relevant extracted information from
225
each study. Participant characteristics of number of participants, gender, and competition level,
226
then if applicable a further descriptor specific to a sport, for example, ‘medium-paced cricket
227
bowler’. Athlete and participant experience level was categorised as written in the corresponding
228
study to avoid misrepresentations. The age of participants was not considered an important
229
characteristic required for model development. The individual ability in which the movement is
230
performed accounts for the discriminative signal features associated with the movements. For the
231
purposes of this review, a sport-specific movement was defined from a team or individual sport,
232
and training activities associated with a particular sport. For example, weight-lifting as strength
233
training, recognised under the Global Association of International Sports Federations. The targeted
234
sports and specific movements were defined for either detection or recognition. Model
235
development techniques used included pre-processing methods to transform data to a more suitable
236
form for analysis, processing stages to segment data for identified target activities, feature
237
extraction and selections techniques, and the learning algorithm(s). Model evaluation measures
238
extracted were the model performance assessment techniques used, ground-truth validation
239
comparison, number of data samples collected, and the model performance outcomes results
240
reported. If studies ran multiple experiments using several algorithms, only the superior algorithm
241
and relevant results were reported as the best method. This was done so in the interest of concise
242
reporting to highlight favourable method approaches (Sprager & Juric, 2015). Any further relevant
243
9
results or information identified from the studies was included as a special remark (Sprager &
244
Juric, 2015). Hardware and specification information extracted included the IMU or video
245
equipment used, number of units, attachment of sensors (IMUs), sample frequency, and sensor data
246
types used in analysis (IMUs). Studies identified and full data extracted were reviewed by a second
247
author.
248
249
3. Results
250
251
An outline of the search results and study exclusions has been provided in Fig 1. Of the initial
252
database search which identified 4885 results, a final 52 studies met criteria for inclusion in this
253
review. Of these, 29 used IMUs and 22 were vision-based. One study (Ó Conaire et al., 2010) used
254
both sensors and vision for model development separately then together via data fusion. Tables 3 -
255
8 provide a description of the characteristics of the reviewed studies, detailed in the following
256
sections.
257
258
*** Fig 1 near here: PRISMA flow diagram ***
259
260
3.1 Experimental design
261
A variety of sports and their associated sport-specific movements were investigated, implementing
262
various experimental designs as presented in Tables 5 and 7. Across the studies, sports reported
263
were tennis (n = 10), cricket (n = 3), weightlifting or strength training (n = 6), swimming (n = 4),
264
skateboarding (n = 2), ski jumping (n = 2), snowboarding (n = 1), golf (n = 4), volleyball (n = 2),
265
rugby (n = 2), ice hockey (n = 2), gymnastics (n = 2), karate (n = 1), basketball (n = 3), Gaelic
266
football (n = 1), hurling (n = 1), boxing (n = 2), running (n = 2), diving (n = 1), squash (n = 1),
267
badminton (n = 1), cross-country skiing (n = 2) and soccer (n = 4). The Sports 1-M dataset
268
(Karpathy et al., 2014b) was also reported, which consists of 1,133,158 video URLs annotated
269
automatically with 487 sport labels using the YouTube Topic API. A dominant approach was the
270
classification of main characterising actions for each sport. For example, serve, forehand, backhand
271
strokes in tennis (Connaghan et al., 2011; Kos & Kramberger, 2017; Ó Conaire et al., 2010; Shah,
272
Chokalingam, Paluri, & Pradeep, 2007; Srivastava et al., 2015), and the four competition strokes in
273
10
swimming (Jensen, Blank, Kugler, & Eskofier, 2016; Jensen, Prade, & Eskofier, 2013; Liao et al.,
274
2003; Victor et al., 2017). Several studies further classified sub-categories of actions. For example,
275
three further classes of the two main classified snowboarding trick types Grinds and Airs (Groh,
276
Fleckenstein, & Eskofier, 2016), and further classifying the main tennis stroke types as either flat,
277
topspin or slice (Srivastava et al., 2015). Semantic descriptors were reported for classification
278
models that predicted athlete training background, experience and fatigue level. These included
279
running (Buckley et al., 2017; Kobsar, Osis, Hettinga, & Ferber, 2014), rating of gymnastic
280
routines (Reily, Zhang, & Hoff, 2017), soccer pass classification based on its quality (Horton,
281
Gudmundsson, Chawla, & Estephan, 2014), cricket bowling legality (Qaisar et al., 2013; Salman,
282
Qaisar, & Qamar, 2017), ski jump error analysis (Brock & Ohgi, 2017; Brock, Ohgi, & Lee, 2017)
283
and strength training technique deviations (M. A. O’Reilly, Whelan, Ward, Delahunt, & Caulfield,
284
2017a; M. O’Reilly et al., 2015; M. O’Reilly, Whelan, Ward, Delahunt, & Caulfield, 2017). One
285
approach (Yao & Fei-Fei, 2010), encoded the mutual context of human pose and sporting
286
equipment using semantics, to facilitate the detection and classification of movements including a
287
cricket bat and batsman coupled movements.
288
Total participant numbers for IMU-based studies ranged from one (Qaisar et al., 2013) to
289
30 (Kautz et al., 2017). Reported data individual instance sample sizes for sensor studies ranged
290
from 150 (Salman et al., 2017) to 416, 737 (Rassem, El-Beltagy, & Saleh, 2017). Vision-based
291
studies that explicitly reported total participant details ranged from five (Ó Conaire et al., 2010) to
292
40 (Victor et al., 2017). Vision dataset sample sizes varied across studies, from 50 individual action
293
clips (Liao et al., 2003) to 15, 000 (Victor et al., 2017). One study (Karpathy et al., 2014a) used the
294
publicly available Sports-1M, as previously described. Vision-based studies also reported datasets
295
in total time, 10.3 hours (Bertasius, Park, Yu, & Shi, 2017), 3 hours (Montoliu, Martín-Félez,
296
Torres-Sospedra, & Martínez-Usó, 2015), 1, 500 minutes (Shah et al., 2007), and 50 hours (Kapela
297
et al., 2015), and by frame numbers, 6, 035 frames (Zhu, Xu, Gao, & Huang, 2006) and 10, 115
298
frames (Reily et al., 2017).
299
300
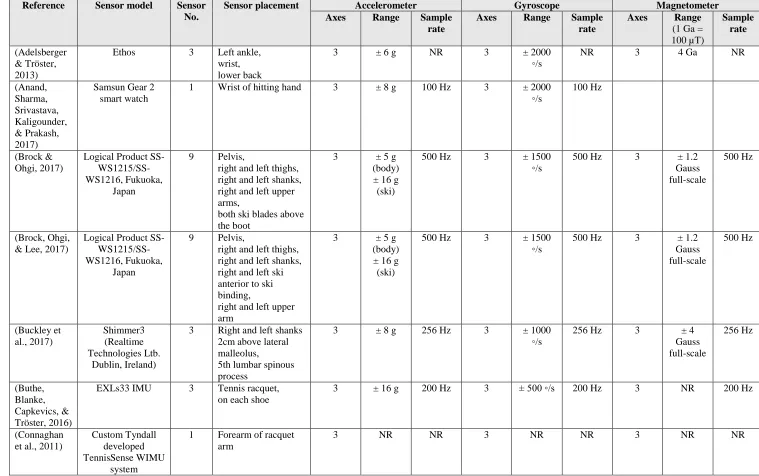
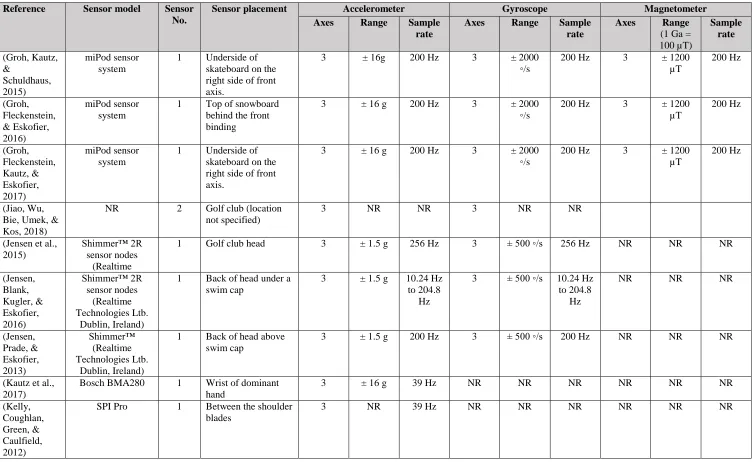
3.2 Inertial measurement unit specifications
301
A range of commercially available and custom-built IMUs were used in the IMU-based studies (n=
302
30), as presented in Table 3. Of these, 23% reported using a custom-built sensor. Of the IMU-based
303
11
studies, the number of sensors mounted or attached to each participant or sporting equipment piece
304
ranged from one to nine. The majority of studies (n= 22) provided adequate details of sensor
305
specifications including sensor type, axes, measurement range, and sample rate used. At least one
306
characteristic of sensor measurement range or sample rate used in data collection was missing from
307
eight studies. All studies used triaxial sensors and collected accelerometer data. For analysis and
308
model development, individual sensor data consisted of only accelerometer data (n = 8), both
309
accelerometer and gyroscope data (n = 15), and accelerometer, gyroscope and magnetometer data
310
(n = 7). The individual sensor measurement ranges reported for accelerometer were ± 1.5 g to ± 16
311
g, gyroscope ± 500 ◦/s to ± 2000 ◦/s, magnetometer ± 1200 µT or 1.2 to 4 Ga. Individual sensor
312
sample rates ranged from 10 Hz to 1000 Hz for accelerometers, 10 Hz to 500 Hz for gyroscopes
313
and 50 Hz to 500 Hz for magnetometers.
314
315
*** Table 3 near here***
316
317
3.3 Vision capture specification
318
Several experimental set-ups and specifications were reported in the total 23 vision-based studies
319
(Table 4). Modality was predominately red, green, blue (RGB) cameras. Depth cameras were
320
utilised (Kasiri-Bidhendi, Fookes, Morgan, Martin, & Sridharan, 2015; Kasiri, Fookes, Sridharan,
321
& Morgan, 2017; Reily et al., 2017), which add depth perception for 3-dimensional image
322
mapping. Seven studies clearly reported the use of a single camera set-up (Couceiro, Dias, Mendes,
323
& Araújo, 2013; Díaz-Pereira, Gómez-Conde, Escalona, & Olivieri, 2014; Hachaj, Ogiela, &
324
Koptyra, 2015; Kasiri-Bidhendi et al., 2015; Kasiri et al., 2017; Nibali et al., 2017; Reily et al.,
325
2017). One study reported 16 stationary positioned cameras at a ‘bird’s eye view’ (Montoliu et al.,
326
2015), and Ó Conaire et al. (2010) reported the use of one overhead and 8 stationary cameras
327
around a tennis court baseline, although data from two cameras were only used in final analysis due
328
to occlusion issues. Sample frequency and, or pixel resolution were reported in seven of the studies
329
(Couceiro et al., 2013; Hachaj et al., 2015; Kasiri-Bidhendi et al., 2015; Kasiri et al., 2017;
330
Montoliu et al., 2015; Victor et al., 2017; Zhu et al., 2006), with sample frequencies ranging from
331
30 Hz to 210 Hz.
332
333
112
*** Table 4 near here***334
335
3.4 Inertial measurement unit recognition model development methods
336
Key stages of model development from data pre-processing to recognition techniques for
IMU-337
based studies are presented in Table 5. Data pre-processing filters were reported as either a
low-338
pass filter (n = 7) (Adelsberger & Tröster, 2013; Buckley et al., 2017; Kelly, Coughlan, Green, &
339
Caulfield, 2012; M. A. O’Reilly et al., 2017a; M. O’Reilly et al., 2015, 2017; Rindal, Seeberg,
340
Tjønnås, Haugnes, & Sandbakk, 2018), high-pass filter (n = 2) (Kautz et al., 2017; Schuldhaus et
341
al., 2015), or calibration with a filter (Salman et al., 2017). Processing methods were reported in
342
67% of the IMU-based studies (Adelsberger & Tröster, 2013; Anand, Sharma, Srivastava,
343
Kaligounder, & Prakash, 2017; Brock et al., 2017; Buckley et al., 2017; Buthe, Blanke, Capkevics,
344
& Tröster, 2016; Groh et al., 2016; Groh, Fleckenstein, Kautz, & Eskofier, 2017; Groh, Kautz, &
345
Schuldhaus, 2015; Jensen et al., 2016, 2015; Jiao, Wu, Bie, Umek, & Kos, 2018; Kautz et al.,
346
2017; Kobsar et al., 2014; M. A. O’Reilly et al., 2017a; M. O’Reilly et al., 2017; Ó Conaire et al.,
347
2010; Pernek, Kurillo, Stiglic, & Bajcsy, 2015; Qaisar et al., 2013; Salman et al., 2017; Schuldhaus
348
et al., 2015). Methods included, calibration of data (Groh et al., 2016, 2017; Jensen et al., 2015;
349
Qaisar et al., 2013), a one-second window centred around identified activity peaks in the signal
350
(Adelsberger & Tröster, 2013; Schuldhaus et al., 2015), temporal alignment (Pernek et al., 2015),
351
normalisation (Ó Conaire et al., 2010), outlier adjustment (Kobsar et al., 2014) or removal (Salman
352
et al., 2017), and sliding windows ranging from one to 3.5 seconds across the data (Jensen et al.,
353
2016). The three studies that investigated trick classification in skateboarding (Groh et al., 2017,
354
2015) and snowboarding (Groh et al., 2016) corrected data for different rider board stance styles,
355
termed Regular or Goofy, by inverting signal axes.
356
Movement detection methods were specifically reported in 16 studies (Adelsberger &
357
Tröster, 2013; Anand et al., 2017; Connaghan et al., 2011; Groh et al., 2016, 2017, 2015, Jensen et
358
al., 2013, 2015; Kautz et al., 2017; Kelly et al., 2012; Kos & Kramberger, 2017; Ó Conaire et al.,
359
2010; Rindal et al., 2018; Salman et al., 2017; Schuldhaus et al., 2015; Whiteside, Cant, Connolly,
360
& Reid, 2017). Detection methods included thresholding (n = 5), windowing segmenting (n = 4),
361
and a combination of threshold and windowing techniques (n = 5).
362
13
Signal feature extraction techniques were reported in 80% of the studies, with the number
363
of feature parameters in a vector ranging from a vector of normalised X, Y, Z accelerometer signals
364
(Ó Conaire et al., 2010) to 240 features (M. A. O’Reilly et al., 2017a). Further feature selection to
365
reduce the dimensionality of the feature vector was used in 11 studies. Both feature extraction and
366
selection methods varied considerably across the literature (Table 5).
367
Algorithms trialled for movement recognition were diverse across the literature (Table 5).
368
Supervised classification using a kernel form of Support Vector Machine (SVM) was most
369
prevalent (n = 16) (Adelsberger & Tröster, 2013; Brock & Ohgi, 2017; Brock et al., 2017; Buckley
370
et al., 2017; Buthe et al., 2016; Groh et al., 2016, 2017, 2015; Jensen et al., 2016; Kautz et al.,
371
2017; Kelly et al., 2012; Ó Conaire et al., 2010; Pernek et al., 2015; Salman et al., 2017;
372
Schuldhaus et al., 2015; Whiteside et al., 2017). The next highest tested were Naïve Bayesian (NB)
373
(n = 8) (Buckley et al., 2017; Connaghan et al., 2011; Groh et al., 2016, 2017, 2015; Kautz et al.,
374
2017; Salman et al., 2017; Schuldhaus et al., 2015) and k-Nearest Neighbour (kNN) (n = 8)
375
(Buckley et al., 2017; Groh et al., 2016, 2017, 2015; Kautz et al., 2017; Ó Conaire et al., 2010;
376
Salman et al., 2017; Whiteside et al., 2017), followed by Random Forests (RF) (n = 7) (Buckley et
377
al., 2017; Groh et al., 2017; Kautz et al., 2017; M. A. O’Reilly et al., 2017a; M. O’Reilly et al.,
378
2017; Salman et al., 2017; Whiteside et al., 2017). Supervised learning algorithms were the most
379
common (n = 29). One study used an unsupervised discriminative analysis approach for detection
380
and classification of tennis strokes (Kos & Kramberger, 2017). Five IMU-based study investigated
381
a deep learning approach including using Convolutional Neural Networks (CNN) (Anand et al.,
382
2017; Brock et al., 2017; Jiao et al., 2018; Kautz et al., 2017; Rassem et al., 2017) and Long Short
383
Term Memory (LSTM) (Hochreiter & Schmidhuber, 1997) architectures (Rassem et al., 2017;
384
Sharma, Srivastava, Anand, Prakash, & Kaligounder, 2017). In order to assess the effectiveness of
385
the various classifiers from each study, model performance measures quantify and visualise the
386
predictive performance as reported in the following section.
387
388
*** Table 5 near here***
389
390
3.5 Inertial measurement unit recognition model evaluation
391
14
Reported performance evaluations of developed models across the IMU-based studies are shown in
392
Table 6. Classification accuracy, as a percentage score for the number of correct predictions by
393
total number of predictions made, was the main model evaluation measure (n = 24). Classification
394
accuracies across studies ranged between 52% (Brock & Ohgi, 2017) to 100% (Buckley et al.,
395
2017). Generally, the reported highest accuracy for a specific movement was 90% (n = 17)
396
(Adelsberger & Tröster, 2013; Anand et al., 2017; Buckley et al., 2017; Connaghan et al., 2011;
397
Groh et al., 2015; Jensen et al., 2013; Jiao et al., 2018; Kobsar et al., 2014; Kos & Kramberger,
398
2017; M. A. O’Reilly et al., 2017a; Ó Conaire et al., 2010; Pernek et al., 2015; Qaisar et al., 2013;
399
Rindal et al., 2018; Schuldhaus et al., 2015; Srivastava et al., 2015; Whiteside et al., 2017) and
400
80% to 90% (n = 7) (Brock & Ohgi, 2017; Brock et al., 2017; Groh et al., 2017; Jensen et al., 2016;
401
M. O’Reilly et al., 2015, 2017; Salman et al., 2017). As an estimate of the generalised performance
402
of a trained model on samples, a form of leave-one-out cross validation (LOO-CV) was used in
403
47% of studies (Buthe et al., 2016; Groh et al., 2016, 2017, 2015, Jensen et al., 2016, 2013; Kobsar
404
et al., 2014; M. O’Reilly et al., 2015, 2017; Ó Conaire et al., 2010; Pernek et al., 2015; Salman et
405
al., 2017; Schuldhaus et al., 2015). Precision, specificity and sensitivity (also referred to as recall)
406
evaluations were derived for detection (n = 6) and classification models (n = 10). Visualisation of
407
prediction results in the form of a confusion matrix featured in six studies (Buthe et al., 2016; Groh
408
et al., 2017; Kautz et al., 2017; Pernek et al., 2015; Rindal et al., 2018; Whiteside et al., 2017).
409
410
*** Table 6 near here***
411
412
3.6 Vision recognition model development methods
413
Numerous processing and recognition methods featured across the vision-based studies to
414
transform and isolated relevant input data (Table 7). Pre-processing stages were reported in 14 of
415
studies, and another varied 13 studies also provided details of processing techniques. Signal feature
416
extraction and feature selection methods used were reported in 78% of studies.
417
Both machine (n = 16) and deep learning (n = 7) algorithms were used to recognise
418
movements from vision data. Of these, a kernel form of the SVM algorithm was most common in
419
the studies (n = 10) (Couceiro et al., 2013; Horton et al., 2014; Kasiri-Bidhendi et al., 2015; Kasiri
420
15
et al., 2017; Li et al., 2018; Montoliu et al., 2015; M. A. O’Reilly, Whelan, Ward, Delahunt, &
421
Caulfield, 2017b; Ó Conaire et al., 2010; Reily et al., 2017; Shah et al., 2007; Zhu et al., 2006).
422
Other algorithms included kNN (n = 3) (Díaz-Pereira et al., 2014; Montoliu et al., 2015; Ó Conaire
423
et al., 2010), decision tree (DT) (n = 2) (Kapela et al., 2015; Liao et al., 2003), RF (n = 2)
(Kasiri-424
Bidhendi et al., 2015; Kasiri et al., 2017), and Multilayer Perceptron (MLP) (n = 2) (Kapela et al.,
425
2015; Montoliu et al., 2015). Deep learning was investigated in seven studies (Bertasius et al.,
426
2017; Ibrahim, Muralidharan, Deng, Vahdat, & Mori, 2016; Karpathy et al., 2014a; Nibali et al.,
427
2017; Ramanathan et al., 2015; Tora, Chen, & Little, 2017; Victor et al., 2017) of which used
428
CNNs or LSTM RNNs as the core model structure.
429
430
*** Table 7 near here***
431
432
3.7 Vision recognition model evaluation
433
Performance evaluation methods and results for vision-based studies are reported in Table 8. As
434
with IMU-based studies, classification accuracy was the common method for model evaluations,
435
featured in 61%. Classification accuracies were reported between 60.9% (Karpathy et al., 2014a)
436
and 100% (Hachaj et al., 2015; Nibali et al., 2017). In grouping the reported highest accuracies for
437
a specific movement that were 90% (n = 9) (Hachaj et al., 2015; Kasiri-Bidhendi et al., 2015;
438
Kasiri et al., 2017; Li et al., 2018; Montoliu et al., 2015; Nibali et al., 2017; Ó Conaire et al., 2010;
439
Reily et al., 2017; Shah et al., 2007), and 80% to 90% (n = 2) (Horton et al., 2014; Yao &
Fei-440
Fei, 2010). A confusion matrix as a visualisation of model prediction results was used in nine
441
studies (Couceiro et al., 2013; Hachaj et al., 2015; Ibrahim et al., 2016; Karpathy et al., 2014a;
442
Kasiri-Bidhendi et al., 2015; Kasiri et al., 2017; Lu, Okuma, & Little, 2009; Shah et al., 2007; Tora
443
et al., 2017). Two studies assessed and reported their model computational average speed (Lu et al.,
444
2009) and time (Reily et al., 2017).
445
446
*** Table 8 near here***
447
448
4 Discussion
449
16
450
The aim of this systematic review was to evaluate the use of machine and deep learning for
sport-451
specific movement recognition from IMUs and, or computer vision data inputs. Overall, the search
452
yielded 52 studies, categorised as 29 which used IMUs, 22 vision-based and one study using both
453
IMUs and vision. Automation or semi-automated sport movement recognition models working in
454
near-real time is of particular interest to avoid the error, cost and time associated with manual
455
methods. Evident in the literature, models are trending towards the potential to provide optimised
456
objective assessments of athletic movement for technical and tactical evaluations. The majority of
457
studies achieved favourable movement recognition results for the main characterising actions of a
458
sport, with several studies exploring further applications such as an automated skill quality
459
evaluation or judgement scoring, for example automated ski jump error evaluation (Brock et al.,
460
2017).
461
Experimental set-up of IMU placement and numbers assigned per participant varied
462
between sporting actions. The sensor attachment locations set by researchers appeared dependent
463
upon the specific sporting conditions and movements, presumably to gain optimal signal data.
464
Proper fixation and alignment of the sensor axes with limb anatomical axes is important in
465
reducing signal error (Fong & Chan, 2010). The attachment site hence requires a biomechanical
466
basis for accuracy of the movement being targeted to obtain reliable data. Single or multiple sensor
467
use per person also impacts model development trade-off between accuracy, analysis complexity,
468
and computational speed or demands. In tennis studies, specificity whilst using a single sensor was
469
demonstrated by mounting the IMU on the wrist or forearm of the racquet arm (Connaghan et al.,
470
2011; Kos & Kramberger, 2017; Srivastava et al., 2015; Whiteside et al., 2017). A single sensor
471
may also be mounted in a low-profile manner on sporting equipment (Groh et al., 2016, 2017,
472
2015; Jensen et al., 2015). Unobtrusive use of a single IMU to capture generalised movements
473
across the whole body was demonstrated, with an IMU mounted on the posterior head in
474
swimming (Jensen et al., 2016, 2013), lower back during running (Kobsar et al., 2014), and
475
between the shoulder blades in rugby union (Kelly et al., 2012).
476
The majority of vision-based studies opted for a single camera set-up of RGB modality.
477
Data output from a single camera as opposed to multiple minimises the volume of data to process,
478
therefore reducing computational effort. However, detailed features may go uncaptured,
479
17
particularly in team sport competition which consists of multiple individuals participating in the
480
capture space at one time. In contrast, a multiple camera set-up reduces limitations including
481
occlusion and viewpoint variations. However, this may also increase the complexity of the
482
processing and model computational stages. Therefore, a trade-off between computational demands
483
and movement recording accuracy often needs to be made. As stated earlier, the placement of
484
cameras needs to suit the biomechanical nature of the targeted movement and the environment
485
situated in. Common camera capture systems used in sports science research such as Vicon Nexus
486
(Oxford, UK) and OptiTrack (Oregon, USA) were not present in this review. As this review
487
targeted studies investigating during on-field or in-situation sporting contexts, efficiency in data
488
collection is key for routine applications in training and competition. A simple portable RGB
489
camera is easy to set-up in a dynamic and changing environment, such as different soccer pitches,
490
rather than a multiple capture system such as Vicon that requires calibrated precision and are
491
substantially more expensive.
492
Data acquisition and type from an IMU during analysis appears to influence model
trade-493
off between accuracy and computational effort of performance. The use of accelerometer,
494
gyroscope or magnetometer data may depend upon the movement properties analysed. Within
495
tennis studies, gyroscope signals were the most efficient at discriminating between stroke types
496
(Buthe et al., 2016; Kos & Kramberger, 2017) and detecting an athlete’s fast feet court actions
497
(Buthe et al., 2016). In contrast, accelerometer signals produced higher classification accuracies in
498
classifying tennis stroke skills levels (Connaghan et al., 2011). The authors expected lower
499
gyroscope classification accuracies as temporal orientation measures between skill levels of tennis
500
strokes will differ (Connaghan et al., 2011). Conversely, data fusion from all three individual
501
sensors resulted in a more superior model for classifying advanced, intermediate and novices tennis
502
player strokes (Connaghan et al., 2011). Fusion of accelerometer and vision data also resulted in a
503
higher classification accuracy for tennis stroke recognition (Ó Conaire et al., 2010).
504
Supervised learning approaches were dominant across IMU and vision-based studies. This
505
is a method which involves a labelled ground truth training dataset typically manually annotated by
506
sport analysts. Labelled data instances were recorded as up to 15, 000 for vision-based (Victor et
507
al., 2017) and 416, 737 for sensor-based (Rassem et al., 2017) studies. Generation of a training data
508
set for supervised learning can be a tedious and labour-intensive task. It is further complicated if
509
18
multiple sensors or cameras are incorporated for several targeted movements. A semi-supervised or
510
unsupervised learning approach may be advantageous as data labelling is minimal or not required,
511
potentially reducing human errors in annotation. An unsupervised approach could suit specific
512
problems to explain key data features, via clustering (Mohammed et al., 2016; Sze et al., 2017).
513
Results computed by an unsupervised model (Kos, Ženko, Vlaj, & Kramberger, 2016) for tennis
514
serve, forehand and backhand stroke classification compared favourbaly well against a proposed
515
supervised approach (Connaghan et al., 2011).
516
Recognition of sport-specific movements was primarily achieved using conventional
517
machine learning approaches, however nine studies implemented deep learning algorithms. It is
518
expected that future model developments will progressively feature deep learning approaches due
519
to development of better hardware, and the advantages of more efficient model learning on large
520
data inputs (Sze et al., 2017). Convolutional Neural networks (CNN) (LeCun, Bottou, Bengio, &
521
Haffner, 1998) were the core structure of five of the seven deep learning study models. Briefly,
522
convolution applies several filters, known as kernels, to automatically extract features from raw
523
data inputs. This process works under four key ideas to achieve optimised results: local connection,
524
shared weights, pooling and applying several layers (LeCun et al., 2015; J. B. Yang et al., 2015).
525
Machine learning classifiers modelled with generic hand-crafted features, were compared against a
526
CNN for classifying nine beach volleyball actions using IMUs (Kautz et al., 2017). Unsatisfactory
527
results were obtained from the machine learning model, and the CNN markedly achieved higher
528
classification accuracies (Kautz et al., 2017). The CNN model produced the shortest overall
529
computation times, requiring less computational effort on the same hardware (Kautz et al., 2017).
530
Vision-based CNN models have also shown favourable results when compared to a machine
531
learning study baseline (Karpathy et al., 2014a; Nibali et al., 2017; Victor et al., 2017).
532
Specifically, consistency between a swim stroke detection model for continuous videos in
533
swimming which was then applied to tennis strokes with no domain-specific settings introduced
534
(Victor et al., 2017). The authors of this training approach (Victor et al., 2017) anticipate that this
535
could be applied to train separate models for other sports movement detection as the CNN model
536
demonstrated the ability to learn to process continuous videos into a 1-D signal with the signal
537
peaks corresponding to arbitrary events. General human activity recognition using CNN have
538
shown to be a superior approach over conventional machine learning algorithms using both IMUs
539
19
(Ravi et al., 2016; J. B. Yang et al., 2015; Zebin et al., 2016; Zeng et al., 2014; Zheng, Liu, Chen,
540
Ge, & Zhao, 2014) and computer vision (Ji et al., 2013; Krizhevsky et al., 2012; LeCun et al.,
541
2015). As machine learning algorithms extract heuristic features requiring domain knowledge, this
542
creates shallower features which can make it harder to infer high-level and context aware activities
543
(J. B. Yang et al., 2015). Given the previously described advantages of deep learning algorithms
544
which apply to CNN, and the recent results of deep learning, future model developments may
545
benefit from exploring these methods in comparison to current bench mark models.
546
Model performance outcome metrics quantify and visualise the error rate between the
547
predicted outcome and true measure. Comparatively, a kernel form of an SVM was the most
548
common classifier implemented and produced the strongest machine learning approach model
549
prediction accuracies across both IMU (Adelsberger & Tröster, 2013; Brock & Ohgi, 2017; Buthe
550
et al., 2016; Groh et al., 2016, 2017, 2015; Jensen et al., 2016; Pernek et al., 2015; Salman et al.,
551
2017; Schuldhaus et al., 2015; Whiteside et al., 2017) and vision-based study designs (Horton et
552
al., 2014; Kasiri-Bidhendi et al., 2015; Kasiri et al., 2017; Li et al., 2018; Reily et al., 2017; Shah et
553
al., 2007; Zhu et al., 2006). Classification accuracy was the most common reported measure
554
followed by confusion matrices, as ways to clearly present prediction results and derive further
555
measures of performance. Further measures included sensitivity (also called recall), specificity and
556
precision, whereby results closer to 1.0 indicate superior model performance, compared to 0.0 or
557
poor model performance. The F1-score (also called a F-measure or F-score) conveys the balances
558
between the precision and sensitivity of a model. An in-depth analysis performance metrics
559
specific to human activity recognition is located elsewhere (Minnen, Westeyn, Starner, Ward, &
560
Lukowicz, 2006; Ward, Lukowicz, & Gellersen, 2011). Use of specific evaluation methods
561
depends upon the data type. Conventional performance measures of error rate are generally
562
unsuitable for models developed from skewed training data (Provost & Fawcett, 2001). Using
563
conventional performance measures in this context will only take the default decision threshold on
564
a model trained, if there is an uneven class distribution this may lead to imprecision (Provost &
565
Fawcett, 2001; Seiffert, Khoshgoftaar, Van Hulse, & Napolitano, 2008). Alternative evaluators
566
including Receiver Operating Characteristics (ROC) curves and its single numeric measure, Area
567
Under ROC Curve (AUC), report model performances across all decision thresholds (Seiffert et al.,
568
2008). Making evaluations between study methodology have inherent complications due to each
569
20
formulating their own experimental parameter settings, feature vectors and training algorithms for
570
movement recognition. The No-Free-Lunch theorems are important deductions in the formation of
571
models for supervised machine learning (David H. Wolpert, 1996), and search and optimisation
572
algorithms (D H Wolpert & Macready, 1997). The theorems broadly reference that there is no ‘one
573
model’ that will perform optimally across all recognition problems. Therefore, experiments with
574
multiple model development methods for a particular problem is recommended. The use of prior
575
knowledge about the task should be implemented to adapt the model input and model parameters in
576
order to improve overall model success (Shalev-Shwartz & Ben-David, 2014).
577
Acquisition of athlete specific information, including statistics on number, type and
578
intensity of actions, may be of use in the monitoring of athlete load. Other potential applications
579
include personalised movement technique analysis (M. O’Reilly et al., 2017), automated
580
performance evaluation scoring (Reily et al., 2017) and team ball sports pass quality rating (Horton
581
et al., 2014). However, one challenge lies in delivering consistent, individualised models across
582
team field sports that are dynamic in nature. For example, classification of soccer shots and passes
583
showed a decline in model performance accuracy from a closed environment to a dynamic match
584
setting (Schuldhaus et al., 2015). A method to overcome accuracy limitations in dynamic team field
585
sports associated with solely using IMUs or vision may be to implement data fusion (Ó Conaire et
586
al., 2010). Furthermore, vision and deep learning approaches have demonstrated the ability to track
587
and classify team sport collective court activities and individual player specific movements in
588
volleyball (Ibrahim et al., 2016), basketball (Ramanathan et al., 2015) and ice hockey (Tora et al.,
589
2017). Accounting for methods from experimental set-up to model evaluation, previous reported
590
models should be considered and adapted based on the current problem. Furthermore, the balance
591
between model computational efficiency, results accuracy and complexity trade-offs calculations
592
are an important factor.
593
In the present study, meta-analysis was considered however variability across developed
594
model parameter reporting and evaluation methods did not allow for this to be undertaken. As this
595
field expands and further methodological approaches are investigated, it would be practical to
596
review analysis approaches both within and between sports. This review was delimited to machine
597
and deep learning approaches to sport movement detection and recognition. However, statistical or
598
parametric approaches not considered here such as discriminative functional analysis may also
599
21
show efficacy for sport-specific movement recognition. However, as the field of machine learning
600
is a rapidly developing area shown to produce superior results, a review encompassing all possible
601
other methods may have complicated the reporting. Since sport-specific movements and their
602
environments alter the data acquisition and analysis, the sports and movements reported in the
603
present study provide an overview of the current field implementations.
604
605
5 Conclusions
606
607
This systematic review reported on the literature using machine and deep learning methods to
608
automate sport-specific movement recognition. In addressing the research questions, both IMUs
609
and computer vision have demonstrated capacity in improving the information gained from sport
610
movement and skill recognition for performance analysis. A range of methods for model
611
development were used across the reviewed studies producing varying results. Conventional
612
machine learning algorithms such as Support Vector Machines and Neural Networks were most
613
commonly implemented. Yet in those studies which applied deep learning algorithms such as
614
Convolutional Neural Networks, these methods outperformed the machine learning algorithms in
615
comparison. Typically, the models were evaluated using a leave-one-out cross validation method
616
and reported model performances as a classification accuracy score. Intuitively, the adaptation of
617
experimental set-up, data processing, and recognition methods used are best considered in relation
618
to the characteristics of the sport and targeted movement(s). Consulting current models within or
619
similar to the targeted sport and movement is of benefit to address bench mark model performances
620
and identify areas for improvement. The application within the sporting domain of machine
621
learning and automated sport analysis coding for consistent uniform usage appears currently a
622
challenging prospect, considering the dynamic nature, equipment restrictions and varying
623
environments arising in different sports.
624
Future work may look to adopt, adapt and expand on current models associated with a
625
specific sports movement to work towards flexible models for mainstream analysis
626
implementation. Investigation of deep learning methods in comparison to conventional machine
627
learning algorithms would be of particular interest to evaluate if the trend of superior performances
628
is beneficial for sport-specific movement recognition. Analysis as to whether IMUs and vision