Collecting Voices from the Cloud
Ian McGraw, Chia-ying Lee, Lee Hetherington, Stephanie Seneff, Jim Glass
MIT Computer Science and Artificial Intelligence Lab 32 Vassar Street Cambridge, MA, 02139, USA
[email protected] [email protected], [email protected], [email protected], [email protected]
Abstract
The collection and transcription of speech data is typically an expensive and time-consuming task. Voice over IP and cloud computing are poised to greatly reduce this impediment to research on spoken language interfaces in many domains. This paper documents our efforts to deploy speech-enabled web interfaces to large audiences over the Internet via Amazon Mechanical Turk, an online marketplace for work. Using the open source WAMI Toolkit, we collected corpora in two different domains which collectively constitute over 113 hours of speech. The first corpus contains 100,000 utterances of read speech, and was collected by asking workers to record street addresses in the United States. For the second task, we collected conversations with FlightBrowser, a multimodal spoken dialogue system. The FlightBrowser corpus obtained contains 10,651 utterances composing 1,113 individual dialogue sessions from 101 distinct users. The aggregate time spent collecting the data for both corpora was just under two weeks. At times, our servers were logging audio from workers at rates faster than real-time. We describe the process of collection and transcription of these corpora while providing an analysis of the advantages and limitations to this data collection method.
1.
Introduction
Acquiring in-domain training data for spoken language systems is central to their development. Unfortunately, this gives rise to a classic chicken-and-egg problem. A work-ing system is required to collect in-domain data; however, this very data is needed to train the underlying models be-fore the system can be implemented effectively. Over the years, we have learned to bootstrap our acoustic and lan-guage models from existing systems, supporting incremen-tal parameter adaptation for particular domains. This typ-ically slow process can take years of data collection and iterative refinement.
Successes in the wide deployment of sophisticated spo-ken language systems in the research community include MIT’sJupiter(Zue et al., 2000) conversational weather in-formation system, and CMU’sLet’s Go(Raux et al., 2006) transportation information system. BothJupiterandLet’s Goare telephone accessible and are publicized well enough to see a fair amount of use from outside the laboratory. In general, however, researchers resort to conducting user studies with high management overhead, making the col-lection of large amounts of data for arbitrary domains pro-hibitively expensive. This prevents data-driven techniques from reaching their full potential.
The field of human computation is beginning to ad-dress some of these needs. Amazon Mechanical Turk (AMT), for example, is a service that provides access to a constant crowd of non-expert workers who perform web-based tasks for micro-payments of as little as $0.005. Re-searchers in the natural language processing community have begun to harness the potential of this cloud-based tool for both annotation (Snow et al., 2008) and data collec-tion (Kaisser and Lowe, 2008). The speech community, however, has been somewhat slower to capitalize on this new paradigm. In (McGraw et al., 2009), we employed AMT workers to help transcribe spoken utterances. Other researchers have recently used AMT to transcribe corpora in a variety of domains (Novotney and Callison-Burch, 2010; Marge et al., 2010). Despite this progress, speech
re-searchers are only beginning to tap into the power of crowds in the cloud.
Having explored the feasibility of thecrowd transcrip-tion of speech data, it seems natural that we turn our at-tention to thecollectionof in-domain data for spoken lan-guage systems. From a technical standpoint, this endeavor is somewhat more complex. Amazon Mechanical Turk does not provide an interface for web-based audio collec-tion; furthermore, while incorporating audio playback into a website is relatively straightforward, few tools exist for recording audio from web pages. For this work, we have used the publicly available WAMI Toolkit, which provides a Javascript API for speech-enabling a web-site (Gruenstein et al., 2008). A similar technology from AT&T is also in development (Fabbrizio et al., 2009). It is now feasible to integrate these speech recognition services with Web 2.0 interfaces deployed to Amazon Mechanical Turk.
We believe a web-based approach to data collection re-tains the advantages of telephone-based collection, while opening up new interaction possibilities. Over the last few years, the emergence of high-quality mobile device dis-plays and constant network connectivity have popularized a class of applications that make use of multiple input and output modalities. Google and Vlingo, for example, are two competitors in the increasingly active voice search market, which combines spoken queries with result visualization on a mobile display.
from 298 users. This simple task demonstrates the feasibil-ity of large scale speech data collection through AMT.
Since the very same API acts as the web front-end to most of our spoken dialogue systems, we next discuss a corpus of 1,113 dialogue sessions collected for our flight reservation system (Seneff, 2002). Here we explore a range of price points for web tasks deployed to AMT that ask the worker to book a flight according to a given scenario. The scenarios themselves were also generated by AMT work-ers. Finally, once the data had been collected, we posted it back on AMT for transcription using an extension of the methods developed in (Gruenstein et al., 2009).
2.
Related Work and Background
We consider two categories of related work: other ac-tivities which utilized Amazon Mechanical Turk for tasks related to speech and language, and previous efforts for data collection for spoken dialogue systems.
Although there have been several recent success sto-ries on utilizing AMT for data annotation and language-related tasks, the idea of using Amazon Mechanic Turk to
provide raw speech data is much less common. (Snow
et al., 2008) demonstrated that many natural language pro-cessing tasks fall in the category of hard-for-computers but easy-for-humans, and thus become perfect tasks for AMT workers to undertake. (Kittur et al., 2008) investigated the utility of AMT as a tool for the task of assessing the quality of Wikipedia documents. They found that the inclusion of explicitly verifiable tasks was crucial to avoid a tendency to game the system. (Kaisser and Lowe, 2008) were able to successfully utilize AMT to generate a corpus of question-answer pairs to be used in the evaluation of TREC’s QA track. The authors claimed that AMT provided a “large, inexpensive, motivated, and immediately available” pool of subjects. (Novotney and Callison-Burch, 2010) were among the first to exploit AMT for speech data transcrip-tion. (Marge et al., 2010) demonstrated how ROVER can be used as a technique to achieve gold-standard transcrip-tion from AMT by intelligently but automatically combin-ing redundant contributions. This was shown to still be much more economic than hiring expert transcribers.
Data collection has always been a major issue for re-searchers developing conversational spoken dialogue sys-tems. In the early days, very costly Wizard of Oz systems involved scheduling subjects to come to the lab and par-ticipate with a simulated spoken dialogue system. These efforts were obviously prohibitively expensive, and limited collected data to at most dozens of dialogues.
In the early 1990’s, under the auspices of DARPA, researchers from MIT, CMU, BBN, SRI, and AT&T col-laborated to collect approximately 25,000 utterances in the travel domain (Hirschman et al., 1993). At the same time, a similar multi-year development and data collection effort was taking place in Europe (Peckham, 1993). In 2000 and 2001, collaborative work in the U.S. was revived as the Communicator project, with the additional participation of IBM, Lucent, Bell Labs, and the University of Colorado at Boulder. This effort led to the collection of just over 100,000 utterances spoken to automatic or semi-automatic flight-reservations systems (Walker et al., 2001). The
col-laborative data collection effort was overseen by NIST and involved considerable effort in planning the logistics.
The SLS group at MIT has been developing spoken dialogue systems since the late 1980’s. While we were suc-cessful in collecting substantial amounts of audio data for our Jupiter telephone-based system, data collection for ar-bitrary domains and multimodal systems has been challeng-ing. Within the last few years, we have become aware of the potential for a paradigm shift towards a model that cap-tures data over the internet from web browsers. We piloted this idea by soliciting subjects to solve scenarios within our CityBrowser multimodal dialogue system (Gruenstein and Seneff, 2007), and rewarding them substantially with gift certificates. While this method was successful, we feel that Amazon Mechanical Turk potentially offers a much more economic solution and a much broader user base.
In the next two sections, we will first describe our ef-forts to collect read speech for address information through AMT, followed by a discussion of our experiments inviting workers to solve travel scenarios within FlightBrowser.
3.
Read Speech
This section explores the use of Amazon Mechanical Turk to collect read speech containing spoken addresses.
3.1. Collection Procedure
Units of work on Amazon Mechanical Turk are called Human Intelligence Tasks or HITs. Requestersbuild tasks and deploy them to AMT using a web interface, command-line tools, or another of the many APIs made available to the public. Each task is assigned a price, which an
individ-ualworkerwill receive as payment if the requester accepts
his or her work. Requesters reserve the right to deny pay-ment for work that is unsatisfactory.
The addresses in our reading task are taken from the TIGER 2000 database provided by the U.S. Census Bureau. Each address is a triple: (road, city, state). There are over six million such triples in the TIGER database. To ensure coverage of the 273,305 unique words contained in these addresses, we chose a single address to correspond to each word. 100,000 such triples formed our pilot experiment; AMT workers were paid one U.S. cent to read each prompt. Figure 1 shows an example HIT. After the worker has recorded an address, they are required to listen to a play-back of that utterance before moving on, to help mitigate problems with microphones or the acoustic environment.
Since we are employing anonymous, non-expert work-ers, there is little incentive to produce high quality utter-ances, and a worker may even try to game the system. We propose two distinct ways to validate worker data. The first is to have humans validate the data manually. Given the success of AMT for transcription tasks in previous work, we could theoretically pay workers to listen to the cloud-collected speech and determine whether the expected words were indeed spoken. The second approach, which we ex-plore in this section, is to integrate a speech recognizer into the data-collection process itself.
Figure 1:A sample Human Intelligence Task (HIT) for col-lecting spoken addresses.
0 6 12 18 24
0 1000 2000
Worker’s Local Hour of Day Average Collection Rate (# Utterances / Hour)
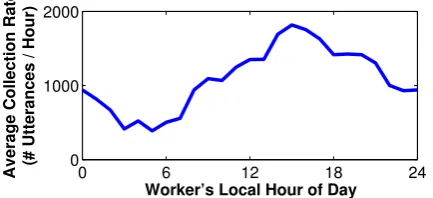
Figure 2:Data collection rate as a function of the worker’s local time of day.
satisfy our expectations immediately. For the pilot experi-ment, however, we decided not to block any workers. Run-ning the recognizer in a second pass allows us to examine the raw data collected through AMT and experiment with different methods of blocking unsuitable work, the best of which would be deployed in future database collection ef-forts.
3.2. Corpus Overview
Our reading tasks were posted to Amazon Mechani-cal Turk on a Wednesday afternoon. Within 77 hours, 298 workers had collectively read all 100,000 prompts, yielding a total of 103 hours of audio. Figure 2 depicts the average number of utterances collected per hour plotted according to the worker’s local time of day. Workers tended to talk with our system during their afternoon; however, the vary-ing time zones smooth out the collection rate with respect to the load on our servers.
The majority of our data, 68.6%, was collected from workers within the United States. India, the second largest contributor to our corpus, represented 19.6% of our data. While some non-native speakers produced high quality ut-terances, others had nearly unintelligible accents. This, as well as the fact that the acoustic environment varied greatly from speaker to speaker, make the MIT Address corpus
par-10 100 1000
0 0.2 0.4 0.6 0.8 1
Number of Utterances (log scale)
Recognizer−Estimated Quality
no speech
Native: male female both Non−native: male female both
Figure 3: Individual workers plotted according to the rec-ognizer estimated quality of their work, and the number of utterances they contributed to our corpus.
0.5 0.6 0.7 0.8 0.9 1
0 0.2 0.4 0.6 0.8 1
Recognizer−Estimated Quality (q)
Fraction of Initial Data Set
Data with Quality > q
Data with No Anomalies and Quality > q
Figure 4: By filtering out users whose estimated quality does not meet a certain threshold, we can simulate the ef-fect of using the recognizer to automatically block workers.
ticularly challenging for speech recognition.
To determine the properties of our corpus without lis-tening to all 103 hours of speech, two researchers inde-pendently sampled and annotated 10 utterances from each worker. Speakers were marked as male or female and na-tive or non-nana-tive. Anomalies in each utterance, such as un-intelligible accents, mispronounced words, cut-off speech, and background noise, were marked as present or absent. We then extrapolate statistics for the overall corpus based on the number of utterances contributed by a given worker. From this, we have estimated that 74% of our data is cleanly read speech.
This result raises the question of how to effectively manage the quality of speech collected from the cloud. Here we explore an automatic method which incorporates our speech recognizer into the validation process. In par-ticular, we run the recognizer that we have built for the ad-dress domain over each utterance collected. We then assign a quality estimate,q, to each worker by computing the frac-tion of recognifrac-tion hypotheses that contain the U.S.state
expected given the prompt. Figure 3 shows the recognizer-estimated quality of each worker, plotted against the num-ber of utterances that worker contributed. Notice that a sin-gle worker may actually be two or more different people using the same Amazon account.
74% 7% 9% 6% 4%
90%
1% 1% 4.5% 3.5%
No anomalies
Multiple anomalies, cut−off speech, silence
Very thick accent
Breathing into close−talking microphone
Background Noise
No Quality Filter Quality Threshold (q = .95)
Figure 5: Breakdown of anomalies present in the cor-pus as a whole and the sub-corcor-pus where workers have a
high quality estimate, q >= .95. The recognizer-filtered
sub-corpus still retains 65% of the original speech data. Though not explicitly shown here, we found that non-native speakers were still able to contribute to this sub-corpus: 5% of the filtered data with no anomalies came from non-native speakers.
effects of blocking users according to a quality threshold
q. It is clear from Figure 4 that, while the data collection rate might have slowed, requiring a high qeffectively fil-ters out workers who contribute anomalous utterances. Fig-ure 5 depicts how the corpus properties change when we set
q =.95. While not unexpected, it is nice to see that egre-giously irregular utterances are effectively filtered out.
4.
Multimodal Dialogue Interactions
Our experience with the address corpus inspired us to deploy a fully functional multimodal spoken dialogue sys-tem to AMT. This section describes the use of AMT to col-lect a large corpus for our FlightBrowser dialogue system.4.1. System Design
FlightBrowser was derived from the telephone-based Mercury system, originally developed under the DARPA Communicator project (Seneff, 2002). Mercury’s design was based on a mixed-initiativemodel for dialogue inter-action. The system describes verbally the set of database tuples returned in a conversational manner. It prompts for relevant missing information at each point in the dialogue, but there are no constraints on what the user can say next. Thus, the full space of the understanding system is available at all times.
Using the WAMI Toolkit, we adapted Mercury to a multimodal web-interface we call FlightBrowser. The di-alogue interaction was modified, mainly by reducing the system’s verbosity, to reflect the newly available visual itinerary and flight list display. A live database of flights is used for the system. About 600 major cities are sup-ported worldwide, with a bias towards U.S. cities. The in-terface was designed to fit the size constraints of a mobile phone, and multimodal support, such as clicking to sort or book flights, was added. Figure 6 shows FlightBrowser in a WAMI browser built specifically for the iPhone.
Figure 6: FlightBrowser interface loaded in the iPhone’s WAMI browser. The same interface can be accessed from a desktop using any modern web browser.
4.2. Scenario Creation
When designing a user study, many spoken dialogue system researchers struggle with the question of how to elicit interesting data from users without biasing the lan-guage that they use to produce it. Some have tried to present scenarios in tabular form, while others prefer to introduce extra language, hoping that the user will only pick up on the important details of a scenario rather than the language in which it is framed. Continuing the theme of crowd-sourcing research tasks, we take an alternative approach.
To generate scenarios, we created an Amazon Mechan-ical Turk task which asked workers what they would expect from a flight reservation system. They were explicitly told that we were trying to build a conversational system that could handle certain queries about flights, and we provided them with a few example scenarios that our system can han-dle. Their job was then to construct a set of new scenarios, each starting with the word “You...” and continuing to de-scribe “your” desired itinerary. We paid $0.03 per scenario, and within a few hours 72 distinct workers had given us 273 scenarios, examples of which are shown below.
1. You need to find the cheapest flight from Maryland to Tampa, Florida. Find a cheap flight out of your choice of Philadelphia, Dulles or Baltimore airports.
2. You won a prize to visit Disneyland but have to provide your own airfare. You are going the week of Valentine’s Day and you need 2 tickets from Seattle. You only have $500 to spend on tickets.
3. Destination: London, England
Departs: January 15th, 2010 anytime in the morning Returns: March 1st, 2010 anytime after 3:00pm Price: Anything under $1500 To make things interesting I want as many layovers as possible!
4. You would like to take a vacation in Puerto Rico for two weeks. The departure and arrival dates must be on a Satur-day.
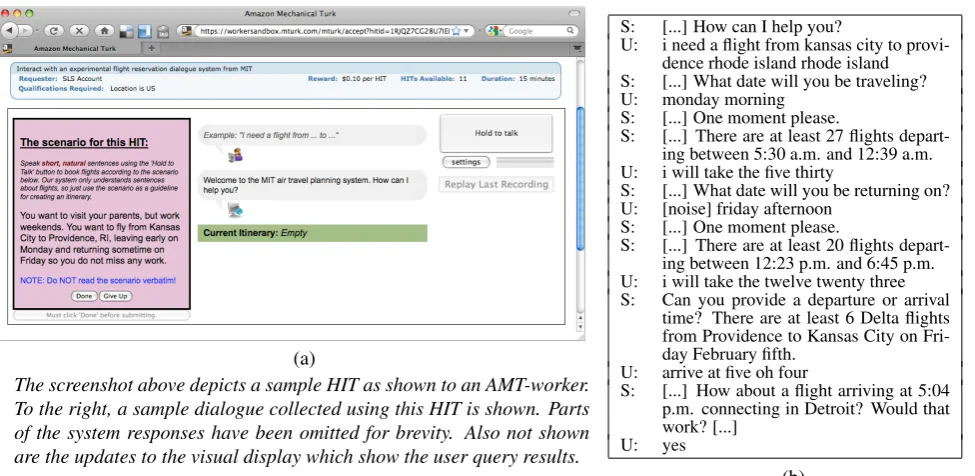
(a)
The screenshot above depicts a sample HIT as shown to an AMT-worker. To the right, a sample dialogue collected using this HIT is shown. Parts of the system responses have been omitted for brevity. Also not shown are the updates to the visual display which show the user query results.
S: [...] How can I help you?
U: i need a flight from kansas city to provi-dence rhode island rhode island S: [...] What date will you be traveling? U: monday morning
S: [...] One moment please.
S: [...] There are at least 27 flights depart-ing between 5:30 a.m. and 12:39 a.m. U: i will take the five thirty
S: [...] What date will you be returning on? U: [noise] friday afternoon
S: [...] One moment please.
S: [...] There are at least 20 flights depart-ing between 12:23 p.m. and 6:45 p.m. U: i will take the twelve twenty three S: Can you provide a departure or arrival
time? There are at least 6 Delta flights from Providence to Kansas City on Fri-day February fifth.
U: arrive at five oh four
S: [...] How about a flight arriving at 5:04 p.m. connecting in Detroit? Would that work? [...]
U: yes
(b) Figure 7:Sample HIT and AMT-collected interaction.
Not all of these 273 scenarios were suitable for a user study. As shown in the examples, some workers did not fully follow the directions. Other crowd-sourced scenarios had dates that were in the past by the time we deployed our system. For the most part, however, the scenarios generated were far more creative and varied than anything we could have come up with ourselves in such a short amount of time. Although it was clear that some tasks would cause our sys-tem trouble, we did not explicitly exclude such scenarios from our study. For example, our system does not have
Disneylandin its vocabulary, let alone a mapping from the
landmark to the nearest airport. Ultimately, we chose 100 scenarios to form the basis of the data collection procedure described in the next section.
We view the scenario collection procedure described above as a step towards constructing user studies that are relatively unbiased with respect to system language and ca-pabilities. One could envision formalizing a framework for soliciting relevant scenarios for evaluating spoken dialogue systems from non-expert workers.
4.3. Data Collection
Although the interface shown in figure 6 is optimized for a mobile device, the WAMI Toolkit allows us to access it from modern desktop browsers as well. The following paragraphs describe how we were able to collect over 1,000 dialogue sessions averaging less than $0.20 apiece in under 10 days of deployment on Amazon Mechanical Turk.
4.3.1. HIT Design
The design of a HIT is of paramount importance with respect to the quality of the data we collected using Ama-zon Mechanical Turk. Novice workers, unused to interact-ing with a spoken language interface, present a challenge to system development in general, and the AMT-workers are no exception. Fortunately, AMT can be used as an op-portunity to iteratively improve the interface, using worker interactions to guide design decisions.
To optimize the design of our system and the HIT, we deployed short-lived AMT tasks and followed them up with improvements based on the interactions collected. Since the entire interaction is logged on our servers, we also have the ability to replayeach session from start to finish, and can watch and listen to the sequence of dialogue turns tak-ing place in a browser. By replaytak-ing sessions from an early version of our interface, we discovered that many workers were not aware that they could click on a flight to view the details. This inspired the addition of the arrows on the left hand side, to indicate the potential for drop-down details.
Although initially we had hoped to minimize the in-structions on screen, we found that, without guidance, a number of AMT-workers just read the scenario aloud. Even after providing them with a short example of something they could say, a few workers were still confused, so we added an explicit note instructing them to avoid repeating the scenario verbatim. After a few iterations of redeploying and retuning the dialogue and scenario user interfaces, we eventually converged on the HIT design shown in figure 7. In order to complete a HIT successfully, a worker was required to book at least one flight (although we did not check that it matched the scenario); otherwise they were asked to “give up.” Whether the task was completed or not, the worker had the option of providing written feedback about their experience on each scenario before submitting.
4.3.2. Extended Deployment
di-0
20
40
60
0
50
100
AMT−Worker
# of dialogue sessions
20−Cent Collection
Gave Up
Finished
1
3 2
5 4
0
10
20
30
40
0
20
40
AMT−Worker
# sessions
10−Cent Collection
13 2 4
5
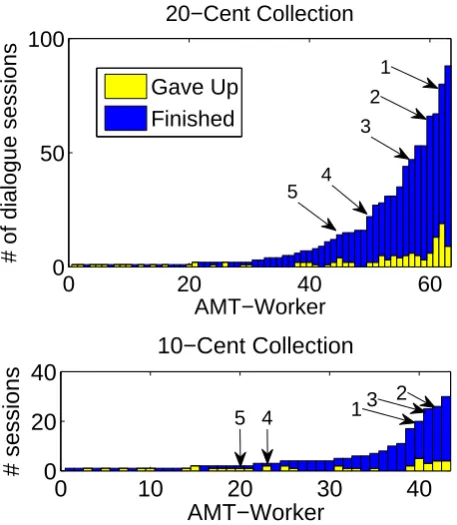
Figure 8: A breakdown of the data collection efforts by worker. For each price point, the workers are sorted in as-cending order of the number of dialogues they contributed to the corpus. Numbers 1-5 identify the five workers who participated in both data collection efforts.
alogues from 63 distinct users, totaling 9,372 audio files. Curious about how price affected the rate of collection, we deployed the same task for $0.10 around a month later. This task was started on a Thursday and left running for 6 days. Though clearly there was less interest in the HIT, we were still able to collect 2,595 utterances over 237 dia-logues from 43 distinct workers. It should be noted that we made no special effort to exclude workers from the earlier task from participating in the $0.10 HIT a month later.
Figure 8 shows histograms for each price point of ses-sions collected from individual workers, as well as the num-ber of tasks they marked “finished” and “give up”. As shown in the plots, five workers participated in the $0.10 task despite being paid more previously. It is interesting to note that they were still willing to participate despite earn-ing half as much. In fact, three of the top four contribu-tors to the second round of data collection were repeat vis-itors. This is consistent with our general observation that many workers from the U.S. do these tasks for fun, and that the small sums of money involved are viewed as an added bonus.
In both deployments a non-trivial number of audio files were recognized as noise or silence. This phenomenon has been observed previously when utterances come from more realistic sources (Ai et al., 2007). Listening to these in con-text, it became apparent that some users required time to familiarize themselves with the recording software. We de-cided to ignore the 1,316 files associated with empty recog-nition results, leaving 10,651 utterances for analysis. Fig-ure 9 summarizes statistics from both deployments.
$0.20 HIT $0.10 HIT
# Sessions 876 237
# Distinct Workers 63 43
# Utterances 8,232 2,419
Avg. # Utts. / Session 9.5 10.2
% Sessions Gave Up 14.7 17.3
Figure 9:Corpora Statistics for$0.10 and$0.20 AMT HITs
Figure 10:Flowchart detailing the transcription procedure.
4.4. Data Transcription
To transcribe our newly collected data, we once again turn to the Amazon Mechanical Turk cloud service. Previ-ous work has explored the use of AMT for transcription to generate high accuracy orthographies. We explore this area further, and show how seeding the transcription interface with recognizer hypotheses enables an automatic detection method for “bad” transcripts.
Figure 10 depicts a flowchart of our transcription pro-cedure. We deployed our entire corpus to AMT in a $0.05 HIT, which asked workers to listen to utterances and cor-rect recognizer hypotheses. Each HIT contains a bundle of 10 utterances for transcription. Once a set of candidate transcripts is complete, we automatically filter transcripts that are likely to be erroneous before moving on to a voting stage where transcripts are combined given the candidates they have accumulated so far. The process was iterated un-til 99.6% of our data were accepted by our voting scheme.
We use two filters to remove poor transcription candi-dates from the pool before voting. First, since the average number of words per HIT is around 45, the likelihood that
noneof them need to be corrected is relatively low. This allows us to detect lazy workers by comparing the submit-ted transcripts with the original hypotheses. We found that 76% of our non-expert transcribers edited at least one word in over 90% of their hits. We assumed that the remaining workers were producing unreliable transcripts, and there-fore discarded their transcripts from further consideration. Second, we assume that a transcriptneeds to be edited if more than two workers have made changes. In this case, we filter out transcripts which match the hypothesis, even if they came from otherwise diligent workers.
90%
3% 6% 1% All Data
78% 6% 14% 2%
Expert−edited Data
Consistent Inconsistent Semi−consistent No agreement
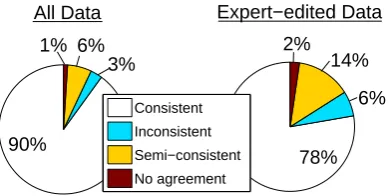
Figure 11: These charts indicate whether the AMT tran-scripts were consistent, semi-consistent, or inconsistent
with the expert transcribers. The semi-consistent case
arises when the experts disagreed, and the AMT transcript matched one their transcripts.
simple majority vote, unless there is no agreement among five unfiltered transcripts, at which point we begin to accept a plurality. We found that 95.2% of our data only needed 3 good transcriptions to pass a simple majority vote. The table below indicates the amount of data we were able to transcribe for a given number of good transcripts.
# Good Transcripts Required (G) % Corpus Transcribed (T)
G 2 3 5 6 7+
T 84.4 95.2 96.3 98.4 99.6
Fifty three audio files, did not have an accepted tran-script even after collecting 15 trantran-scripts. We listened to this audio and discovered anomalies such as foreign lan-guage speech, singing, or garbled noise that caused AMT workers to start guessing at the transcription.
In order to assess the quality of our AMT-transcribed utterances, we had two expert transcribers perform the same HIT for 1,000 utterances randomly selected from the corpus. We compared the orthographies of our two experts and found sentence-level exact agreement to be 93.1%. The AMT-transcripts had 93.2% agreement with the first expert and 93.1% agreement with the second, indicating that our AMT-derived transcripts were of very high quality.
Figure 11 shows a detailed breakdown of agreement, depicting the consistency of the AMT transcripts with those of our experts. For example, of all the data edited by at least one expert, only 6% of the AMT-transcripts were incon-sistent with an expert-agreed-upon transcript. Where the experts disagree, AMT-labels often match one of the two, indicating that the inconsistencies in AMT transcripts are often reasonable. For example, “I want a flight to” and “I want to fly to” was a common disagreement.
Lastly, we also asked workers to annotate each utter-ance with the speaker’s gender. Again, taking a simple vote allows us to determine that a majority of our corpus (69.6%) consists of male speech.
4.5. Data Analysis
Using the AMT-transcribed utterances, we can deduce that the word error rate of our system was 18.1%. We note, however, that, due to the monetary incentives inherent in
0
0.5
1
0
500
1000
Word Error Rate
# Utterances Spoken
10−cent worker
20−cent worker
Figure 12: The number of sessions contributed by each worker is plotted against the WER experienced by that worker.
Amazon Mechanical Turk, this error rate may be artificially low, since workers who found the task frustrating were free to abandon the job. Figure 12 shows the WER for each worker plotted against the number of sessions they con-tributed. It’s clear that workers with high error rates rarely contributed more than a few sessions. To provide a fairer estimate of system performance across users, we take the average WER over all the speakers in our corpus and revise our estimate of WER to 24.4%.
Figure 12 also highlights an interesting phenomenon with respect to system usability. It appears, that workers were willing to interact with the system so long as their WER was less than 30%, while workers who experienced higher WERs were not likely to contribute more than a few sessions. We imagine this threshold may also be a function of price, but do not explore the matter further here.
Upon replaying a number of sessions, we were quite happy with the types of interactions collected. Some dia-logue sessions exposed weaknesses in our system that we intend to correct in future development. The workers were given the opportunity to provide feedback, and many gave us valuable comments, compliments and criticisms, a few of which are shown below.
1. There was no real way to go back when it misunderstood the day I wanted to return. It should have a go back func-tion or command.
2. Fine with cities but really needs to get dates down better.
3. The system just cannot understand me saying “Tulsa”. 4. Was very happy to be able to say two weeks later and not
have to give a return date. System was not able to search for lowest fare during a two week window.
5. I think the HIT would be better if we had a more specific date to use instead of making them up. Thank you, your HITs are very interesting.