Article
Efficient Multimedia Similarity Measurement Using
Similar Elements
Jun Long1 , Lei Zhu1 , Xinpan Yuan2*, Longzhi Sun1
1 2
3 4 5 6
7 8 9 10
11 12
1 SchoolofComputerScienceandEngineering,CentralSouthUniversity,Changsha,410083,PRChina;
2 SchoolofComputerScience,HunanUniversityofTechnology,Zhuzhou,412007,PRChina
* Correspondence:[email protected]
Abstract:Onlinesocialnetworkingtechniquesandlarge-scalemultimediaretrievalaredeveloping rapidly,whichnotonlyhasbroughtgreatconveniencetoourdailylife,butgenerated,collected, andstoredlarge-scalemultimediadataaswell. Thistrendhasputforwardhigherrequirements andgreaterchallengesonmassivemultimediaretrieval.Inthispaper,weinvestigatetheproblem ofimagesimilaritymeasurement,whichisoneofthekeyproblemsofmultimediaretrieval.Firstly, thedefinitionofsimilaritymeasurementofimagesandtherelatednotionsareproposed.Then,an efficientsimilaritymeasurementframeworkisproposed.Besides,wepresentanovelbasicmethod ofsimilaritymeasurementnamedSMIN.Toimprovetheperformanceofsimilaritymeasurement,we carefullydesignanovelindexingstructurecalledSMITempIndex(SMIIforshort).Moreover,we establishanindexofpotentialsimilarvisualwordsoff-linetosolvetoproblemthattheindexcannot bereused. Experimentalevaluationsontworealimagedatasetsdemonstratethattheproposed approachoutperformsstate-of-the-arts.
Keywords:ImageSimilarity;SMI;SMITempIndex;PSMI
13
1. Introduction
14
In the recent years, online social networking techniques and large-scale multimedia systems [1–6]
15
are developing rapidly, which not only has brought great convenience to our daily life, but generated,
16
collected, and stored large-scale multimedia data [7,8], such as text, image [9], audio, video [10].
17
For example, in China, Weibo (https://weibo.com/) has 376 million active users and more than 100
18
million micro-blogs containing short text, image, or short video are posted. The most famous social
19
networking platform all over the world, Facebook (https://facebook.com/), reports 350 million images
20
uploaded everyday in the end of November 2013. More than 400 million tweets with texts and images
21
have been generated by 140 million users on Twitter (http://www.twitter.com/). Another type of
22
common application is multimedia data sharing services. Flickr(https://www.flickr.com/) is one
23
of the most famous photos sharing web site around the world. More than 3.5 million new images
24
uploaded to this platform every day in March 2013. More than 14 million articles are clicked every
25
day on Pinterest (https://www.pinterest.com/). More than 2 billion totally videos stored in YouTube
26
(https://www.youtube.com/), and every minute there are 100 hours of videos which are uploaded
27
to this service. The total watch time exceeded 42 billion minutes on IQIYI (http://www.iqiyi.com/),
28
the most famous online video sharing service in China and number of independent users monthly is
29
more than 230 million monthly. For audio sharing services, the total amount of audio in Himalaya
30
(https://www.ximalaya.com/) had exceeded 15 million as of December 2015. Other web services
31
like Wikipedia (https://en.wikipedia.org/), the largest and most popular free encyclopedia on the
32
Internet, contains more than 40 million articles with pictures in 301 different languages. Other mobile
33
applications such as WeChat, Instagram, etc, provide great convenience for us to share multimedia data.
34
Multimedia Database Similarity
Measurement
Input Multimedia Retrieval System Output
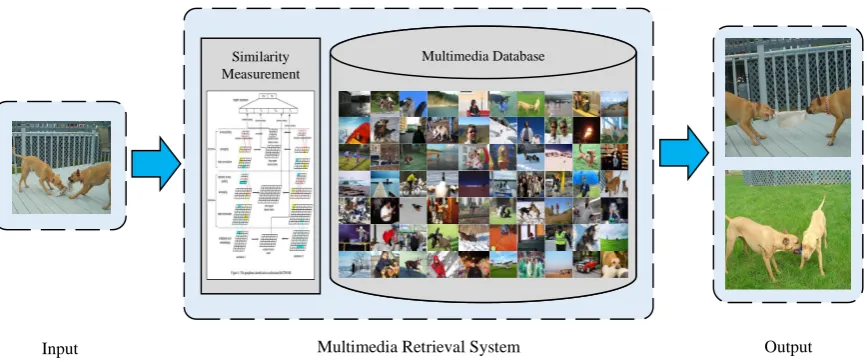
Figure 1.An example of multimedia retrieval via similarity measurement
Thanks to these current rich multimedia services and applications, multimedia techniques [11,12] is
35
changing every aspect of our lives. On the other hand, the emergence of massive multimedia data [13]
36
and applications puts forward greater challenges for techniques of information retrieval.
37
Motivation. Textual similarity measurement is a classical issue in the community of information
38
retrieval and data mining. Lots of approaches have been proposed to improve the performance of
39
similarity measurement. Guo et al [14] proposed to use vectors as basic elements, and the edit distance
40
and Jaccard coefficient are used to calculate the sentence similarity. Li et al. [15] proposed the use of
41
word vectors to represent the meaning of words, and considers the influence of multiple factors such
42
as word meaning, word order and sentence length on the calculation of sentence similarity. Unlike
43
the studies of textual similarity measurement, this work investigates the problem of image similarity
44
measurement, which is a widely applied technique in lots of application scenarios, such as image
45
retrieval [16–19], image near duplicate detection and matching [20,21]. There are two examples shown
46
in Figure1and Figure2which can describe this problem clearly.
47
Example 1: In Figure1, An user has a photo and she want to find out other pictures which are
48
highly similar to it. She can submit an image query into the multimedia retrieval system. The system
49
measures the visual similarity between this photo and the images in the database and after that a set of
50
similar images is returned.
51
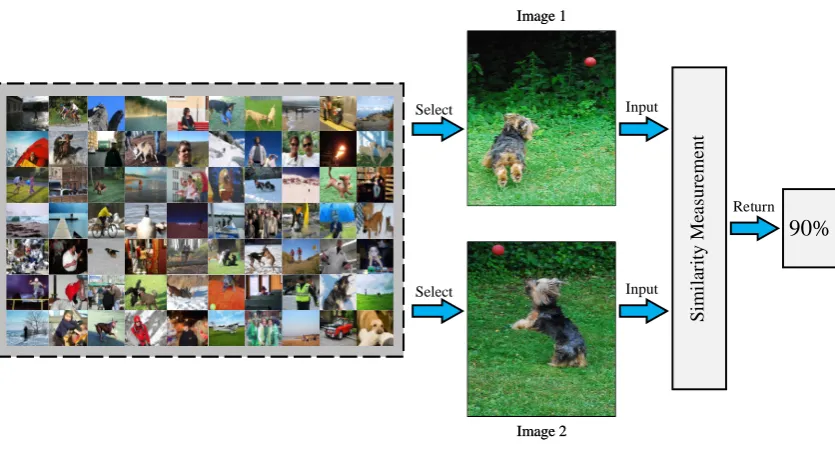
Example 2: Figure2demonstrates another application of image similarity measurement. An user
52
want to measure similarity betweeen two pictures in a dataset quantitatively. She selects two pictures
53
from the image dataset and input them into the similarity measurement system. According to image
54
similarity measurement algorithm, the system will calculate the value of similarity between these
55
images (e.g., 90%).
56
To improve the efficiency and accuracy of image similarity measurement, we present the
57
definition of similarity measurement of images and the relevant notions. An efficient image similarity
58
measurement framework is proposed, in which a coupled CNNs model is used to learn the deep
59
visual feature representations. Compared to the traditional manner (e.g., SIFT), the deep CNN based
60
method can capture more high level semantic features. Besides, we introduce the measurement of
61
similar visual words named SMI Naive (SMIN for short) which is the basic method for similarity
62
measurement, and then propose the SMIN algorithm. After that, to optimize this method, we design
63
a novel indexing structure named SMI Temp Index to reduce the time complexity of calculation. In
64
addition, another technique named index of potential similar visual words is proposed to solve the
65
problem that the index cannot be reused. We could search for the index to perform the measurement
66
of similar visual words without having to repeatedly create a temporary index.
Select
Select
S
im
il
ar
it
y M
ea
sur
em
ent
Image 1
Image 2 Image 1
Image 2
90%
Return Input
Input
Figure 2.An example of multimedia retrieval via similarity measurement
Contributions. Our main contributions can be summarized as follows:
68
• The definition of similarity measurement of images and the related conceptions are introduced.
69
Besides, the image similarity measurement function are designed.
70
• An efficient image similarity measurement framework is designed, which is a combination of
71
a coupled CNNs module, BoVW module and similarity measurement module. Besides, the
72
basic method of image similarity measurement is proposed, which is called SMI Naive (SMIN
73
for short). To improve the performance of similarity measurement, we design two indexing
74
techniques named SMI Temp Index (SMII for short) and Index of Potential Similar Visual Words
75
(PSMI for short).
76
• Extensive experiments are conducted on two real image datasets. Experimental results
77
demonstrate that our solution outperforms the state-of-the-art method.
78
Roadmap. In the remainder of this paper, Section2presents the related works about image
79
similarity measurement and image retrieval. In Section 3, the definition of image similarity
80
measurement and related conceptions are proposed. We present the basic similarity measurement
81
method named SMIN and two improved indexing techniques and algorithms in Section4. Our
82
experimental results are presented in Section5. Finally, we conclude the paper in Section6.
83
2. Related Work
84
In this section, we review the related works of image similarity measurement and image retrieval,
85
which are relevant to this study.
86
Image Similarity Measurement.In recent years, image similarity measurement has become a hot
87
issue in the community of multimedia system [22,23] and information retrieval since the massive image
88
data can be accessed in the Internet. On the other hand, like textual similarity measurement, image
89
similarity measurement is an important technique which can be applied in lots of applications, such
90
as image retrieval, image matching, image recognition and classification, computer vision, etc. Many
91
researchers work for this issue and numerous approaches have been proposed. For example, Coltuc
92
et al. [24] studied the usefulness of the normalized compression distance (NCD for short) for image
93
similarity detection. In their work, they considered correlation between NCD based feature vectors
94
extracted for each image. Albanesi et al. [25] proposed a novel class of image similarity metrics based
on a wavelet decomposition. They investigated the theoretical relationship between the novel class of
96
metrics and the well-known structural similarity index. Abe et al. [26] studied similarity retrieval of
97
trademark images represented by vector graphics. To improve the performance of the system, they
98
introduced centroid distance into the feature extraction. Cicconet et al. [27] studied the problem of
99
detecting duplication of scientific images. They introduced a data-driven solution based on a 3-branch
100
Siamese Convolutional Neural Network which can serve to narrow down the pool of images. For
101
multi-label image retrieval, Zhang et al. [28] proposed a novel deep hashing method named ISDH
102
in which an instance-similarity definition was applied to quantify the pairwise similarity for images
103
holding multiple class labels. Kato et al. [29] proposed a novel solutions for the problem of selecting
104
image pairs that are more likely to match in Structure from Motion. They used Jaccard Similarity and
105
bag-of-visual-words in addition to tf-idf to measure the similarity between images. Wang et al [30]
106
designed a regularized distance metric framework which is named semantic discriminative metric
107
learning (SDML for short). This framework combines geometric mean with normalized divergences
108
and separates images from different classes simultaneously. Guha et al. [31] proposed a new approach
109
called Sparse SNR (SSNR for short) to measuring the similarity between two images using sparse
110
reconstruction. Their measurement does not need to use any prior knowledge about the data type or
111
the application. KHAN et al. [32] proposed two halftoning methods to improve efficiency in generating
112
structurally similar halftone images using Structure Similarity Index Measurement. Their Method I
113
can improves efficiency as well as image quality and Method II can reaches a better image quality with
114
fewer evaluations than pixel-swapping algorithm used in Method I.
115
Near-duplicate image detection is a another problem related to image similarity measurement.
116
To solve the problem of near-duplicate image retrieval, Wang et al. [33] developed a novel spatial
117
descriptor embedding method which encodes the relationship of the SIFT dominant orientation and
118
the exact spatial position between local features and their context. Gadeski et al. [34] proposed an
119
effective algorithm based on MapReduce framework to identify the near duplicates of images from
120
large-scale image sets. Nian et al. [35] investigated this type of problem and presented an effective
121
and efficient local-based representation method named Local-based Binary Representation to encode
122
an image as a binary vector. Zlabinger et al. [36] developed a semi-automatic duplicate detection
123
approach in which single-image-duplicates are detected between sub-images based on a connected
124
component approach and duplicates between images are detected by using min-hashing method.
125
Hsieh et al. [37] designed a novel framework that adopts multiple hash tables in a novel way for quick
126
image matching and efficient duplicate image detection. Based on a hierarchical model, Li et al. [38]
127
introduced an automatic NDIG mining approach by utilizing adaptive global feature clustering and
128
local feature refinement to solve the problem of near duplicate image groups mining. Liu et al. [39]
129
presented a variable-length signature to address the problem of near-duplicate image matching. They
130
used the earth mover’s distance to handle variable-length signatures. Yao et al. [40] developed a
131
novel contextual descriptor which measures the contextual similarity of visual words to immediately
132
discard the mismatches and reduce the count of candidate images. For large scale near-duplicate image
133
retrieval Fedorov et al. [41] introduced a feature representation combining of three local descriptors,
134
which is reproducible and highly discriminative. To improve the efficiency of near-duplicate image
135
retrieval, Yıldız et al. [42] proposed a novel interest point selection method in which the distinctive
136
subset is created with a ranking according to a density map.
137
Image Retrieval.Content-based image retrieval (CBIR for short) [43–46] is to retrieve images by
138
analyzing visual contents, and therefore image representation [18,47] plays an important role in this
139
task. In recent years, the task of CBIR has attracted more and more attentions in the multimedia [21,48,
140
49] and computer vision community [19,20]. Many techniques have been proposed to support efficient
141
multimedia query and image recognition. Scale Invariant Feature Transform (SIFT for short) [50,51]
142
is a classical method to extract visual features, which transforms an image into a large collection of
143
local feature vectors. SIFT includes four main step: (1) scale-space extrema detection; (2) keypoint
144
localization; (3) orientation assignment; (4) Kkeypoint descriptor. It is widely applied in lots of
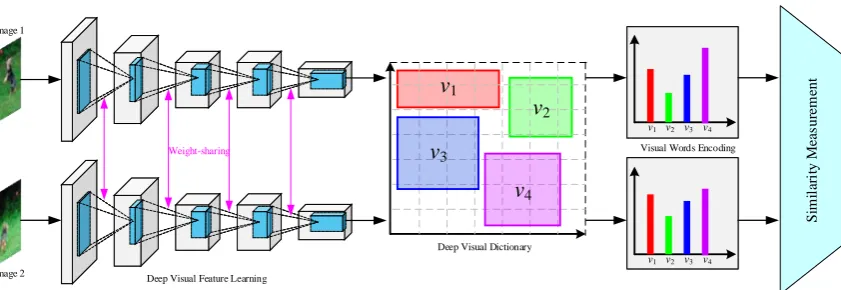
Notation Definition
DI A given database of images
Ii Thei-th image
Wi A visual words set
|W | The number of visual words inW
wi1 Thei-th visual word in the visual words setWi λk The similarity of two visual words
Pk= (wik,w j
k) The similar visual word pair
N
The operator to generates the set of SVWPs ˆ
λ The similarity threshold of predefined
Ξi The set of visual words weight
SimI(Ii(Wi),Ij(Wj)) The image similarity measurement
µi The similarity of visual word
φ The network parameters
Table 1.The summary of notations
researches and applications. For example, Ke et al. [52] proposed a novel image descriptor named
146
PCA-SIFT which combines SIFT techniques and principal components analysis (PCA for short) method.
147
Mortensen et al. [53] proposed a feature descriptor that augments SIFT with a global context vector. This
148
approach adds curvilinear shape information from a much larger neighborhood to reduce mismatches.
149
Liu et al. [54] proposes a novel image fusion method for multi-focus images with dense SIFT. This
150
dense SIFT descriptor can not only be employed as the activity level measurement, but also be used to
151
match the mis-registered pixels between multiple source images to improve the quality of the fused
152
image. Su et al. [55] designed a horizontal or vertical mirror reflection invariant binary descriptor
153
named MBR-SIFT to solve the problem of image matching. Nam et al. [56] introduced a SIFT features
154
based blind watermarking algorithm to address the issue of copyright protection for DIBR 3D images.
155
Charfi et al. [57] developed a bimodal hand identification system based on SIFT descriptors which are
156
extracted from hand shape and palmprint modalities.
157
Bag-of-visual-words [19,58,59](BoVW for short) model is another popular technique for CBIR and
158
image recognition, which was first used in textual classification. This model is a technique to transform
159
images into sparse hierarchical vectors by using visual words, so that a large number of images can be
160
manipulated. Santos et al. [60] presented the first ever method based on the signature-based bag of
161
visual words (S-BoVW for short) paradigm that considers information of texture to generate textual
162
signatures of image blocks for representing images. Karakasis et al. [61] presents an image retrieval
163
framework that uses affine image moment invariants as descriptors of local image areas by BoVW
164
representation. Wang et al. [62] presented an improved practical spatial weighting for BoV (PSW-BoV
165
for short) to alleviate this effect while keep the efficiency.
166
3. Preliminaries
167
In this section, we propose the definition of region of visual interests (RoVI for short) at the first
168
time, then present the notion of region of visual interests query (RoVIQ for short) and the similarity
169
measurement. Besides, we review the techniques of image retrieval which is the base of our work.
170
Table1summarizes the notations frequently used throughout this paper to facilitate the discussion.
171
3.1. Problem Definition
172
Definition 1 (Image object). Let DI be an image dataset and Ii and Ij be two images, Ii,Ij ∈ DI.
173
We define the image object represented by bag-of-visual-word model asIi(Wi)andIj(Wj), whereinWi =
174
{wi
1,wi2, ...,wim}andWj ={w1j,w2j, ...,w j
n}are the visual word set generated by feature extraction fromIi
175
andIj,|Wi|=m and|Wj|=n are the number of visual words in these two sets respectively. In this study, we
176
utilize image object as the representation model of images for the task of image similarity measurement.
Definition 2(Similarity of visual word). Given two image objectsIi(Wi)andIj(Wj), whereinWi = 178
{wi
1,wi2, ...,wim} andWj = {w1j,w2j, ...,wjn}are the visual words set. The similarity of two visual word
179
wik ∈ Wi and wjk ∈ Wj is represented byλk = SimW(wik,wkj),λk ∈ [0, 1], and if these visual words are
180
identical, i.e.,Wi=Wj,λk=1.
181
Definition 3(Similar visual word pair). Given two visual words wik∈ Wiand wjk∈ Wjand the similarity
182
of them isλk=SimW(wik,wjk). Letλ¯ is the similarity threshold predefined, ifλk >λ¯, this visual word pair is
183
called as similar visual word pair (SVWP for short), represented asPk= (wik,w j k).
184
Definition 4(Similarity measurement of two image objects). Given two image objects Ii(Wi) and Ij(Wj). Let operationWiNWj = {P1,P2, ...,Pl}generates the set of SVWPs which contain the visual words inWi andWj, l = |WiNW
j|, and the similarity set of them are denoted asΛ = {λ1,λ2, ...,λl}, ∀λi ∈ Λ,λi > λ¯. Letξik andξkj be the weight of visual word wik and wjk. For image objectsIi(Wi)and Ij(Wj), the sets of their visual words weight are denoted asΞi={ξi1,ξi2, ...,ξil}andΞj ={ξ1j,ξ2j, ...,ξjl}. The
definitional equation of similarity betweenIi(Wi)andIj(Wj)is shown as follows:
SimI(Ii(Wi),Ij(Wj)) =F(m,n,l,Λ,Ξi,Ξj) (1)
where m and n are the number of visual words of Ii(Wi) and Ij(Wj) respectively. It is clearly that
185
SimI(Ii(Wi),Ij(Wj))can meet the systematic similarity measurement criterion.
186
Theorem 1(Monotonicity of similarity function). The similarity measurement SimI(Ii(Wi),Ij(Wj))
187
has the following five monotonicity conditions:
188
• SimI(Ii(Wi),Ij(Wj)) is a monotonic increasing function of weights of visual words in SVWPs,
189
i.e., ∀ξwi
x ∈ Ξi and ξwyj
∈ Ξj, and ∀ξwˆi
x ∈ Ξˆi and ξwˆjy
∈ Ξˆj, if ξ wi
x > ξwˆix and ξwyj
> ξˆ
wjy,
190
F(m,n,l1,Λ,Ξi,Ξj)>F(m,n,l2,Λ, ˆΞi, ˆΞj).
191
• SimI(Ii(Wi),Ij(Wj)) is a monotonic increasing function of the similarities of SVMPs Λ =
192
{λ1,λ2, ...λl}, i.e.,∀λx∈Λandλˆx∈Λ,ˆ F(m,n,l1,Λ,Ξi,Ξj)>F(m,n,l2, ˆΛ,Ξi,Ξj).
193
• SimI(Ii(Wi),Ij(Wj))is a monotonic increasing function of number of SVWPs l, i.e.,∀l1,l2∈N+, if
194
l1>l2,F(m,n,l1,Λ,Ξi,Ξj)>F(m,n,l2,Λ,Ξi,Ξj).
195
• SimI(Ii(Wi),Ij(Wj))is a monotonic decreasing function of weights of visual words which are not in
196
SVWPs, i.e., .
197
• SimI(Ii(Wi),Ij(Wj))is a monotonic decreasing function of the number of visual words which are not
198
in SVWPs, i.e., if r1=m+n−l1and r2 =m+n−l2, r1>r2→l1<l2,F(m,n,l1,Λ,Ξi,Ξj)<
199
F(m,n,l2,Λ,Ξi,Ξj).
200
According to the Definition4and theorem1, the similarity measurement for two image objects is
201
proposed, which is described in formal as follows.
202
Given two image objectsIi(Wi)andIj(Wj),m= |Wi|andn =|Wj|. The sets of their visual
203
words weight areΞi ={ξ1i,ξ2i, ...ξil}andΞj ={ξ1j,ξ2j, ...ξjl}. The SVMPs set ofIi(Wi)andIj(Wj)is
204
{P1,P2, ...,Pl},l ≤ min(m,n), and the similarities set of them isΛ= {λ1,λ2, ...λl}. The similarity
205
measurement functionSimI(Ii(Wi),Ij(Wj))is:
206
SimI(Ii(Wi),Ij(Wj)) =
l ∑ k=1
λkξikξkj
s m ∑ k=1
ξik
n ∑ k=1
ξjk
s l ∑ k=1
λk2ξikξkj+
m ∑ k=l+1
ξik
n ∑ k=l+1
ξkj
v
1v
2v
3v
4v1 v2 v3 v4 v1 v2 v3 v4 v1 v2 v3 v4 v1 v2 v3 v4 v1 v2 v3 v4 v1 v2 v3 v4 Visual Words Encoding
Deep Visual Dictionary
S
im
il
ar
it
y M
ea
sur
em
ent
Deep Visual Feature Learning
Weight-sharing
Image 1
Image 2
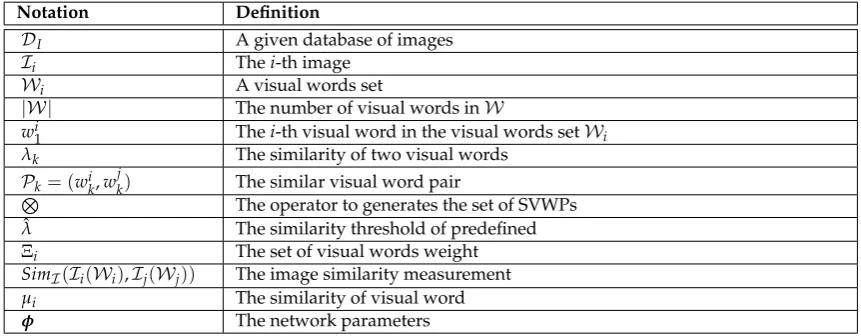
Figure 3. The framework of image similarity measurement. This framework employs a coupled
CNNs network to learn the deep visual feature representations of the two input images. Across each layers of two CNNs, weight-sharing strategy is used to (1) learn the co-occurrence visual patterns, and (2) reduce the number of model parameters. Based on these visual representations, a deep visual dictionary is built byk-means method, which is used to encode the input images. After the generation of visual word representations of inputs, the proposed image similarity measurement is used to measure the visual similarity between the two input images.
Function2apparently meet the monotonicity described in Theorem1. On the other hand, if
207
these two image objects are identical, i.e.,Ii(Wi) =Ij(Wj),Wi =Wj,m=n=l, andξki =ξkj, then
208
SimI(Ii(Wi),Ij(Wj)) =1.
209
Theorem 2 (dissatisfying commutative law). The similarity measurement SimI(Ii(Wi),Ij(Wj)) dissatisfy commutative law, i.e.,
SimI(Ii(Wi),Ij(Wj))6=SimI(Ij(Wj),Ii(Wi))
In general, some visual words (e.g., noise words) in image objects have negative or reverse effects
210
on the expression of the whole image. The SMI has a penalty effect on non-similar visual elements
211
according to Theorem1. this feature of the SMI has high accuracy for the similarity measurement of
212
images.
213
4. Image Similarity Measurement Method
214
In this section, an efficient image similarity measurement framework via deep visual words is
215
proposed, which is a combination of deep visual feature learning and Bag-of-Visual-Words technique.
216
Besides, the similarity measurement algorithm and the optimization technique are introduced.
217
4.1. The framework of image similarity measurement
218
To effectively measure the similarity between two images via similar visual words, we carefully
219
design a framework of image similarity measurement by combining the deep learning technique and
220
BoVW model. Instead of the traditional visual words representation via SIFT descriptor and BoVW, we
221
propose to use CNN to generate deep visual representations of images. Comparing to the traditional
222
manner, this scheme can capture the rich high-level semantic concepts, which is more powerful for the
223
image similarity measurement. Specifically, this framework uses a coupled CNNs network structure
224
that recieve two input images,I1andI2, and generateθ-dimensional deep visual representations,
225
i.e.,(ζ(1)1 ,ζ(2)1 , ...,ζ(1θ)) =Cnn1(I1;φ),(ζ(1)2 ,ζ2(2), ...,ζ(2θ)) =Cnn2(I2;φ), where(ζ(1)1 ,ζ(2)1 , ...,ζ(1θ))and
226
(ζ(1)2 ,ζ2(2), ...,ζ2(θ))are the visual feature vector ofI1andI2,φis the network parameter. To learn
227
co-occurrence visual patterns between the two inputs, a weight-sharing strategy is employed bewteen
these two CNNs. On the other hand, weight-sharing can reduce the number of the network parameters
229
significantly. For deep visual dictionary construction,k-means method is utilized to cluster these deep
230
feature vectors intokgroups, i.e.,k-Means({(ζ(1),ζ(2), ...,ζ(θ))}n) = {G}m, wherenis the number
231
of input images, m is the number of groups. Accroding to the deep visual dictionary, the input
232
images are encoded into visual words representations, i.e.,(ξi1,ξi2, ...,ξim) = TF-IDF(wi1,wi2, ...,wim),
233
(ξ1j,ξ2j, ...,ξmj ) =TF-IDF(w1j,w2j, ...,wmj ), whereTF-IDFis used to calculate the weight of each visual
234
word,wis a weighted visual word. After the visual words representation generation, the paired visual
235
words vectors are fed into the similarity measurement module to measure the visual similarity via
236
similar visual words, which is discussed in Section4.2and4.3.
237
In this work, we utilize pre-trained CNN model, AlexNet [63], to construct the coupled CNNs
238
network. This network consists of five convolutional layers, three fully-connected layers and a
239
1000-way softmax layer. The 5-th convolutional representations 13×13×256 are used as the visual
240
feature vectors for visual words generation. Besides, the input images are resized as 227×227 pixels.
241
4.2. The Measurement of Similar Visual Words
242
SMI is subject to the time complexity of the measurement of similar visual words.µirepresents
243
the similarity of a similar visual word as shown in the following formula:
244
µi =
arg maxb
j∈SBSimI(ai,bj), i f >µ0
0, i f <µ0
(3)
whereSimI(ai,bj)represents the cosine of the angle between two vectors as the measurement of
245
similarity.µ0is a judgment of the similarity threshold.
246
We give an intuitive way to measure similar visual words. The pseudo-code of the algorithm is
247
shown in Algorithm1. In this work, the double loop cosine method is called to be SMI Naive (SMIN
248
for short).
249
Algorithm 1 SMIN Algorithm
1: InputSA,SB,µ0.
2: Output:µ.
3: Initializing:µ←∅;
4: Initializing:S←∅; 5: Initializing:NS←∅; 6: Initializing:maxsim←0; 7: foreachWi∈SAdo 8: foreachW0
j ∈SBdo
9: ifcos(Wi,W0j)then 10: maxsim←cos(Wi,W0j); 11: end if
12: ifmaxsim≥µ0then
13: S.Add(Wi); 14: µ.Add(maxsim); 15: else
16: NS.Add(Wi); 17: µ.Add(0);
18: end if 19: end for 20: end for 21: return µ;
4.3. The Optimization of Calculating Similar Visual Words
250
In the context of massive multimedia data, the multimedia retrieval system or image similarity
251
measurement system requires an efficient sentence similarity measurement algorithm, the time
252
complexity of the SMI focuses on the optimization of calculating similar visual words.
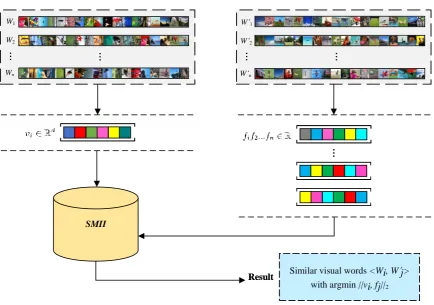
SMII
Similar visual words <Wi, W’j>
with argmin ||vi, fj||2
Result Similar visual words <Wi, W’j> with argmin ||vi, fj||2
Result
W’1
W’2
W’n
...
...
W’1
W’2
W’n
...
...
W1
W2
Wn
...
...
W1
W2
Wn
...
...
...
Figure 4.The processing of similarity measurement via SMII
SMI Temp Index.To reduce the double loop cos calculation to 1 cycle, a further approach is to
254
construct an indexγi ofSBfor each vectoraiinSA. According to experience, the dimension of the
255
visual word vector is generally 200-300 dimensions to get better results.
256
For a vectorai inSA, we search for the vectorbjwith the highest similarity in the temp index
257
γi, so that the process requires only one similarity calculation. Thentimes calculations of similar
258
visual words<ai,bj>are reduced to vector searching, thereby reducing the execution time ofSMI.
259
However, there is a flaw that when every time a similar element of a sentence is calculated, a temp
260
index needs to be built once, and the index cannot be reused. The temp index approach is called to be
261
SMI Temp Index (SMII for short), as shown in Figure4.
262
Index of Potential Similar Visual Words.In order to solve the problem that the index cannot be
263
reused, we establish an index of potential similar visual words off-line in the process of word vector
264
training. We could search for the index to perform the measurement of similar visual words without
265
having to repeatedly create a temporary index. The main steps for index of potential similar visual
266
words construction is shown as follows:
267
• Establishing an index for all the visual word vector set by trained word vector model.
268
• Traversing any vectorvto search the index to get a return set. In this set, the potential similar
269
visual words are abstained with the similarity is greater than the thresholdµ0, in similarity
270
descending order.
271
• The physic indexing structure of potential similar visual words could be implemented by a
272
Huffman tree.
273
According to the hierarchical Softmax strategy in Word2Vec, an original Word2Vec Huffman tree
274
constructed on the basis of the visual words frequency, and each node (except the root node) represents
275
a visual word and its corresponding vector.
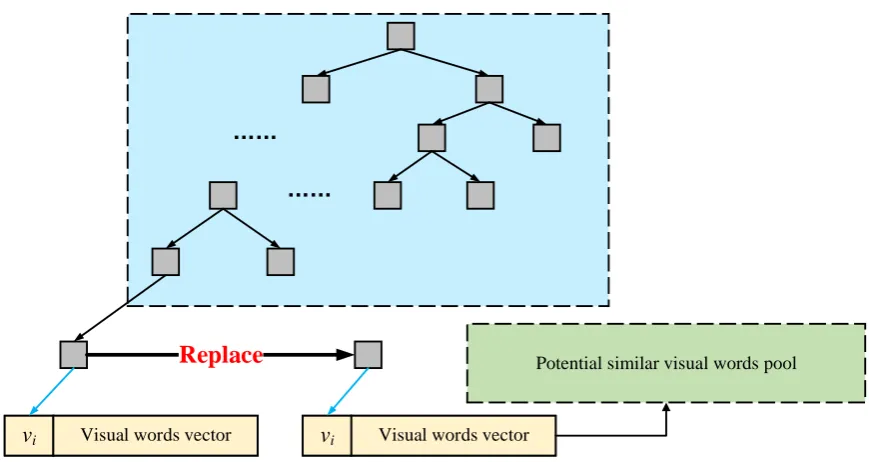
……
……
v
i Visual words vectorv
i Visual words vectorv
v
ii Visual words vectorVisual words vectorPotential similar visual words pool
Replace
Figure 5.The index structure of potential similar visual words
We try to replace the vector with potential similar visual words. Thus each node of tree represents
277
a visual word and its corresponding potential similar visual words. The index structure is illustrated
278
by Figure5:
279
We call the methods using global index of potential similar visual words as PSMI. Algorithm2
280
illustrates the pseudo-code of PSMI.
281
Algorithm 2 PSMI Algorithm
1: Input:SA,SB,µ0
2: Output:µ.
3: Initializing:µ←∅;
4: Initializing:S←∅; 5: Initializing:NS←∅; 6: Initializing:P ←∅; 7: Initializing:maxsim←0; 8: foreachWi∈SAdo
9: P ←Hu f f manSearch(Wi); 10: foreachW0
j ∈SBdo
11: foreachpk∈ Pdo
12: ifWj.equal(pk.vector)then 13: S.Add(Wi);
14: µ.Add(pk.sim); 15: Break to loopWi; 16: end if
17: end for 18: end for 19: NS.Add(Wi); 20: µ.Add(0);
21: end for 22: return µ;
Algorithm2demonstrates the processing of the PSMI Algorithm. Firstly, for each visual words
282
vectorWi ∈ SA, the algorithm executes the procedureHu f f manSearch(Wi)to get the node of the
283
huffman tree which containsWiand stored it inP. Then, for eachW0
j ∈SB, the algorithm select each
284
pkfromPand check ifWjis equal topk.vectoror not. if them are equal, the algorithm addsWiinto
285
setSand addspk.simintoµ. Then break to the outer loop. IfWiandpk.vectorare not equal, then adds
286
Wiinto setNSand add 0 intoµ.
Samples of Flickr
Samples of ImageNet
Figure 6.Some samples of Flickr and ImageNet dataset
4.4. Time complexity analysis of SMIN, SMII, PSMI
288
Suppose that the number of image pairs to be measured isΓ, the average number of visual word
289
vectors of the visual word vector setSAis ¯SA, and the average number of visual word vectors of the
290
visual word vector setSBis ¯SB,mrepresents the dimension of the vector.
291
For SMIN.Whether all elements which constitute similar visual wordsµiare calculated once
292
by using formula, and the time consumption of calculation is determined by the number of vector
293
dimension, the time complexity of SMIN isO(Γ∗S¯A∗S¯B∗COS), whereinCOSis the time of cosine
294
functioncos(.)between vectorWiandWj0, which equals tod. Thus the time complexity of SMIN is
295
O(Γ∗S¯A∗S¯B∗m).
296
For SMII.To reduce the number of similar visual word calculations in method SMIN, the method
297
of constructing an index is used, the index is equivalent to fuzzy search, and then the similar element
298
is calculated to determine whether it constitutes a similar element, the time complexity of SMII is
299
O(Γ∗S¯A∗I NDEX+Γ∗S¯B∗log(S¯A)∗m), whereI NDEXis the time to index each word vector, and
300
log(S¯A)is the number of times to look up in the index. Since the I NDEXvalue is small,Γ∗S¯A∗
301
I NDEXcan be ignored. The time complexity of SMII approximately equals toO(Γ∗n∗log(S¯A)∗m).
302
For PSMI.PSMI constructs the Huffman tree offline, in which the potential similar elements of
303
all word vectors are stored, and only the similar elements are calculated by searching. Thus, the time
304
complexity of PSMI isO(Γ∗S¯B∗log(|DI|)), wherein|DI|is the total number of the dictionary.
305
5. PERFORMANCE EVALUATION
306
In this section, we present results of a comprehensive performance study on real image datasets
307
Flickr and ImageNet to evaluate the efficiency and scalability of the proposed techniques. Specifically,
308
we evaluate the effectiveness of the following indexing techniques for region of visual interests search
309
on road network.
310
• WJWJ is the word2Vec technique proposed inhttps://github.com/jsksxs360/Word2Vec. In our
311
experiments, we modify this technique for visual words.
312
• WMDWMD is the word2Vec technique, which is based on moving distance, is proposed in
313
https://github.com/crtomirmajer/wmd4j.
314
• SMINSMIN is the double loop cosine calculation technique proposed in Section 4.
315
• SMIISMII is the advanced technique of SMIN, which is proposed in Section 4.
2 0 4 0 6 0 8 0 1 0 0
0
1 0 2 0 3 0 4 0 5 0 6 0 7 0 8 0 9 0 1 0 0
H
IT
R
A
T
E
(%
)
# O F V I S U A L W O R D S
W J
S M I
W M D
(a) Evaluation on Flickr
5 0 1 0 0 1 5 0 2 0 0 2 5 0
0
2 0 4 0 6 0 8 0 1 0 0
H
IT
R
A
T
E
(%
)
# O F V I S U A L W O R D S
W J
S M I
W M D
(b) Evaluation on ImageNet
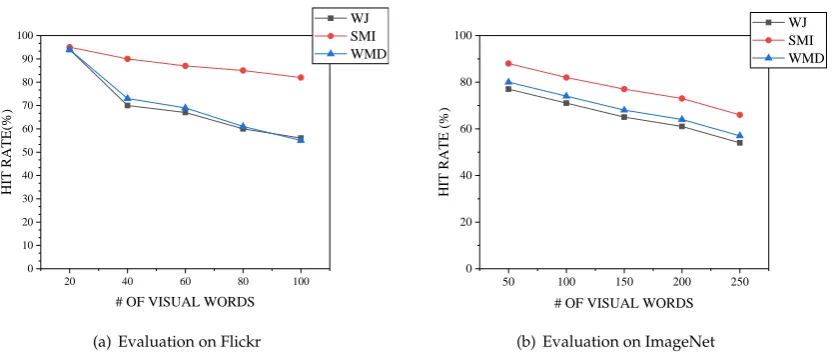
Figure 7.Evaluation on the number of visual words on Flickr and ImageNet
• PSMIPSMI is the potential similar visual words technique of SMII, which is also proposed in
317
Section 4.
318
Datasets. Performance of various algorithms is evaluated on both real image datasets. We
319
first evaluate these algorithms onFlickris obtained by crawling millions image the photo-sharing
320
site Flickr(http://www.flickr.com/). For the scalability and performance evaluation, we randomly
321
sampled five sub datasets whose sizes vary from 200,000 to 1000,000 from the image dataset. Similarly,
322
another image datasetImageNet, which is widely used in image processing and computer vision, is
323
used to evaluate the performance of these algorithms. DatasetImageNetnot only includes 14,197,122
324
images, but also contained 1.2 million images with SIFT features. We generateImageNetdataset with
325
varying size from 20K to 1M. Some samples of these two datasets are shown in Figure6.
326
Workload. A workload for the region of visual interests query consists of 100 queries. The
327
accuracy of these algorithm and the query response time is employed to evaluate the performance of
328
the algorithms. The image dataset size grows from 0.2M to 1M; the number of the query visual words
329
of datasetFlickrchanges from 20 to 100; the number of the query visual words of datasetImageNet
330
varies from 50 to 250. The image dataset size, the number of the query visual words of datasetFlickr,
331
and the number of the query visual words of datasetImageNet set to 0.2M, 40, 100 respectively.
332
Experiments are run on a PC with Intel Xeon 2.60GHz dual CPU and 16G memory running Ubuntu.
333
All algorithms in the experiments are implemented in Java. Note that we only consider the algorithms
334
WJ, SMI, WDM in accuracy comparison, because the SMIN, SMII, PSMI algorithms have the same
335
error tolerance.
336
Evaluating hit rate on the number of visual words. We evaluate the hit rate on the number of
337
query visual words on Flickr and ImageNet dataset shown in Figure9. The experiment on Flickr is
338
shown in Figure9(a). It is clear that the hit rate of WJ, SMI and WMD decrease with the rising of the
339
number of visual words. Specifically, the hit rate of our method, SMI, is the highest all the time. It
340
descends slowly from around 90% to about 85%. On the other hand, the hit rate of WJ and WMD are
341
very close. In the interval[20, 40], they go down rapidly and after that the decrement of them become
342
moderate. At 100, the hit rate of WJ is a litter higher than WMD, and both of them are much lower
343
than SMI. In Figure9(b), all of the decreasing trends are similar. Apparently, the hit rate of SMI is the
344
highest, which goes down gradually with the increasing of the number of visual words. On ImageNet
345
dataset, the hit rate of WMD is a litter higher than WJ all the time.
346
Evaluating response time on the number of visual words.We evaluate the response time on the
347
number of visual words on Flickr and ImageNet dataset shown in Figure10. In Figure10(a), with the
348
increment of number of visual words, the response time of PSMI has a slight growth, which is the
349
lowest in these methods. The increasing trends of SMII is very moderate too, but it is slightly inferior
2 0 4 0 6 0 8 0 1 0 0
0
5 0 0 0 1 0 0 0 0 1 5 0 0 0 2 0 0 0 0
R
E
S
P
O
N
S
E
T
IM
E
(m
s)
# O F V I S U A L W O R D S
S M I N S M I I P S M I
W M D
(a) Evaluation on Flickr
5 0 1 0 0 1 5 0 2 0 0 2 5 0
0
1 0 0 0 0 2 0 0 0 0 3 0 0 0 0 4 0 0 0 0 5 0 0 0 0 6 0 0 0 0 7 0 0 0 0
R
E
S
P
O
N
S
E
T
IM
E
(m
s)
# O F V I S U A L W O R D S
S M I N S M I I P S M I
W M D
(b) Evaluation on ImageNet
Figure 8.Evaluation on the number of visual words on Flickr and ImageNet
0 . 2 0 . 4 0 . 6 0 . 8 1 . 0
0
2 0 4 0 6 0 8 0 1 0 0
H
IT
R
A
T
E
(%
)
# O F I M A G E S
W J
S M I
W M D
(a) Evaluation on Flickr
0 . 2 0 . 4 0 . 6 0 . 8 1 . 0
0
2 0 4 0 6 0 8 0 1 0 0
H
IT
R
A
T
E
(%
)
# O F I M A G E S
W J
S M I
W M D
(b) Evaluation on ImageNet
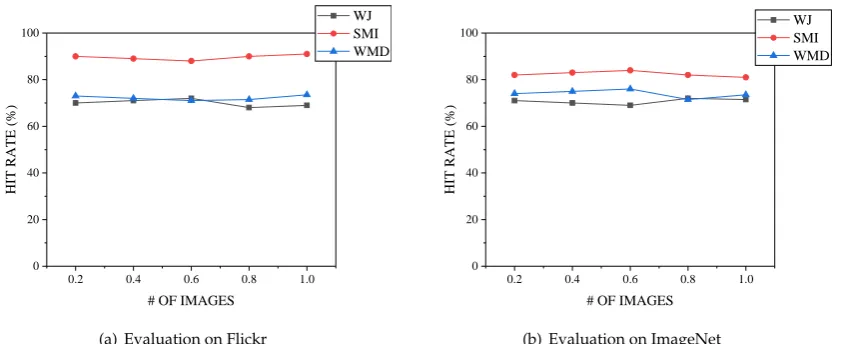
Figure 9.Evaluation on the number of images on Flickr and ImageNet
to PSMI. Like PSMI and SMII, the performance of SMIN shows a moderate decrement with the rising
351
of spatial similarity threshold. Although the response time of it is higher than the former two, it is
352
much lower than WMD which has a fast growth in the interval of 20, 100. Figure10(b) illustrates that
353
the efficiency of PSMI is almost the same with the increment of number of visual words, which is the
354
highest amount these four methods. Like the experiment on Flickr, the performance of both SMII and
355
SMIN increase gradually and they are much better than WMD.
356
Evaluating hit rate on the number of images.We evaluate the hit rate on the number of images
357
on Flickr and ImageNet dataset shown in Figure9. Figure9(a) demonstrates clearly that the hit rate of
358
SMI is much higher than WJ and WMD. With the increasing of images number, it fluctuates slightly.
359
the hit rate of WMD is almost unchanged with the increasing of number of images. On the other hand,
360
the hit rate of WJ shows a moderate growth in the interval of 0.2, 0.6 and after that it drops and it is
361
a litter lower than WMD. Clearly, the performance of SMI is the best. Figure9(b) shows that the hit
362
rate of SMI grows slightly in[0.2, .06]and then go down weakly, which is higher than two others. Like
363
the trend of SMI, the hit rate of WMD hit the maximum value at 0.6 and after that it decreases in the
364
interval of[0.6, 0.8]. With this just the opposite is that the hit rate of WJ has a moderate decrement in
365
[0.2, 0.6]and it rises after 0.6.
366
Evaluating response time on the number of images.We evaluate response time on different size
367
of query region on Flickr and ImageNet dataset shown in Figure10. We can find from Figure10(a)
0 . 2 0 . 4 0 . 6 0 . 8 1 . 0
0
5 0 0 0 1 0 0 0 0 1 5 0 0 0 2 0 0 0 0 2 5 0 0 0 3 0 0 0 0 3 5 0 0 0
R
E
S
P
O
N
S
E
T
IM
E
(m
s)
S I Z E O F D A T A S E T
S M I N S M I I P S M I
W M D
(a) Evaluation on Flickr
0 . 2 0 . 4 0 . 6 0 . 8 1 . 0
0
2 0 0 0 0 4 0 0 0 0 6 0 0 0 0 8 0 0 0 0 1 0 0 0 0 0
R
E
S
P
O
N
S
E
T
IM
E
(m
s)
S I Z E O F D A T A S E T
S M I N S M I I P S M I
W M D
(b) Evaluation on ImageNet
Figure 10.Evaluation on the number of images on Flickr and ImageNet
that the response time of PSMI and SMII increase slowly with the increasing of size of dataset. Both
369
of them are much better than the others. The growth rate of SMIN is a litter higher than the two
370
formers. The efficiency time of WMD is the worst. It grows rapidly and at 1.0 it is more than 30000ms.
371
In Figure10(b), we see that the growth of WMD is the fastest too. Like the situation on Flickr, the
372
performance of WMD is the worst among them. By comparison, the upward trends of SMII and PSMI
373
are much more moderate, and PSMI shows the best performance.
374
6. Conclusion
375
In this paper, we investigate the problem of image similarity measurement that is a significant issue
376
in many applications. Firstly we proposed the definition of image objects and similarity measurement
377
of two images and related notions. Then, an efficient image similarity measuremnt framework
378
is proposed, which is a combination of a coupled CNNs network, BoVW model and similarity
379
measurement via similar visual words. Based on Word2Vec, we develop the basic method of image
380
similarity measurement, named SMIN. To improve the performance of similarity calculation, we
381
improve this method and propose SMI Temp Index. To solve the problem of that the index cannot be
382
reused, we develop a novel indexing technique called Index of Potential Similar Visual Words (PSMI).
383
The experimental evaluation on real geo-multimedia dataset shows that our solution outperforms the
384
state-of-the-art method.
385
Author Contributions:conceptualization, J.L. and L.Z.; methodology, L.Z.; software, X.Y. and L.S.; validation,
386
L.Z., X.Y. and L.S.; formal analysis, L.Z.; investigation, L.Z. and X.Y; writing–original draft preparation, L.Z.;
387
writing–review and editing, J.L.; visualization, L.S.; supervision, J.L.
388
Acknowledgments: This work was supported in part by the National Natural Science Foundation of China
389
(61702560), project (2018JJ3691, 2016JC2011, 2016JC2018) of Science and Technology Plan of Hunan Province, the
390
Science and Technology Plan of Hunan under Grant 2016TP1003, and the Research and Innovation Project of
391
Central South University Graduate Students(2018zzts177,2018zzts588).
392
Conflicts of Interest:The authors declare no conflict of interest.
393
References
394
1. Wang, Y., Lin, X., & Zhang, Q. (2013, October). Towards metric fusion on multi-view data: a cross-view based
395
graph random walk approach. In Proceedings of the 22nd ACM international conference on Information &
396
Knowledge Management (pp. 805-810). ACM.
397
2. Wang, Y., Lin, X., Wu, L., Zhang, W., & Zhang, Q. (2014, November). Exploiting correlation consensus:
398
Towards subspace clustering for multi-modal data. In Proceedings of the 22nd ACM international conference
399
on Multimedia (pp. 981-984). ACM.
3. Zhang, C., Lin, Y., Zhu, L., Liu, A., Zhang, Z., & Huang, F. (2019). CNN-VWII: An efficient approach for
401
large-scale video retrieval by image queries. Pattern Recognition Letters, 123, 82-88.
402
4. Long, J., Zhu, L., Zhang, C., Yang, Z., Lin, Y., & Chen, R. (2018). Efficient interactive search for geo-tagged
403
multimedia data. Multimedia Tools and Applications, 1-30.
404
5. Wang, Y., Lin, X., Wu, L., & Zhang, W. (2015, October). Effective multi-query expansions: Robust landmark
405
retrieval. In Proceedings of the 23rd ACM international conference on Multimedia (pp. 79-88). ACM.
406
6. Wang, Y., Lin, X., Wu, L., Zhang, W., Zhang, Q., & Huang, X. (2015). Robust subspace clustering for
407
multi-view data by exploiting correlation consensus. IEEE Transactions on Image Processing, 24(11),
408
3939-3949.
409
7. Long, J., Zhu, L., Yang, Z., Zhang, C., & Yuan, X. (2018). Temporal Activity Path Based Character Correction
410
in Heterogeneous Social Networks via Multimedia Sources. Advances in Multimedia, 2018.
411
8. Wang, Y., Lin, X., Wu, L., & Zhang, W. (2017). Effective multi-query expansions: Collaborative deep networks
412
for robust landmark retrieval. IEEE Transactions on Image Processing, 26(3), 1393-1404.
413
9. Wang, Y., Lin, X., Wu, L., Zhang, W., & Zhang, Q. (2015, August). Lbmch: Learning bridging mapping
414
for cross-modal hashing. In Proceedings of the 38th international ACM SIGIR conference on research and
415
development in information retrieval (pp. 999-1002). ACM.
416
10. Wu, L., Wang, Y., Gao, J., & Li, X. (2018). Where-and-when to look: Deep siamese attention networks for
417
video-based person re-identification. IEEE Transactions on Multimedia, 21(6), 1412-1424.
418
11. Wang, Y., Wenjie, Z., Wu, L., Lin, X., Fang, M., & Pan, S. (2016, January). Iterative views agreement:
419
An iterative low-rank based structured optimization method to multi-view spectral clustering. In IJCAI
420
International Joint Conference on Artificial Intelligence.
421
12. Wu, L., Wang, Y., Ge, Z., Hu, Q., & Li, X. (2018). Structured deep hashing with convolutional neural networks
422
for fast person re-identification. Computer Vision and Image Understanding, 167, 63-73.
423
13. Wang, Y., & Wu, L. (2018). Beyond low-rank representations: Orthogonal clustering basis reconstruction
424
with optimized graph structure for multi-view spectral clustering. Neural Networks, 103, 1-8.
425
14. Guo, S., & Xing, D. (2016). Sentence similarity calculation based on word vector and its application research
426
[D]. Modern Electronics Technique.
427
15. Li F., Hou J., Zeng R., & Ling C. (2017). Research on Multi-Feature Sentence Similarity Computing Method
428
with Word Embedding [J]. Journal of Frontiers of Computer Science and Technology.
429
16. Wang, Y., Lin, X., Zhang, Q., & Wu, L. (2014, May). Shifting hypergraphs by probabilistic voting. In
430
Pacific-Asia Conference on Knowledge Discovery and Data Mining (pp. 234-246). Springer, Cham.
431
17. Zhang, C., Wu, L., & Wang, Y. (2019). Crossing generative adversarial networks for cross-view person
432
re-identification. Neurocomputing, 340, 259-269.
433
18. Wu, L., Wang, Y., Gao, J., & Li, X. (2018). Deep adaptive feature embedding with local sample distributions
434
for person re-identification. Pattern Recognition, 73, 275-288.
435
19. Wang, Y., Zhang, W., Wu, L., Lin, X., & Zhao, X. (2015). Unsupervised metric fusion over multiview data by
436
graph random walk-based cross-view diffusion. IEEE transactions on neural networks and learning systems,
437
28(1), 57-70.
438
20. Wang, Y., Wu, L., Lin, X., & Gao, J. (2018). Multiview spectral clustering via structured low-rank matrix
439
factorization. IEEE transactions on neural networks and learning systems, 29(10), 4833-4843.
440
21. Wu, L., Wang, Y., Li, X., & Gao, J. (2018). Deep attention-based spatially recursive networks for fine-grained
441
visual recognition. IEEE transactions on cybernetics, 49(5), 1791-1802.
442
22. Zhang, C., Cheng, K., Zhu, L., Chen, R., Zhang, Z., & Huang, F. (2018). Efficient continuous top-k geo-image
443
search on road network. Multimedia Tools and Applications, 1-30.
444
23. Wu, L., & Wang, Y. (2017). Robust hashing for multi-view data: Jointly learning low-rank kernelized
445
similarity consensus and hash functions. Image and Vision Computing, 57, 58-66.
446
24. Coltuc, D., Datcu, M., & Coltuc, D. (2018). On the use of normalized compression distances for image
447
similarity detection. Entropy, 20(2), 99.
448
25. Albanesi, M. G., Amadeo, R., Bertoluzza, S., & Maggi, G. (2018). A new class of wavelet-based metrics for
449
image similarity assessment. Journal of Mathematical Imaging and Vision, 60(1), 109-127.
450
26. Abe, K., Morita, H., & Hayashi, T. (2018, February). Similarity Retrieval of Trademark Images by Vector
451
Graphics Based on Shape Characteristics of Components. In Proceedings of the 2018 10th International
452
Conference on Computer and Automation Engineering (pp. 82-86). ACM.
27. Cicconet, M., Elliott, H., Richmond, D. L., Wainstock, D., & Walsh, M. (2018). Image Forensics:
454
Detecting duplication of scientific images with manipulation-invariant image similarity. arXiv preprint
455
arXiv:1802.06515.
456
28. Zhang, Z., Zou, Q., Wang, Q., Lin, Y., & Li, Q. (2018). Instance similarity deep hashing for multi-label image
457
retrieval. arXiv preprint arXiv:1803.02987.
458
29. Kato, T., Shimizu, I., & Pajdla, T. (2017). Selecting image pairs for SfM by introducing Jaccard Similarity. IPSJ
459
Transactions on Computer Vision and Applications, 9(1), 12.
460
30. Wang, H., Feng, L., Zhang, J., & Liu, Y. (2016). Semantic discriminative metric learning for image similarity
461
measurement. IEEE Transactions on Multimedia, 18(8), 1579-1589.
462
31. Guha, T., Ward, R. K., & Aboulnasr, T. (2013, May). Image similarity measurement from sparse reconstruction
463
errors. In 2013 IEEE International Conference on Acoustics, Speech and Signal Processing (pp. 1937-1941).
464
IEEE.
465
32. Khan, A., Aguirre, H., & Tanaka, K. (2012). Improving the Efficiency in Halftone Image Generation Based
466
on Structure Similarity Index Measurement. IEICE TRANSACTIONS on Information and Systems, 95(10),
467
2495-2504.
468
33. Wang, Y., & Zhou, Z. (2018). Spatial descriptor embedding for near-duplicate image retrieval. International
469
Journal of Embedded Systems, 10(3), 241-247.
470
34. Zhao, W., Luo, H., Peng, J., & Fan, J. (2017). MapReduce-based clustering for near-duplicate image
471
identification. Multimedia Tools and Applications, 76(22), 23291-23307.
472
35. Nian, F., Li, T., Wu, X., Gao, Q., & Li, F. (2016). Efficient near-duplicate image detection with a local-based
473
binary representation. Multimedia Tools and Applications, 75(5), 2435-2452.
474
36. Zlabinger, M., & Hanbury, A. (2017, April). Finding duplicate images in biology papers. In Proceedings of
475
the Symposium on Applied Computing (pp. 957-959). ACM.
476
37. Hsieh, S. L., Chen, C. C., & Chen, C. R. (2015). A novel approach to detecting duplicate images using multiple
477
hash tables. Multimedia Tools and Applications, 74(13), 4947-4964.
478
38. Li, J., Qian, X., Li, Q., Zhao, Y., Wang, L., & Tang, Y. Y. (2015). Mining near duplicate image groups.
479
Multimedia Tools and Applications, 74(2), 655-669.
480
39. Liu, L., Lu, Y., & Suen, C. Y. (2015). Variable-length signature for near-duplicate image matching. IEEE
481
Transactions on Image Processing, 24(4), 1282-1296.
482
40. Yao, J., Yang, B., & Zhu, Q. (2014). Near-duplicate image retrieval based on contextual descriptor. IEEE
483
signal processing letters, 22(9), 1404-1408.
484
41. Fedorov, S., & Kacher, O. (2016). Large scale near-duplicate image retrieval using Triples of Adjacent Ranked
485
Features (TARF) with embedded geometric information. arXiv preprint arXiv:1603.06093.
486
42. Yıldız, B., & Demirci, M. F. (2016, March). Distinctive interest point selection for efficient near-duplicate
487
image retrieval. In 2016 IEEE Southwest Symposium on Image Analysis and Interpretation (SSIAI) (pp.
488
49-52). IEEE.
489
43. Jing, Y., & Baluja, S. (2008). Visualrank: Applying pagerank to large-scale image search. IEEE Transactions
490
on Pattern Analysis and Machine Intelligence, 30(11), 1877-1890.
491
44. Lew, M. S., Sebe, N., Djeraba, C., & Jain, R. (2006). Content-based multimedia information retrieval: State of
492
the art and challenges. ACM Transactions on Multimedia Computing, Communications, and Applications
493
(TOMM), 2(1), 1-19.
494
45. Wu, L., Wang, Y., & Shepherd, J. (2013, October). Efficient image and tag co-ranking: a bregman divergence
495
optimization method. In Proceedings of the 21st ACM international conference on Multimedia (pp. 593-596).
496
ACM.
497
46. Zhang, C., Chen, R., Zhu, L., Liu, A., Lin, Y., & Huang, F. (2018). Hierarchical information quadtree: efficient
498
spatial temporal image search for multimedia stream. Multimedia Tools and Applications, 1-23.
499
47. Wan, J., Wang, D., Hoi, S. C. H., Wu, P., Zhu, J., Zhang, Y., & Li, J. (2014, November). Deep learning for
500
content-based image retrieval: A comprehensive study. In Proceedings of the 22nd ACM international
501
conference on Multimedia (pp. 157-166). ACM.
502
48. Wu, L., Wang, Y., Li, X., & Gao, J. (2018). What-and-where to match: Deep spatially multiplicative integration
503
networks for person re-identification. Pattern Recognition, 76, 727-738.
504
49. Zhang, C., Lin, Y., Zhu, L., Zhang, Z., Tang, Y., & Huang, F. (2018). Efficient region of visual interests search
505
for geo-multimedia data. Multimedia Tools and Applications, 1-25.
50. Lowe, D. G. (1999, September). Object recognition from local scale-invariant features. In iccv (Vol. 99, No. 2,
507
pp. 1150-1157).
508
51. Lowe, D. G. (2004). Distinctive image features from scale-invariant keypoints. International journal of
509
computer vision, 60(2), 91-110.
510
52. Ke, Y., & Sukthankar, R. (2004). PCA-SIFT: A more distinctive representation for local image descriptors.
511
CVPR (2), 4, 506-513.
512
53. Mortensen, E. N., Deng, H., & Shapiro, L. (2005, June). A SIFT descriptor with global context. In 2005 IEEE
513
Computer Society Conference on Computer Vision and Pattern Recognition (CVPR’05) (Vol. 1, pp. 184-190).
514
IEEE.
515
54. Liu, Y., Liu, S., & Wang, Z. (2015). Multi-focus image fusion with dense SIFT. Information Fusion, 23, 139-155.
516
55. Su, M., Ma, Y., Zhang, X., Wang, Y., & Zhang, Y. (2017). MBR-SIFT: A mirror reflected invariant feature
517
descriptor using a binary representation for image matching. PloS one, 12(5), e0178090.
518
56. Nam, S. H., Kim, W. H., Mun, S. M., Hou, J. U., Choi, S., & Lee, H. K. (2018). A SIFT features based blind
519
watermarking for DIBR 3D images. Multimedia Tools and Applications, 77(7), 7811-7850.
520
57. Charfi, N., Trichili, H., Alimi, A. M., & Solaiman, B. (2017). Bimodal biometric system for hand shape and
521
palmprint recognition based on SIFT sparse representation. Multimedia Tools and Applications, 76(20),
522
20457-20482.
523
58. Sivic, J., & Zisserman, A. (2003, October). Video Google: A text retrieval approach to object matching in
524
videos. In null (p. 1470). IEEE.
525
59. Wu, L., Wang, Y., & Shao, L. (2018). Cycle-consistent deep generative hashing for cross-modal retrieval. IEEE
526
Transactions on Image Processing, 28(4), 1602-1612.
527
60. Dos Santos, J. M., De Moura, E. S., Da Silva, A. S., & da Silva Torres, R. (2017). Color and texture applied to a
528
signature-based bag of visual words method for image retrieval. Multimedia Tools and Applications, 76(15),
529
16855-16872.
530
61. Karakasis, E. G., Amanatiadis, A., Gasteratos, A., & Chatzichristofis, S. A. (2015). Image moment invariants
531
as local features for content based image retrieval using the bag-of-visual-words model. Pattern Recognition
532
Letters, 55, 22-27.
533
62. Wang, F., Wang, H., Li, H., & Zhang, S. (2013, January). Large scale image retrieval with practical spatial
534
weighting for bag-of-visual-words. In International Conference on Multimedia Modeling (pp. 513-523).
535
Springer, Berlin, Heidelberg.
536
63. Krizhevsky, A. , Sutskever, I. , & Hinton, G. . (2012). ImageNet Classification with Deep Convolutional
537
Neural Networks. NIPS (Vol.25). Curran Associates Inc.