Scholarship@Western
Scholarship@Western
Electronic Thesis and Dissertation Repository
10-16-2018 2:00 PM
Computational Studies on Nucleic Acid-Ion Interactions in
Computational Studies on Nucleic Acid-Ion Interactions in
Droplets and Bulk Solution
Droplets and Bulk Solution
Mahmoud Sharawy
The University of Western Ontario
Supervisor Consta, Styliani
The University of Western Ontario Graduate Program in Chemistry
A thesis submitted in partial fulfillment of the requirements for the degree in Doctor of Philosophy
© Mahmoud Sharawy 2018
Follow this and additional works at: https://ir.lib.uwo.ca/etd
Part of the Physical Chemistry Commons
Recommended Citation Recommended Citation
Sharawy, Mahmoud, "Computational Studies on Nucleic Acid-Ion Interactions in Droplets and Bulk Solution" (2018). Electronic Thesis and Dissertation Repository. 5764.
https://ir.lib.uwo.ca/etd/5764
This Dissertation/Thesis is brought to you for free and open access by Scholarship@Western. It has been accepted for inclusion in Electronic Thesis and Dissertation Repository by an authorized administrator of
Interactions of macromolecules with ions in solution have a long history of study
because of their ubiquitous nature. These interactions are essential for the stability
and function of macromolecules such as nucleic acids. Nucleic acids are involved in
many natural biochemical processes. For example, deoxyribonucleic acid (DNA)
provides more than storage of genetic information. The guanine-rich structures, at
the ends of the DNA, participate in regulating the gene expression in the living cell by forming guanine quadruplex (G-quadruplex) structures. These structures
pro-vide a possible drug target for the treatment of cancer. Nucleic acids are polyions
under physiological pH of 7.4. Thus, DNA always associates with cations in the
living cell. These cations are essential for maintaining DNA functions and
struc-tural stability. Experimental techniques showed that alkali metal cations are either
diffused in the ionic atmosphere around the DNA duplex or are coordinated to the
nucleotide bases. However, the experimental findings might not explain the
na-ture of the interactions between metal cations and DNA at the atomistic level.
To overcome some of the deficiencies with the experimental techniques, this the-sis uses molecular modelling and simulation techniques to investigate the nucleic
acid-ion interactions in droplets and bulk solution. The thesis first examines the
charging of a poly(ethylene glycol) molecule because of its use as a typical test
macromolecule in electrospray ionization mass spectrometry (ESI-MS), to obtain
an understanding of the charging mechanism of the macroions in droplets. The
analyses of the nucleic acid-solvent interactions and nucleic acid-ions interactions in
droplets provide insights into the ESI-MS experiments on DNA complexes. In the
bulk solution, free energy calculations examine the binding of individual sodium
and potassium ions to guanine quadruplexes; the thesis reports the values of the Gibbs free energy and the binding constants of each cation. Additionally, the free
energy calculations examine the effect of the guanine quadruplex flexibility on the
binding of cations.
Keywords
Molecular dynamics, Computer simulations, Molecular modelling, Droplet
insta-bility, Solvent evaporation, Counterions, Electrostatic interactions, Surface charge, Charged droplets, Rayleigh instability, Electrospray ionization, Aerosols,
Solvent-macroion interactions, Non-covalent complex, DNA duplex, Guanine quadruplex,
This thesis is organized in an integrated-article format where each of the main chapters is based on a published article.
The thesis starts with an introductory chapter and a chapter on the computational
methods:
• Chapter 1. Introduction and Theoretical Background
• Chapter 2. Molecular Modelling and Computational Methods
The thesis includes four main chapters that are based on published articles (a
reference to each article is indicated under the corresponding chapter):
• Chapter 3. Poly(ethylene glycol) as a simple model for a macromolecule ionization in droplets
– Mahmoud Sharawy; Styliani Consta. Effect of Counterions on the Charg-ing Mechanisms of a Macromolecule in Aqueous Nanodrops. J. Chem. Phys.
2014, 141 (10), 104321. [11 pages]
• Chapter 4. Dissociation of a DNA Duplex in Charged Droplets
– Mahmoud Sharawy; Styliani Consta. How Do Non-Covalent Complexes Dissociate in Droplets? A Case Study of the Desolvation of dsDNA from a
Charged Aqueous Nanodrop. Phys. Chem. Chem. Phys. 2015, 17 (38), 25550–25562. [13 pages]
• Chapter 5. Characterization of ‘Star’ Droplet Morphologies Induced by Charged Macromolecules
– Mahmoud Sharawy; Styliani Consta. Characterization of “Star” Droplet Morphologies Induced by Charged Macromolecules. J. Phys. Chem. A,
2016, 120 (44), 8871–8880. [10 pages]
• Chapter 6. Free Energy of Binding Na and K Ions to Guanine Quadruplexes
– Mahmoud Sharawy; Styliani Consta. Effect of the chemical environment of the DNA guanine quadruplex on the free energy of binding of Na and K ions. J.Chem. Phys. 2018, 149 (22), 225102.
The final chapter relates all of the different studies, provides broader conclusions
and put forth future outlook:
• Chapter 7. Concluding Remarks and Outlook
Appendices and a curriculum vitae are presented in the last part of this thesis:
• Appendix A. The Debye-Hückel Theory
• Appendix B. Derivation of the Virial for Real Gases and Liquids
This thesisincludesfour mainchapters that are basedonpublished articles in
co-operationwith mysupervisorProf. Consta,S.CopyrightPermissionsare included
inAppendix D.
Chapter 3 isbased on the following journal article:
Sharawy, M; Consta,S.Effect of Counterions onthe Charging Mechanisms of a Macromolecule in Aqueous Nanodrops. J. Chem. Phys. 2014, 141 (10), 104321. Sharawy,M.performedalltheworkpresentedinthischapter;Consta,S.performed
the revision. Reproduced with the permissionof AIP Publishing (Appendix D.1).
Chapter 4 isbased on the following journal article:
Sharawy,M;Consta,S.HowDoNon-CovalentComplexesDissociateinDroplets? A Case Study of the Desolvation of dsDNA from a Charged Aqueous Nanodrop.
Phys. Chem. Chem. Phys. 2015, 17 (38), 25550–25562. Sharawy, M. performed all the work presented in this chapter; Consta, S. performed the revision. Repro-duced with the permissionof PCCP Owner Societies (Appendix D.2).
Chapter 5 isbased on the following journal article:
Sharawy, M; Consta, S. Characterization of “Star” Droplet Morphologies In-duced by Charged Macromolecules. J. Phys. Chem. A, 2016, 120 (44), 8871– 8880. Sharawy, M. performed the major work presented in this chapter; Consta,
S. performed the analysis of the rotation-invariant order parameter. Reproduced
with the permission of ACSPublishing (Appendix D.3).
Chapter 6 isbased on amanuscript that has beensubmitted in July 2018:
Sharawy,M;Consta,S.EffectofthechemicalenvironmentoftheDNAguanine quadruplexonthefreeenergyofbindingofNaandKions.J.Chem.Phys.2018, 149 (22), 225102. Sharawy,M.performedalltheworkpresentedinthischapter; Consta,S.performedtherevision.
To my family and the people of Canada, ‘A Mari Usque Ad Mare’
Foremost, I gratefully acknowledge my supervisor Prof. Styliani Consta for her guidance throughout my graduate work. Her insightful suggestions and feedback
significantly refined my research. I am thankful to Dr. Consta for offering me the
opportunity to join her group.
I wish to express my gratitude to Prof. David W. Shoesmith, Prof. Martin J.
Stillman, Prof. Mahi R. Singh, and Prof. William Smith for being my examiners
and for their valuable suggestions which have considerably contributed to the
improvement of the thesis.
I would also like to thank all members of Dr. Consta’s group – Sepideh Soltani,
Myong In Oh, Chloe Graham, and Victor Kwan – for their valuable discussions. My sincere appreciation goes to Dr. Anatoly Malevanets for his feedback on
presentations.
I want to thank Prof. Sree Ram Valluri for all the support he offered me over the
past ten years. His support and encouragement have helped me tremendously.
Beside my supervisor, I want to thank all of my teachers at the University of
Western Ontario. I thank Prof. Robert Hudson for offering me the opportunity
to join his group and for his supervision throughout my final year as an
undergraduate student.
I am also grateful to the financial support that I received from OSAP, the University of Western Ontario, and The Joseph Soltys Graduate Award.
Abstract i
Thesis Overview iii
Co-Authorship Statement v
Acknowledgment vii
Contents viii
List of Tables xii
List of Figures xiii
Chapter 1 Introduction and Theoretical Background 1
1.1 Droplet with an electric charge . . . 1
1.1.1 Historical overview of the electrospray ionization development . 1 1.1.2 Forces in a droplet . . . 3
1.1.3 Charged droplet and the Rayleigh limit . . . 5
1.2 Electrospray ionization . . . 8
1.2.1 Electrospray ionization and its applications . . . 8
1.2.2 Solvent evaporation from charged droplets . . . 9
1.2.3 Mechanisms of the formation of gas phase ions . . . 10
1.3 Electrostatics of DNA in bulk solutions . . . 14
1.3.1 Strong Electrolyte Solutions . . . 14
1.3.2 Polyelectrolytes . . . 19
1.3.3 Non-covalent nucleic acid-ion interactions. . . 21
References . . . 31
Chapter 2 Molecular Modelling and Computational Methods 32
2.1 Models for the empirical force field . . . 33
2.1.1 A simple force field . . . 33
2.1.2 Features of a force field . . . 36
2.1.3 Models for liquid water . . . 37
2.2 Molecular dynamics simulation methods. . . 40
2.2.1 Newton’s equation of motion . . . 40
2.2.2 Finite difference methods . . . 41
2.3 Calculations of properties . . . 44
2.3.1 Ensemble averages . . . 45
2.3.2 Calculations of simple properties. . . 46
2.3.3 Calculations of the free energy. . . 49
References . . . 59
Chapter 3 Poly(ethylene glycol) as a simple model for a macromolecule ion-ization in droplets 60 3.1 Introduction . . . 60
3.2 Model and computational methods . . . 63
3.3 Results and Discussion . . . 65
3.3.1 Maximum charge state of PEG64 . . . 65
3.3.2 Effect of counterions at a temperature of 350 K . . . 68
3.3.3 Effect of counterions at a temperature of 300 K . . . 75
3.4 Conclusion . . . 79
References . . . 82
Chapter 4 Dissociation of a DNA Duplex in Charged Droplets 83 4.1 Introduction . . . 83
4.2 Model and computational methods . . . 87
4.3 Desolvation of dsDNA from a charged aqueous nanodrop . . . 89
4.4 Electrostatics of dsDNA . . . 94
4.5 Solvent evaporation . . . 96
4.6 Effect of ions on the desolvation of dsDNA from aqueous nanodrops. . 97
4.6.1 DNA duplex in droplet: initial net charge of -20 e . . . 97
4.6.2 DNA duplex in droplet: initial net charge of -15 e . . . 100
4.6.3 DNA duplex in droplet: initial net charge of -10 e . . . 100
4.7 How does a charged droplet accommodate the instability? . . . 101
4.7.2 Increase of the surface-area-to-volume ratio . . . 103
4.7.3 Cation interactions and the unwinding of the DNA duplex . . . 104
4.8 Characterization of the DNA structure in the gas phase . . . 106
4.8.1 Minimum charge to maintain a duplex . . . 106
4.8.2 Conformations of DNA in the gas phase . . . 108
4.9 Conclusion . . . 110
References . . . 115
Chapter 5 Characterization of ‘Star’ Droplet Morphologies Induced by Charged Macromolecules 116 5.1 Introduction . . . 117
5.2 Model and computational methods . . . 120
5.2.1 Models . . . 120
5.2.2 Computational Methods . . . 121
5.3 Results and discussion . . . 123
5.3.1 Structure of charged droplets . . . 123
5.3.2 Dynamics. . . 135
5.3.3 Liquid interfaces in the presence of magnetic or electric fields . 138 5.4 Conclusion . . . 139
References . . . 142
Chapter 6 Free Energy of Binding Na and K Ions to Guanine Quadruplexes 143 6.1 Introduction . . . 144
6.2 Computational methods . . . 148
6.2.1 Setup of the molecular systems . . . 148
6.2.2 The free energy perturbation method . . . 150
6.3 Results and discussion . . . 156
6.3.1 Reducing the statistical errors . . . 156
6.3.2 Convergence of the free energy . . . 157
6.3.3 Estimating the hydration free energies. . . 160
6.3.4 Estimating the binding free energy contributions . . . 162
6.4 Conclusion . . . 170
References . . . 175
7.2 Dissociation of dsDNA in a Charged Droplet . . . 177
7.3 Characterization of ‘Star’ Droplet Morphologies . . . 179
7.4 Free Energy of Binding Ions to Guanine Quadruplexes . . . 180
References . . . 181
Appendices
181
Appendix A The Debye-Hückel Theory 182 Appendix B Derivation of the Virial for Real Gases and Liquids 187 Appendix C Molecular Dynamics Simulation Program for Argon-Type Atoms 190 C.1 Periodic boundary conditions . . . 190C.2 Equilibration . . . 191
C.3 Simulation codes . . . 192
Appendix D Copyright Permissions 211 D.1 Permission from the American Institute of Physics . . . 211
D.2 Permission from the Royal Society of Chemistry . . . 212
D.3 Permission from the American Chemical Society . . . 214
4.1 Initial composition of dsDNA in aqueous droplets . . . 88
4.2 State of the 11-mer dsDNA-residue and its charge in the gas phase . . 108
5.1 Parameters of solvents . . . 118
6.1 Dehydration free energy values forNa+ and K+ from simulations and
experiments . . . 161
6.2 Free energy contributions for the binding of sodium and potassium ions
to G-quadruplexes . . . 163
1.1 Pressure model across interface . . . 4
1.2 Schematic of an electrospray process . . . 9
1.3 Models for the formation of gas phase macroions . . . 11
1.4 Primitive model of electrolytes in solutions . . . 15
1.5 Examples of the chemical structures of polyelectrolytes and typical counterions . . . 20
1.6 Representations of major binding modes for cation-DNA . . . 22
1.7 Physical and rod-like models of DNA . . . 25
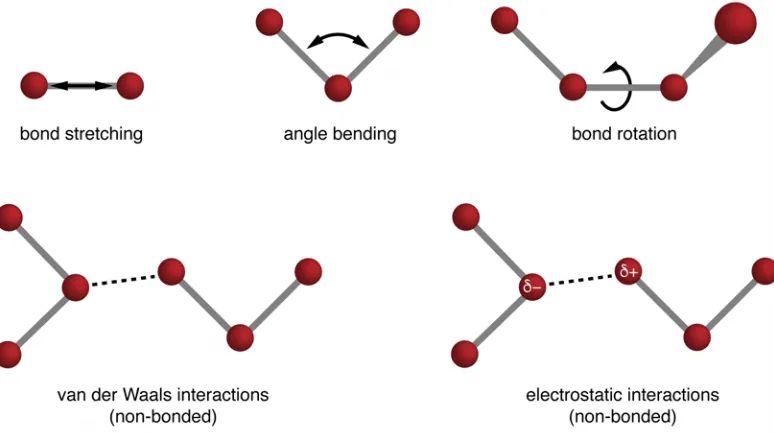
2.1 Schematic representation of force field contributions . . . 34
2.2 Schematic representations of some simple water models . . . 39
2.3 The leap-frog algorithm . . . 43
2.4 Calculations of simple properties. . . 48
2.5 Schematic representation of a thermodynamic cycle. . . 53
3.1 Maximum number ofNa+ attached to PEG found in experiments . . . 66
3.2 Snapshots of the charging of PEG64 in a droplet atT ≈273 K . . . . 67
3.3 Net charge of a droplet versus size atT =350 K . . . 69
3.4 Average net droplet charge versus number of water molecules at T = 350 K . . . 70
3.5 Formation of NaCl aggregates and complexes . . . 72
3.6 The charging states of PEG64 atT =350 K . . . 73
3.7 The release of a sodiated PEG64 via the Taylor cone . . . 74
3.8 Net charge of a droplet versus size atT =300 K . . . 76
3.9 Average net droplet charge versus number of water molecules at T = 300 K . . . 77
3.10 The charging states of PEG64 at T =300 K . . . 77
3.11 Density maps for the atomic sites in droplets . . . 78
4.1 Representation of a modelled dsDNA in water droplet . . . 87
4.2 Desolvation of a dsDNA-droplet . . . 91
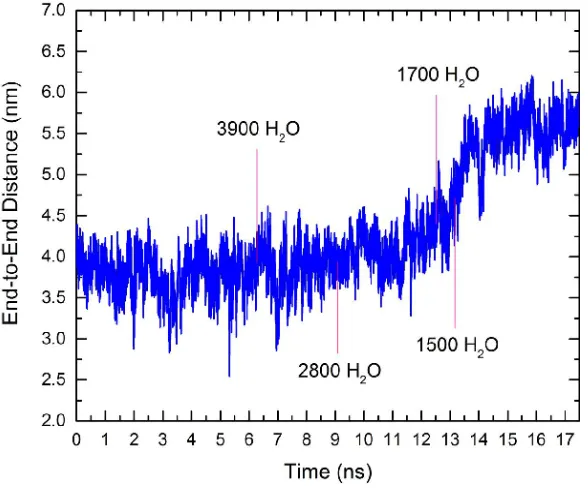
4.3 End-to-end distance of dsDNA vs. time . . . 92
4.4 Electric field lines of a charged rod model of dsDNA . . . 96
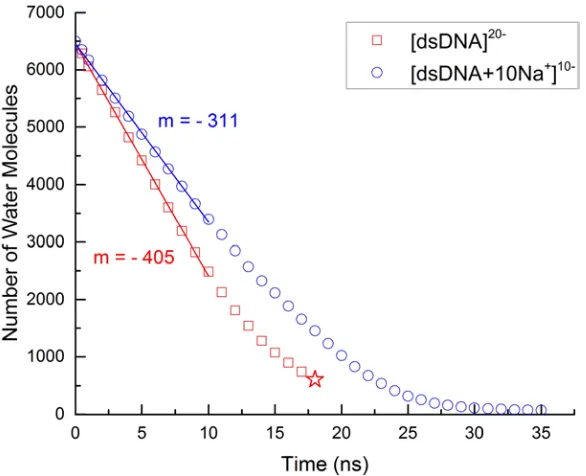
4.5 Evaporation rate of water during the desolvation of dsDNA . . . 98
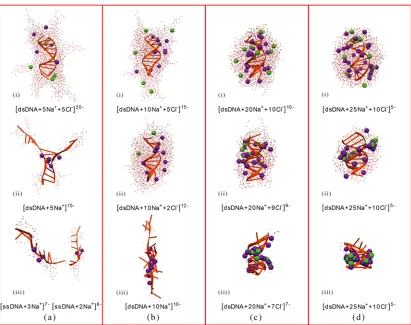
4.6 Desolvation of dsDNA from droplets . . . 99
4.7 The net charge of a dsDNA-water nanodrop in its journey to the gas phase . . . 102
4.8 Average surface area and surface-to-volume ratio (SA:V) of dsDNA-aqueous nanodrops. . . 104
4.9 Average number of H-bonds per water molecule for dsDNA-droplets of various charge states . . . 105
4.10 Distance of a Na+ from the minor groove of dsDNA during droplet desolvation . . . 107
4.11 Schematic representation of the [dsDNA + 10 Na+]10 – conformation and charge distribution in the gas phase. . . 109
5.1 Typical snapshots from molecular simulations of droplets containing a macroion . . . 119
5.2 Radial distribution functions of acetonitrile for selected pairs of atoms 120 5.3 Typical morphologies of evaporating droplet with an embedded DNA duplex . . . 124
5.4 Evolution of geometry of a non-conductive charged droplet. . . 126
5.5 Number of spikes versus√X . . . 127
5.6 Snapshots of droplets containing a central ion with charge Q= 24e . . 129
5.7 Ql versus l for various droplet morphologies. . . 130
5.8 Distinction of the droplet morphologies using a combination of two order parameters . . . 131
5.9 Orientational probability distribution F(θ, r) of the solvent dipole mo-ments. . . 133
5.10 Radial distribution of the180◦dipole moment orientation of H2O about the [dsDNA]20 – . . . 134
5.11 Cluster formations at the tips of the spikes . . . 134
5.12 Diffusion of an H2O molecule in a spiky droplet. . . 135
5.13 Dipole moment auto-correlation function (ACF) of H2O . . . 136
6.1 Structural topologies of two DNA G-quadruplexes . . . 146
6.2 RMSD of 2M4P and 1KF1 G-quadruplexes . . . 149
6.3 Two thermodynamic cycles describe the reversible association of two
monovalent cations to a G-quadruplex. . . 152
6.4 Statistical error associated with the Bennet’s acceptance ratio
estima-tion of the free energy difference . . . 157
6.5 The probability distributions of the internal energy difference . . . 158
6.6 Overlap between P0(∆U) and P1(∆U) for a Na+ binding to a
G-quadruplex . . . 158
6.7 Overlap between P0(∆U) and P1(∆U) for a Na+ dehydration . . . 159
6.8 Sampling effect on hysteresis . . . 159
6.9 The free energy difference for the forward and reverse transformations
of coordinating Na+ and K+ to the G-quadruplex 1KF1 . . . 160
6.10 Radial distribution functions for cations-O6 atomic sites pair and
cation-cation pair . . . 164
6.11 The free energy contributions for the binding of Na+ and K+ to two
G-quadruplexes, 2M4P and 1KF1 . . . 167
ACF Auto-Correlation Function 135
CC Counterion Condensation 20
COM Centre of Mass 132
CRM Charged Residue Model 10
DH Debye-Hückel 15
dsDNA double stranded DNA 83
ESI Electrospray Ionization 2
ESI-MS Electrospray Ionization-Mass Spectrometry 8
FEP Free Energy Perturbation 52
GQX Guanine Quadruplex 123
IEM Ion Evaporation Model 10
LJ Lennard-Jones 64
NLPB Non-Linear Poisson-Boltzmann 20
PEG Poly(ethylene glycol) 61
PEG64 64-mer poly(ethylene glycol) 63
RDF Radial Distribution Function 121
SA:V surface-area-to-volume ratio 103
SPC Simple Point Charge 38
TIP3P Transferable Intermolecular Potential 3 Point 38
Introduction and Theoretical Background
This chapter presents a review of the literature and provides the theoretical
back-ground to topics reported in this thesis. The chapter surveys three main topics:
droplets that carry an electric charge, the electrospray ionization method, and the
electrostatic properties of DNA in bulk solutions.
1.1
Droplet with an electric charge
1.1.1
Historical overview of the electrospray ionization development
Charged droplets are found in atmospheric aerosols and industrial applications;
such as in electrostatic inkjet printing [1], electrostatic painting [2], electrostatic
crop spraying [3], and deposition [4–7]. Controlling the morphology of a droplet,
generated by electrospray, has been applied for the fabrication of drug-delivery
systems with specific sizes and morphologies [8, 9]. Additionally, charged droplets
are found in analytical methods. The most valuable analytical application for the
charged droplet is in the electrospray ionization.
Long before the development of electrospray ionization (ESI) methods, the first
genuine experiments on charged water drops were performed in the mid 17
hun-dreds by Abbé Jean-Antoine Nollet [10]. Nollet dedicated his career to research on
the causes of electrical phenomena which led him to the investigation of the
electro-spray; he has been regarded as the ‘father’ of experimental electrospray ionization
[11]. One of Nollet’s experiments demonstrated the ‘spraying’ of solution from an electrified metal container; a phenomenon that is known today as ‘electrospraying’.
About 150 years before Nollet’s work, the English physician William Gilbert [12]
reported his observation on the cone formation by amber when placed near the
surface of a water drop.1 However, Nollet was the first to reproduce, develop, and record true experiments using electrospray. Nollet postulated that an electrified
body spray electrified matter into the air or other neighbouring bodies.
In 1882, Lord Rayleigh published a paper on conducting liquid drops charged
with electricity. Lord Rayleigh estimated the maximum charge a liquid drop can
carry before it breaks up into a fine jet of charged progeny droplets [13]. The
condition for the instability is now known as the ‘Rayleigh limit’. In the 1910s,
John Zeleny described the behaviour [14] and surface instability [15] of electrified
fluid emitting from a needle. In the 1920s, Wilson and Taylor investigated the formation and bursting of soap bubbles in a uniform electric field [16].
It was not until the 1960s that Malcolm Dole demonstrated the potential use of
electrospray ionization in analytical chemistry. Dole coupled a mass spectrometer
to an electrospray ionization instrument to produce gas phase macroions and
mea-sure their mass-to-charge ratio [17]. In 1976, Iribarne and Thomson published their work on the evaporation of small ions from charged droplets [18] and evaluated the
energy barrier for ion evaporation. John Bennett Fenn further developed the
ESI-MS for biological macromolecule in the 1980s [19, 20]; for his work, Fenn received
the 2002 Nobel Prize in Chemistry. Fenn’s work was similar to that of Dole’s,
but the significant contribution was the use of nitrogen gas flow to remove solvent
vapour. The modification by Fenn resulted in ‘clean’ and rather high-resolution
mass spectra.
In addition to the contributions to experiments, Fenn and co-workers were
among the first scientists who tried to understand the relation between the charge
of the macroion and the structure of a droplet. Fenn and co-workers devoted
con-siderable efforts to devise possible mechanisms that could explain the MS
observa-tions. Fenn [21] and de la Mora [22] suggested that linear macroions, in particular
poly(ethylene glycol) (PEG), extrudes from a droplet when charged. Molecular
simulations by Consta et al. supported the extrusion of the PEG molecule from a droplet [23–27]. Besides, molecular simulations showed that the mechanism of
PEG extrusion is different from that proposed by Fenn. Fenn, de la Mora, and their
co-workers also attempted to explore how the droplet deformations could affect the
charge state of a macroion [22,28]. They proposed that Coulomb repulsion causes
the extension of the macroion and as a result; the droplet becomes elongated with
1Gilbert used the term ‘electricus’ to refer to the electrical force produced by amber; it is called
conical (sharp) ends that accumulate the charge density. Simulations by Consta
have shown that the interactions of highly charged macroions with solvent are more
complicated and they lead to multi-point solvent protrusions when the charge of the droplet is above a threshold value.
1.1.2
Forces in a droplet
The forces acting on the surface of a droplet influence its behaviour. The surface of
a droplet is the thin interface between the liquid of the droplet and the surrounding gas or vapour. More generally, the surface is the interface between two media. In
a continuum model, such as the Rayleigh model, the interface of the droplet has
essentially zero thickness; however, in the molecular picture, the interface has a
defined thickness [29–31].
The study of the interfaces between the liquid in a droplet and the surrounding
air or vacuum is part of a larger field of studies known as ‘capillarity’ [32, 33].
The distinct phenomena associated with any surface is its surface tension. Surface
tension, γ, is defined as the force acting per unit length across an imaginary line on the surface: γ ≡F/L. The units of surface tension as a force per unit length is commonly reported in cgs or SI units: γ= 1 dyn·cm−1= 0.001 N·m−1. With this definition, surface tension’s net effect is an inward force that holds the liquid
in the droplet as if a membrane covers the droplet [34].
To distort a liquid by increasing it surface, work must be done. The infinitesimal
amount of work δW, also known as surface work [33] or surface free energy, is proportional to the infinitesimal change in surface area δA:
δW =γδA. (1.1)
In terms of energy, surface tensionγ (also known as surface energy density) can be defined as the workδW required to increase the surface area AbyδA: γ=δW/δA
(in SI units of J·m−1). For a droplet to reach a state of mechanical equilibrium, it tends towards minimum surface free energy. At equilibrium, surface tension
opposes any distortion of the surface. Consequently, a droplet of liquid assumes
the geometrical shape of the smallest ratio of surface-area-to-volume: the sphere.
Another force that influences the geometry of a droplet is the pressure difference
across the surface. Consider the simple model in Figure 1.1. If we take a rubber
open to atmospheric air, the membrane will remain planar because the pressure is
equal on both sides of the membrane. If we blow air through the open end of the
tube, the membrane will curve outward because the pressure inside is higher than outside pressure. Finally, if we withdraw air from the open end, the membrane will
curve inward because the pressure inside the tube is lower than outside pressure.
Laplace’s formula defines a relation between the pressure difference ∆P across the membrane and the curvature of the surface:
∆P =γ
1
R1
+ 1
R2
(1.2)
where R1 and R2 are the principle radii of curvature at an arbitrary point on
the surface. R1 and R2 are positive if drawn into medium inside the interface.
(Laplace’s formula is also known as Young-Laplace equation.) In a spherical droplet the principle radii of curvature are equal: R1 =R2. At equilibrium,
Laplace’s formula reduces to
∆P =γ2
R. (1.3)
Figure 1.1: Model of pressure across interface. The model shows the effect of pressure difference across a stretched membrane [35]. The membrane (red line) represents an interface between the inner pressurePinand the outer pressurePout.
Laplace’s formula explains three effects concerning the geometry of a droplet.
First, from the geometry of the droplet we can determine the pressure difference across the surface, ∆P =Pin−Pout. Second, in the absence of an external electric
or magnetic field, the pressure is constant everywhere in the droplet [35].
droplet. In contrast, if the pressure and the curvature are variable, the molecules
of the liquid would flow from regions of high to low pressure. Third, in principle,
if the pressure difference is known, we can determine the geometry of a droplet surface at equilibrium where the shape is described by a functionf=f(x, y) in the cartesian coordinate system [35]. However, the analytical function requires solving
second-order partial differential equations with respect to the coordinates [35] to
obtain the principal radii of curvature in Equation (1.2).
1.1.3
Charged droplet and the Rayleigh limit
Theoretical investigations into the stability of a charged liquid droplet began after
Lord Rayleigh published his pioneering work on electrified liquid droplets in 1882
[13]. Rayleigh’s work on charged droplets was extended by Zeleny [15] and Taylor [36].
The Rayleigh model is based on three assumptions. First, the model considers
a conducting droplet where the net charge resides on the surface. Consequently,
the electrostatic potential on the droplet surface is constant. Second, the model is
applicable only to spherical droplets. However, the spherical droplet may undergo
small shape perturbations. Third, the droplet in the Rayleigh model maintains a
constant volume but may change its surface area.
In Rayleigh’s model, the free energyEdropof a conducting droplet that carries a
charge can be expressed as the sum of the surface free energy and the electrostatic
energy:
Edrop=γA+
1
2Qφ (1.4)
where γ denotes the surface tension density; A, the surface area; Q, the droplet charge; φ, the electrostatic potential on the surface of the droplet.2 Rayleigh gave an expression for the angular frequency ω of an oscillating conducting-mass of a charged liquid drop:
ω2=l(l−1)
ρR3
(l+ 2)γ−
Q2
4πR3
(1.5)
wherel denotes the oscillation mode;ρ, the density of the liquid in the droplet; R, the radius of the spherical droplet;γ, the surface tension; Q, the net charge of the droplet. The physical units in Equation (1.5) are in the cgs system. (To convert
2The factor 1/2 in the electrostatic energy term, 1
2Qφ, corrects for the double counting of
to SI units, multiply the charge Q by the conversion factor 1/√4πε0.) In the SI
unit system, Equation (1.5) translates into
ω2=l(l−1)
ρR3
(l+ 2)γ−
Q2
16π2ε 0R3
(1.6)
where ε0 denotes the permittivity of vacuum.
The l in Equation (1.6) represents the polynomial degree of the spherical har-monic functionsYlm(θ, φ) =Plm(cosθ)eimφ where Plm are the Legendre polynomi-als. The spherical harmonic functions appear in solutions of second-order
par-tial differenpar-tial equations corresponding to the wave function of an oscillating
droplet. The l values are any integer from zero onward while the m values are 0,±1,±2, ...,±l. Only l, not m, remains in the final expression in Equation (1.6), i.e. the frequency of oscillation depends only on l. However, the solution for the wave function is dependent on both l and m. Thus, for every l there are 2l+ 1 different oscillations having the same frequency w: the 2l+ 1 oscillations are de-generate.
The expression in Equation (1.6) gives a frequency for values ofl≥2. Forl= 0 and l= 1, the oscillation frequency vanishes. The value l= 0 corresponds to sym-metrical radial oscillation, but because the liquid in the droplet is incompressible,
this oscillation is infeasible. The valuel= 1 corresponds to the translation motion of the whole droplet. Thus, the minimum oscillation frequency corresponds to the
l= 2 vibration mode [37]. Substituting l= 2 into Equation (1.6) gives
ω2= 2
ρR3
4γ−
Q2
16π2ε 0R3
. (1.7)
For the expression in the bracket to be positive
γ > Q
2
64π2ε 0R3
(1.8)
or
Q2<64π2ε0R3γ . (1.9)
Thus, the Rayleigh limit that determines the onset of stability of a charged droplet
is given by
where QR indicates the critical charge at the Rayleigh limit. Thus, the Rayleigh
model describes the conditions of the instability, but not its manifestation.
Two detailed derivations of Equation (1.6) were produced [38, 39]. Consta and
Malevanets [39] have derived the expression for the oscillation from the
perturba-tion of a spherical droplet. In their derivaperturba-tion, they have expressed the total energy
of a conductive charged droplet in terms of the perturbation from the spherical
geometry, where the total energy was given by Equation (1.4). The expansion of
the perturbations in terms of spherical harmonics was then used to solve for the electrostatic potential. Lengthy calculations followed these steps to derive the final
expression of Equation (1.6) and subsequently the expression of Equation (1.10).
For a dielectric droplet, however, the electrostatic potential must be modified to
derive a suitable model [40].
Lord Rayleigh proposed that if the charge of a conducting droplet is near the
critical value, the droplet ruptures into fine jets [13]; however, he did not describe
the behaviour of the droplet. In other words, Rayleigh’s model defines the ‘onset’
of the instability in a charged droplet; it does not describe the manifestation of
this instability [23–27, 39–51].
The critical charge QR described by the Rayleigh expression (Equation (1.10)) for a conducting droplet can be regarded as the balance between the force
asso-ciated with surface tension and the force on the droplet produced by the electric
charge [52]. The force associated with surface tension tends to restore the
spheri-cal shape of equilibrium while the electric force operates in the opposite direction
towards instability. Solvent evaporation leads to a reduction in droplet size and
an increase in the electrostatic repulsions between the charges of similar polarity.
This increase in the electrostatic repulsion leads to droplet fission [23–27, 41, 42,
46].
Dielectric droplets, such as the droplets that comprise a single DNA molecule,
cannot undergo charge separation [26, 40, 44, 46, 48, 49, 51]. Thus, the
manifes-tation of the instability of a dielectric droplet ought to be different from that of a
conducting droplet. A conducting droplet ruptures and ejects some of its mobile charge carriers when it becomes unstable. In contrast, a dielectric droplet has no
mobile charges; hence it does not rupture. Instead, the surface area of the
un-stable dielectric droplet changes to give rise to a remarkable set of morphologies
1.2
Electrospray ionization
1.2.1
Electrospray ionization and its applications
Electrospray ionization (ESI) methods transfer molecules from bulk solution to
ions in the gas phase. In a typical ESI process, the molecules (analytes) are
transferred by spraying the solution electrostatically into a fine mist of droplets.
The solvent from the droplet evaporates and releases the gas phase ions. When
coupled to a mass spectrometer, an analyzer sorts the ionized analytes by their
masses while the detector measures the frequency of each mass-to-charge value.
The mass spectrometer provides a spectrum of the abundances of all the detected
species. This combination of the electrospray ionization and mass spectrometry methods is abbreviated ESI-MS.
Although ESI-MS can handle a variety of analytes, it has been employed
suc-cessfully in analyzing some molecules but failed in others. It has been an ideal tool
for examining proteins [53], carbohydrates [53], lipids [54], polymers [55], drugs
[56], and oligonucleotides [57]. The analyte in the sprayed solution can be a
com-pound that is either an ion (cation or anion) or a neutral species. A neutral analyte can gain a charge by association with other ions present in the solution. For
exam-ple, polyethylene glycols gain a positive charge by non-covalent association with
the metal ions M+ and M2+ in solution.
The overall process to produce gas phase ions has three major stages. Figure 1.2
shows a schematic representation of a typical electrospray ionization process. The first stage involves the production of charged droplets. This process occurs at
the tip of the ESI capillary. In a positive ion mode experiment, the droplets
generated carry positive charges while in negative ion mode the droplets carry
negative charges. In the second stage, the charged droplets shrink due to the
evaporation of solvent. Near a critical size, the droplets disintegrate into a progeny
of droplets that travel to the next stage. The third stage involves ‘clean-up’ of the
solvent vapour. The clean-up can be achieved by running a counter flow stream
of N2 gas. These three stages are carried out in an atmospheric pressure region
of the ESI instrument [58]. The third stage is essential for mass spectrometry to produce simple spectra [19]. After the clean-up, the produced gas phase ions are
forced by the counter electric potential to flow out of the ESI instrument leading
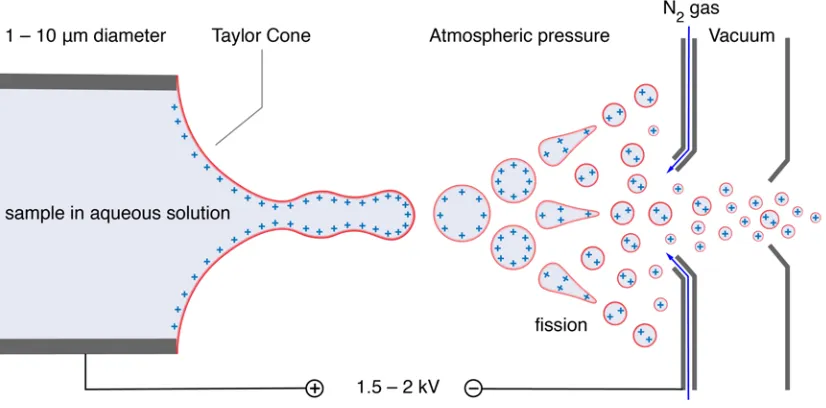
Figure 1.2: Schematic of an electrospray process. The polarity of the applied electric field determines whether the ionization mode is positive or negative. The liquid that appears from the capillary deforms and fragments [17, 19, 20]. The deformation of the liquid at the tip of the capillary forms a Taylor cone [36]. The droplets that are created evaporate and fragment when their charge reaches a critical value. A stream of N2 gas removes solvent vapour. Produced gas phase
ions flow out to other coupled instruments such as a mass spectrometer.
instrument.
The coupling of an ESI instrument to a pre-separation technique (e.g. liquid
chromatography) or to a post-gas-phase technique (e.g. mass spectrometry) has extended the application of ESI into the field of biochemistry. ESI is commonly
used in investigations of protein folding [59], protein identification [60], and in
every step in the drug discovery process [61]. Although there have been great
advances in the application of ESI, the problem of non-covalent interactions is less
understood [62].
1.2.2
Solvent evaporation from charged droplets
Near the tip of the ESI capillary, a jet of liquid is formed that breaks into charged
droplets. The thermal energy of air in this region causes evaporation of the solvent in the droplet. The charge in these droplets remains constant while the solvent
evaporates and the droplet shrinks. While the size of the droplet decreases, the
instability. The size of the droplet, determined by its radius, at which the onset of
instability occurs is described by the Rayleigh limit given in Equation (1.10). This
instability near the Rayleigh limit causes coulombic fission and ejection of smaller progeny droplets [63–65].
Two major experimental methods have been used to measure the size and charge of sprayed droplets during the evaporation of the solvent. One method allows the
determination of the droplet size and charge. This method uses an electrodynamic
balance (EDB) technique to suspend a charged droplet in space while being
ob-served and analyzed by laser light scattering [63]. However, this method is not
suitable for volatile solvents. Thus, the EDP technique is not useful for the study
of solvents that are commonly used in ESI such as water and methanol. Another
limitation of the EDB is that the charge of a droplet is obtained theoretically from
the balancing electric potential [63]. Another method is based on the analysis of
electrospray generated droplets and relies on phase Doppler anemometry (PDA) to measure the size of the droplet during evaporation [64]. This method is suitable for
a volatile solvent. The PDA system determines the velocity and size of the droplet
from the frequency of light scattered by the laser beam. However, the charge of
the droplet must be inferred. Instead of direct measurement of individual droplet
charge the average charge is computed by dividing the electric current of spray
core by the flow rate of the spray. Here, the assumption is that the spray has a
uniform size distribution.
Both methods, EDB and PDA, were able to verify that fission of charged
droplets occurs when the charge is less than the charge of the determined by the
Rayleigh limit. However, these experimental methods cannot measure the charge
of the droplet directly or without an assumption.
1.2.3
Mechanisms of the formation of gas phase ions
Two models have been proposed from experimental investigation to describe the
mechanism of the formation of gas phase ions from charged droplets: the ‘Ion
Evaporation Model’ (IEM) and the ‘Charged Residue Model (CRM)’ (Figure 1.3).
Both models have shown some success in describing the mechanism of ion forma-tion, but they are only applicable to specific classes of analytes. In addition to the
IEM and CRM, other mechanisms have been proposed [25, 66, 67].
Iribarne and Thomson [18] proposed the IEM mechanism based on their
Figure 1.3: Schematic representations of major mechanisms for the formation of gas phase macroions from charged droplets. Two major mechanisms explain the formation of gas phase macroions from charged droplets: the ion evaporation model (IEM) for small ions [18] and the charged residue model (CRM) for globular macro-molecules [17, 22]. The small spherical charges represent small ions whereas the folded strands represent globular macromolecules.
inorganic salts such as NaCl. The charged droplets were produced by a pneumatic atomization method where some droplets gain a charge from the statistical
im-balance of the positive and negative electrolytes distribution. Accordingly, some
droplets are positively charged, some are negatively charged, and the remaining
droplets are electrically neutral. The IEM suggests that droplets emit some small
ions into the gas phase as the radii of the droplet decrease to a given value. The
au-thors [18] also provided a relation for the rate of ion evaporation from the charged
droplet:
kevap=
kBT h e
−∆G‡/kBT (1.11)
wherehis Planck’s constant,kBis Boltzmann’s constant, and ∆G‡is the activation
free energy. The authors chose a transition state, the top of the energy barrier,
that corresponds to a state under opposing electrostatic forces: the attraction
force between the evaporating ion and its equivalent counterion (an ion of opposite
polarity); the repulsion force between the evaporating ion and its equivalent co-ion (an ion of similar polarity) on the surface of the droplet. In addition to these
electrostatic forces, the activation energy includes terms for the free energy of
energy in water, such as alkali metal, evaporate from the droplet with some water
molecules. For example, because the ∆Gdesolv of Li+ is larger than that of Cs+,
Li+ ions evaporate from the droplet as Li+·7H2O whereas Cs+ ions evaporate as
Cs+·5H2O [68].
Although the ion evaporation mechanism was qualitatively proved valid, it may
not be possible for an experiment to observe the evaporation mechanism directly.
Also, subsequent investigations to test the validity of the IEM have been limited
to the study of small ion evaporation [69]. Relatively large organic molecules can be surface active (surfactant) which is expected to affect the rate of evaporation
given by Equation (1.11). Surface active ions have hydrophobic groups causing the
large ions to diffuse to the surface of the droplet where the hydrophobic groups
are less solvated. Consequently, the surface active ions will have lower desolvation
energy ∆Gdesolv than small ions. Thus, according to the IEM relatively large
organic ions with high surface activity will have a higher ion evaporation rate.
The complications made by the surface activity of the solute limits the scope of
the IEM in describing the mechanism of ion formation in the gas phase.
Computational studies by Consta and co-workers offered detailed accounts of
the free energy profile and the evaporation mechanism of poly(ethylene glycol) by
the IEM [23–25, 27]. In one study, Consta computed the free energy associated
with the disintegration of charged droplets [41]. In other computational studies,
Consta and co-workers investigated the mechanism by which charged droplets that
comprise small ions disintegrate [42, 43].
Dole et al. proposed the CRM mechanism (Figure 1.3) based on their
exami-nations of the formation of polystyrene macroions by electrospray [17]. According
to this model, a droplet comprising a globular macromolecule remains spherical
during the solvent evaporation. As the droplet undergoes a Coulombic
explo-sion, however, the droplet may deviate briefly from the spherical shape. After a Coulomb explosion, the macromolecule remains in the interior of the now smaller
spherical droplet. As the droplet approaches complete evaporation of the solvent,
the macromolecule holds the charge of the droplet and becomes a charged residue.
This mechanism is Dole’s charged residue model [17].
An experimental investigation by de la Mora on Dole’s CRM suggested that the maximum charge (zmax) of a globular protein can be determined from the charge
of the droplet at an instant before the complete evaporation of the solvent [22].
evaporation process, this investigation predicted that the charge of the ionized
pro-tein is between 60% and 110% of the Rayleigh limiting charge,QR, of the droplet.
Subsequent experimental data agreed with de la Mora’s findings concerning the charge of an intact globular protein[58, 70].
Gas phase macroions, such as proteins and dendrimers, are most likely produced
by the mechanism described by the CRM. In positive-ion mode ESI, a protein is
charged by H+ where the peaks on the mass spectrum correspond to the molecular mass-to-charge ratio (m/z). If the CRM holds, one or more macromolecules could be in one droplet. Experimental investigations provided evidence that charged
proteins are produced by CRM [71]. Investigators [71] observed high-intensity
peaks of charged monomers and much smaller peaks of dimers and trimers.
Sub-sequent study [22] has provided a theoretical relation between the number of the
elementary charge z and the molecular mass m of the protein:
z= 4 πγε0
e2N Aρ
!1/2
m1/2 (1.12)
where γ is the surface tension, e is the elementary charge, NA is the Avogadro constant, and ρ is the density of the non-denatured protein (approximated to the density of water). There are two approximations in this relationship: the protein
is assumed to be spherical and that the charge on the droplet will be transferred to
the protein. These approximations predict that the charge of the protein in the gas
phase is close to the charge determined by the Rayleigh limit (Equation (1.10)).
The approximations associated with the CRM, specifically the spherical
as-sumption, limits its application to globular proteins or dendrimers. Thus, the
charging mechanism of a non-globular macromolecule, such as a DNA duplex or
protein that deviates from the spherical shape, cannot be accurately deduced from
the relation given in Equation (1.12).
In summary, the IEM and CRM mechanisms of producing gas phase macroions
from charged droplets can only predict a limited class of ions. The difficulty
arises from the inherent limitation of the experimental methods which makes it
challenging to observe the charging mechanism. Alternatively, molecular dynamics simulations can be a useful tool for investigating the mechanism of generating
1.3
Electrostatics of DNA in bulk solutions
Solutions of electrolytes and polyelectrolytes deviate significantly from ideal
be-haviour. In general, ions experience electrostatic interactions that are long-ranged,
decaying much slower than van der Waals forces. In salt solutions, the electrostatic
interactions between ions of the same charge polarity are less pronounced due to
the screening effect of the counterions. Debye and Hückel, in the 1920s,
devel-oped an approach to describe the deviation of an electrolyte solution from ideal behaviour [72]. Their approach was only valid in dilute solutions which allowed
the linearization of the nonlinear Poisson-Boltzmann (NLPB) equation [73,74] to
find an analytical solution for the electrostatic potential around a small ion. For
polyelectrolytes, the advancements began after the development of the rod-like
model [75]. However, the lack of finding analytical solutions for the NLPB
equa-tion limited subsequent progress. The ‘counterion condensaequa-tion’ phenomenon [76]
provided a simpler description of the charge distribution around a polyelectrolyte.
The aim of this section is to review some significant advances in the area of
electrolytes and polyelectrolytes in the framework of electrostatics. Also, this
section outlines the derivation of the electrostatic potential in strong electrolyte solutions and discusses the electrostatic properties for linear polyions.
1.3.1
Strong Electrolyte Solutions
A good starting point to understand the physical and chemical properties of
poly-electrolytes is to review the properties of strong poly-electrolytes.
Strong electrolyte solutions are important systems in physical chemistry and
biophysics. Even in dilute conditions, strong electrolyte solutions exhibit deviation
from ideal solution behaviour. The reason for this deviation is that the
interac-tion between ions is long-ranged, decaying much slower than the van der Waals
interactions.
The primitive model presented here was developed by Debye and Hückel in the
1920s [72]. This model, which is presented schematically in Figure 1.4, is valid only
for very dilute solutions of electrolytes. The simplest example that can be treated
the cations and anions have an equal bulk number density denoted by nb. This
model also assumes that the ions have a hard-core diameter a. When we assume that the cations and anions have equal diameters, the model is called ‘restricted primitive model’ in which no two ions can come closer than the diameter a.
Figure 1.4: Primitive model of electrolytes in solutions. The model was developed by Debye and Hückel in the 1920s [72]. The solvent in the background is modelled as a continuum medium with the permittivity of the dielectric ε. The closest distance a counterion can approach the central ion is a. The charges are in the units of e, the elementary charge unit.
The major energetic contribution between ions is electrostatic. Consider an ion
i in the model presented in Figure 1.4. An ion i can interact with a neighbouring ion j through the electric potential energy,
U(rij) =
1 4πε
qiqj
rij
(1.13)
whererij is the separation distance between the chargeqiand the chargeqj;εis the
permittivity of the dielectric medium. The total electrostatic potential energy on
idue to all other ions can be expressed by applying the principle of superposition. The principle states that the interaction between two charges is unaffected by the
energy onqi by summing up the contributions from the N-j charges on qi:
U(ri) = N X
j=1
1 4πε
qiqj
rij
(1.14)
where ri is the spatial vector of ion i. A more useful expression is to write
Equa-tion (1.14) in terms of the electrostatic potential φ:
U(ri) =qiφ(ri). (1.15)
From Equation (1.14) we find that the expression
φ(ri) =
1 4πε X j qj rij (1.16)
is the electrostatic potential at the position of qi.
A fundamental equation of electrostatics that relates the electrostatic potential
to the charge density is the Poisson equation:
∇2φ(r) =−ρ(r)
ε (1.17)
where ∇2 is the Laplacian operator,3 and the charge density ρ(r) represents the
excess charge per volume at location r in the solution. For a set of point charge ions, the charge density can be expressed by ρ(r) =P
iqiδ[r−ri] where the Dirac
δ-function restricts the summation to the charge qi at the point ri.
Another fundamental law in electrostatics is Gauss’s law:
Z
S
E·da=1
ε
X
i
qi (1.18)
where S is a closed surface and the sum over the qi corresponds to the total
enclosed charge. Here, the integrand is a scalar quantity representing the ‘flux’
of the electric field E through a small area da on the surface. In this model, the whole surface is divided into infinitesimally small patches represented by vectors
aj normal to the surface and have magnitudes equal to the area of the patch. On
a spherical surface enclosing a point charge, the electric field due to this charge
is perpendicular and also constant everywhere on the surface. Thus, integrating
3The expression of the Laplacian operator in Cartesian coordinates is given by ∂2 ∂x2+
∂2 ∂y2+
Equation (1.18) gives
Z
SE·da=E Z
Sda ,
q
ε = 4πr
2E (1.19)
where in the second line, the integration over a spherical surface of radius r gives the surface area 4πr2.
Owing to the Coulomb interactions, the region surrounding an ion in salt
solu-tion will be enriched in counterions. If we consider Figure 1.4, the region near the
central cation will have an excess negative charge. This region is called the ‘ionic
atmosphere’. Here, under the assumption that all ions have the same diameter
value a, no ions can be closer than r=a to the central ion. Thus, in the region where r < a the charge density ρ= 0.
The Debye-Hückel (DH) theory gives an accurate account for the deviation
from ideal behaviour in dilute electrolyte solutions. However, the DH theory was
developed based on a number of approximations. First, the theory is only accurate
in dilute solutions where the neighbouring ions are far apart that the electrostatic
repulsion is null. Here, we can approximate a spherically symmetric charge
dis-tribution of the counterions in the ionic atmosphere. Thus, the favourable
elec-trostatic potential will be spherically symmetric between the central ion and the counterions in the ionic atmosphere. It is convenient to express Equation (1.17) in
the spherical coordinate system,
∇2φ(r) = 1
r2
d dr
r2dφ dr
=−ρ(r)
ε (1.20)
where r is the distance from the central ion. The second approximation assumes that the concentration of counterions surrounding the central ion is low so that the
electrostatic repulsions between the neighbouring counterions are negligible. This
approximation allows the use of Boltzmann statistics to express the population of
the number density of the counterions,n−, relative to the bulk number density of ions, nb. A detailed derivation of the solution is given in Appendix A.
From the linearized Poisson-Boltzmann equation given in Appendix A for any
number s of ionic species, we re-write the constant κ2 as
κ2= 1
εkBT
s X
i
where s is the number of ionic species and ci is the concentration of species i
(ci=nb,i). Equation (1.21) relates directly to the ionic strength I by
I=1 2
s X
i
qi2ci . (1.22)
The constant κ−1 is the ‘Debye length’; it plays an important rule in the DH theory. The Debye length measures how far the electrostatic effects of a charge in
solution persists. For other types of electrolyte solutions besides the 1-1 type, the
Debye length can be simply modified and then applied to the linearized
Poisson-Boltzmann equation (Equation (A.8)).
The linearized Poisson-Boltzmann equation can be solved for the electrostatic
potentialφin the spherical coordinate system. A detailed derivation of the solution is given in Appendix A. where the final expression for the electrostatic potential
is given by
φ(r) =
q
4πεr− q
4πεa
κa
1 +κa
0< r < a
q
4πεr
exp[−κ(r−a)]
1 +κa r > a .
(1.23)
We can now use the Poisson equation with the definition of the potential for
r > a to find the charge density surrounding the central ion:
ρ(r > a) =−ε∇2φ(r) =−qκ
2exp[−κ(r−a)]
4πr(1 +κa) (1.24)
As we expect, the charge density surrounding a cation is negative, reflecting the
excess negative charge in the ionic atmosphere.
The charge surrounding the central ion can be calculated from the following
integral:
Z ∞
a ρ(r > a)4πr
2dr (1.25)
in the spherical coordinate system. Substituting Equation (1.24) forρ gives
− q 4π
Z ∞
a
κ2exp[−κ(r−a)]
r(1 +κa) 4πr
2
dr=−q . (1.26)
This result shows that the charge in the ionic atmosphere is exactly equal and
the net charge is zero, effectively ’screening’ the charge of central ion. For a
1-1 electrolyte solution at 25◦C and a salt concentration of c= 0.01 mol/L, the Debye length κ−1= 3.04/c1/2 Å [77]. Thus, κ−1≈ 30 Å and corresponds to the radius of the ionic atmosphere. In contrast to the van der Waals interactions that
decay rapidly with distance, the electrostatic interactions are dominant at a short
distance.
Screening is a distinct feature of electrolyte solutions. The form of
Equa-tion (1.23) shows that the electrostatic potential decays exponentially. Thus, the
electrostatic potential in electrolyte solutions is a short-range interaction that
de-cays much faster than the Coulomb potential that dede-cays as r−1. This trend can help explains some phenomena associated with macroions, such as DNA, in
a charged droplet. These phenomena are discussed in Chapter 3, Chapter 4, and
Chapter 5.
1.3.2
Polyelectrolytes
Polyelectrolytes are polymers having many ionizable groups. They are commonly
investigated in biochemistry and molecular biology because nucleic acids and
pro-teins are polyelectrolytes. In solution, they dissociate into polyvalent macroions
and many small ions of opposite charge polarity (counterions). The charge of the
macroion produces a strong electric field that attracts the counterions. The
in-teraction of the macroion and its counterions in solution is an important factor of
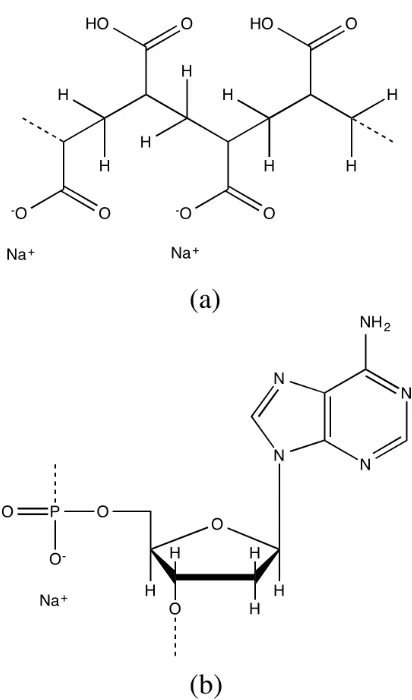
the characteristic properties of polyelectrolytes [78]. Poly(acrylic acid) (PAA) was the first synthetic polyelectrolyte. PAA has many ionizable groups (-COOH) on
each of its monomers (Figure 1.5(a)). DNA duplex is an example of highly charged
polyanion (Figure 1.5(b)). A DNA internal phosphate diester has an ionizable
hy-droxyl group with a pKa (the negative logarithm of the acid association constant)
value of nearly zero [79]; it completely ionizes in a pH range from 4.0 to 10.5 and
has one negative charge. A terminal phosphate has two hydroxyl groups and has
two negative charges for pH> 7.
The theoretical description of a fully ionized electrolyte initiated with the
derivation of the non-linear Poisson-Boltzmann (NLPB) equation for the
electro-static potential surrounding an ion in solution [72]. The theory of a uniformly charged rod-like polyion commenced later following the analytical solutions of
the NLPB equation [73, 74]. However, these analytical results were based upon
Figure 1.5: Examples of the chemical structures of polyelectrolytes and typical counterions. (a) Poly(acrylic acid); (b) Adenosine nucleotide. Metal ions such as Na+ and K+ are common counterions for the negatively charged polyions.
by the lack of analytical solutions of the NLPB equation under general conditions,
such as realistic shape, charge distribution, and the present of salt. Under such conditions, analytical solutions of the NLPB equation are formidable to obtain.
Alternatively, numerical solutions of the NLPB equation were required. A simpler
theoretical approach that provides insight on polyions properties is counterion
con-densation (CC) [76]. Counterion condensation can predict some polyion properties
of DNA. Despite its simplicity, CC theory continues to provide valuable insight into
the properties of DNA in bulk solutions.
Important questions have sparked interest in studying the properties of poly-electrolytes. How do the theories for strong electrolyte solutions compare to
the-ories for polyelectrolyte solutions? How to model linear polyions in molecular
the solution affects the morphology of the polyelectrolyte? The mechanisms of the
interaction between polyelectrolytes, or between polyelectrolytes and the charged
cell membrane, are not fully understood. For example, one question that has been puzzling is why two like-charge macroions, such as DNA, should attract each other
and form stable complexes in solutions.
1.3.3
Non-covalent nucleic acid-ion interactions
Non-covalent, reversible, interactions between biological molecules control most
processes taking place in the cell. Nucleic acids’ packaging and their structural sta-bility rely on the reversible interactions of DNA-protein and DNA-small molecules.
Biological processes such as gene expression (production of protein from a gene
se-quence) and DNA replication also rely on the numerous reversible interactions with
other biological molecules [80–82]. These interactions are well understood. More
subtly, nucleic acids interactions with water and ions also take part in the
struc-tural integrity and cellular processes that include nucleic acids. Considering their
central role in gene expression and DNA replication, nucleic acids have become
attractive targets for small drug molecules [83–88]. These therapeutic molecules
are designed to control the malfunction of nucleic acids in a biological cell and
aimed to treat major diseases such as cancer. Generally, DNA is a more attrac-tive anticancer-drug target than RNA. Thus, it is more rewarding to study the
reversible interactions of molecules with DNA.
Small cations are always bound to negatively charged nucleic acids in biological
cells. For a therapeutic molecule to interact effectively with nucleic acids,
therapeu-tic molecules must have a stronger affinity with nucleic acids than the non-covalent
bound ions. Thus, understanding the reversible interactions between nucleic acids
and small ions is essential for the design of effective therapeutic molecules to treat
cancer.
X-ray and NMR techniques may provide the structure of DNA complexes with
various molecules and ions. However, knowledge of the conformation alone may be
insufficient to understand the formation of DNA complexes. Some small molecules
interact with DNA to form complexes that may have similar structures but may have different driving forces towards their formation. Therefore, to understand the
factors that affect the formation of the DNA complexes, we must determine the
underlying forces (Chapter 4) and relevant thermodynamic quantities (Chapter 6).
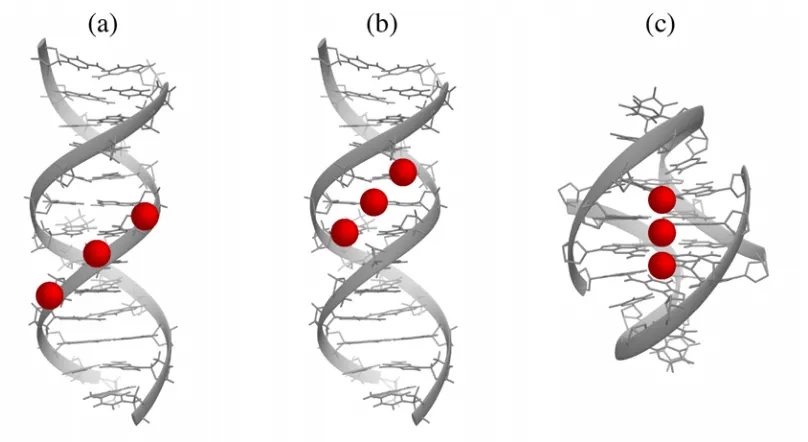
94]. Edge binding: This involves the binding of cations such as Na+ and Mg2+ with the outside phosphate-backbone of DNA (Figure 1.6). This mode of binding
is non-specific and predominantly electrostatic in nature. Groove binding: In the major and minor grooves of DNA, small cations bind to the protruded functional
groups from the DNA bases (Chapter 4). Helical axis binding: In addition to the
edge and groove binding modes, higher order DNA structures have, exclusively,
a third binding mode. DNA triplexes and quadruplexes have a single channel
along their helical axis enriched with electronegative carbonyl-oxygen atoms. This
electronegative environment is an attractive target for the binding of small cations
such Na+ or K+ (Chapter 6).
Figure 1.6: Representations of major binding modes for cation-DNA [89–94]. (a) Edge binding of cations (in red) to DNA duplex. (b) Groove binding of cations to DNA duplex. (c) Helical axis binding of cations to a DNA quadruplex.
Nucleic acids are ideal examples of highly charged polyanions. Their
polyan-ionic nature plays a central role in the binding of small ions that affects the folding,
structural integrity, and ion condensation. Nucleic acids are fully charged over a
pH range from 4.0 to 10.5. In such a solution, each phosphate group along the
chain contributes a single electronic charge. These charges are intrinsic, covalently
bound, to the DNA. In the B-DNA conformation, the distance between the base pairs is about 3.4 Å. Thus, the free energy cost of packing so many charges in
a small space would be prohibitive. Hence, in solutions, a DNA duplex is
phosphate groups.
The electrostatic potential around a polyion in salt solution of 1-1 valency at a
salt concentration of cs can be ‘approximated’ by solving the non-linear
Poisson-Boltzmann equation,
∇2φ(r) =−ρ(r)
ε (1.27)
where ρis the charge density at position r given by
ρ(r) =ecs(e−eφ(r)/kBT−eeφ(r)/kBT) . (1.28)
The expression forρ is based on Gaussian statistics to account for the freedom of movement of ions in solution,
ci=cse−Wi/kBT (1.29)
where ci is the ion concentration at a local point; cs is the salt concentration in
bulk;Wi is the work required to move an ion to the local point from infinity.
The solution of the non-linear Poisson-Boltzmann for a polyion is based on
the approximation that Wi in Equation (1.29) can be replaced by eφ(r)
(Equa-tion (1.28)). However, the Debye-Hückel approxima(Equa-tion is inapplicable to highly
charged polyelectrolytes [95]. Exact analytical solutions of the NLPB equation are
available in absence of salt. For infinite uniformly charged cylinders in the presence
of salt, a variety of numerical integration schemes have been reported [96, 97].
The ionic atmosphere of a DNA in a salt bath has an excess of counterions and a deficit of co-ions. The concentrations of the small ions within the ionic atmosphere
approach their respective bulk values as their distance from the DNA molecule
increases. Accordingly, a hypothetical surface of the ionic atmosphere defines the
distance from the polyion surface beyond which the concentrations of the small ions
are that of the bulk values. Within the ionic atmosphere, then, the charge density
at any point is the difference between the charge concentrations of the counterions
and co-ions at that point. For example, in a solution of NaCl, the concentrations
of the Cl– and Na+ ions are equal. In the ionic atmosphere of the DNA, the net density of the positive charge at any point is given by the elemental charge (e) times the concentration of excess Na+ ions. Integration of the net charge density inside the ionic atmosphere gives the total positive charge that compensates the
![Fig ur e1 .1 : Mr e pr e s e nt s a n int e r f a c e be t w e e n t he inne r pr e s s ur epr e s s ur eo de l o f pr e s s ur ea c r o s sint e r f a c e .T hemo de l s ho w st hee ff e c to fdiff e r e nc ea c r o s sas t r e t c he d me mbr a ne3 5[ ]](https://thumb-us.123doks.com/thumbv2/123dok_us/1941203.1255232/21.612.131.499.302.572/fig-inne-epr-sint-hemo-hee-fdi.webp)
![Fig ur e 4 .4 : ( a ) So lv a t e d [ds D NA]2 0t he s t r o ng e s t ( middle r e g io n) , t he numbe r o f w a t e r mo le c ule s is s ma lle r](https://thumb-us.123doks.com/thumbv2/123dok_us/1941203.1255232/113.612.126.490.83.463/fig-ur-na-middle-io-numbe-ule-lle.webp)