Scholarship@Western
Scholarship@Western
Electronic Thesis and Dissertation Repository
8-14-2018 10:00 AM
The Development of Metal Complexes as Components of
The Development of Metal Complexes as Components of
Fluorescent and Nuclear Imaging Probes
Fluorescent and Nuclear Imaging Probes
William Turnbull
The University of Western Ontario
Supervisor Luyt, Leonard G.
The University of Western Ontario Graduate Program in Chemistry
A thesis submitted in partial fulfillment of the requirements for the degree in Doctor of Philosophy
© William Turnbull 2018
Follow this and additional works at: https://ir.lib.uwo.ca/etd
Part of the Organic Chemistry Commons Recommended Citation
Recommended Citation
Turnbull, William, "The Development of Metal Complexes as Components of Fluorescent and Nuclear Imaging Probes" (2018). Electronic Thesis and Dissertation Repository. 5517.
https://ir.lib.uwo.ca/etd/5517
This Dissertation/Thesis is brought to you for free and open access by Scholarship@Western. It has been accepted for inclusion in Electronic Thesis and Dissertation Repository by an authorized administrator of
i
The advent of molecular imaging as a discipline has drastically improved our ability to understand the biochemical and cellular events that drive life, death and disease. This thesis will document the discovery of new metal chelators for Re/99mTc, new methods of
incorporating these metals into peptide structures, as well as new fluorescent compounds. These novel methods and compounds may be used in the development of molecular imaging probes for single photon emission computed tomography (SPECT) and optical imaging techniques, with applications for differentiating cancerous tissue from benign and healthy.
Chapter 2 discusses the development of a dual modality Re/99mTc imaging probe for
fluorescence/SPECT imaging for evaluating CXCR4 expression in cancer cells. The T140 derivative contains a 4-amino-1,8-naphthalimide chelator to bind rhenium or technetium-99m for fluorescence or SPECT imaging. The rhenium coordinated peptide retained high affinity for CXCR4 and was able to detect cells expressing the receptor by fluorescence microscopy. However, little uptake of the technetium-99m labelled peptide was observed in CXCR4 expressing tumors in a murine model.
Chapter 3 aims to address the shortcomings of the naphthalimide chelation system discussed in chapter 2. Three 4-amino-1,8-naphthalimides containing chelators with a positive, neutral or negative charge were synthesized and coordinated with rhenium. All three complexes had photophysical properties that were compatible with confocal fluorescence microscopy and showed uptake in cells that was dependent on charge. All three ligands were radiolabelled with technetium-99m in high radiochemical yield and purity.
Chapter 4 discusses the development of ab-hairpin forming peptide containing a 2,2’-bipyridine moiety to chelate Re/99mTc. A novel amino acid based on
ii
Chapter 5 discusses the development of 2,2’-bipyridine-based fluorophores for the detection of intracellular Zn(II). Two benzimidazole functionalized bipyridines were found to have a fluorescence response to Zn(II) that was compatible for detection by confocal fluorescence microscopy. Both ligands displayed fluorescence in benign prostate cells due to Zn(II) coordination but not in prostate cancer cells. These ligands are promising candidates for the detection of Zn(II) in ex vivo prostate tissues for differentiating malignant tissue from benign and healthy.
Keywords
iii
Co-Authorship Statement
Chapter 2 is a manuscript in preparation. All work was performed by William Turnbull except for the ex vivo biodistribution studies which were performed by Dr. Lihai Yu, and the fluorescence quantum yield measurements and spectra collection which were performed by Dr. Mark Milne.
Chapter 3 is a manuscript in preparation. Synthesis of L1, L2, L3, Re-L1, Re-L2 and Re-L3, acquisition of UV/Vis and fluorescence spectra, and all cell culture and in vitro cell experiments were performed by William Turnbull. Synthesis of compounds 1-3 and radiolabelling with technetium-99m was performed by Emily Murrell. Determination of fluorescence quantum yields, compound characterization by NMR & MS, and development of synthetic methodology was performed by Mariel Bulcan-Gnirss.
iv
Acknowledgments
The past 5 years have been quite the adventure, and the people who have been along for the ride have made it worth every moment.
Firstly, I’d like to thank my wife Alissa Morrison. Whatever life has thrown at us, she has always been right there by my side, and there’s nobody else that I trust and treasure more than her. I’ve become a much better person in the years we’ve had together and can’t imagine having done it all without her. I can’t wait to experience the next chapter of our lives together.
I’d also like to thank my parents, grandparents and siblings. They’ve taken every opportunity they can to tell me how proud they are of my accomplishments in grad school, even at times when I didn’t feel so proud myself. Their love and support has been invaluable to me, and I’m incredibly lucky to have all of them in my life.
I am also incredibly grateful to all of the wonderful people I’ve worked alongside. I’d like to thank my good friends Axie Hauser-Kawaguchi, Emily Murrell, Jordan LeSarge, Marina Lazarakos and Mark Milne. I couldn’t ask for a better group of people to have shared so many frustrations, hardships, laughs and celebrations with.
Also, a big shout out to my best friend Christopher Mattice. Ever since undergrad, we’ve been attached at the hip. Despite living so far away, we have always been there for one another, and have shared some great times together.
v
Table of Contents
Abstract ...i
Co-Authorship Statement ... iii
Acknowledgments ... iv
Table of Contents ... v
List of Tables ... ix
List of Figures ... x
List of Schemes ... xvii
List of Abbreviations ...xviii
Chapter 1 ... 1
1 Introduction ... 1
1.1 Molecular Imaging ... 1
1.2 Molecular Imaging Probes ... 2
1.2.1 Targeting Entity ... 2
1.2.2 Signaling Entity ... 4
1.3 Single Photon Emission Computed Tomography ... 7
1.4 Technetium-99m ... 8
1.5 Rhenium ... 12
1.6 C-X-C Chemokine Receptor 4 ... 13
1.7 Biological Roles of Zinc ... 18
1.7.1 Zinc in Prostate Cancer ... 19
1.7.2 Fluorescent Probes Responsive to Zinc ... 20
1.8 Summary ... 25
1.9 References ... 26
vi
2 A Dual Modality Tc/Re(I)-Labelled T140 Analogue for Imaging of CXCR4
Expression ... 36
2.1 Introduction ... 36
2.2 Results and Discussion... 38
2.2.1 Design and Synthesis ... 38
2.2.2 In Vitro Evaluation of Re-7 ... 40
2.2.3 99mTc-labelling and In Vitro Cellular Uptake ... 42
2.2.4 Ex Vivo Biodistribution Studies ... 43
2.3 Conclusions ... 44
2.4 Experimental... 45
2.4.1 General Experimental ... 45
2.5 References ... 53
Chapter 3 ... 56
3 A Study of 99mTc/Re-Tricarbonyl Complexes of 4-Amino-1,8-Naphthalimides ... 56
3.1 Introduction ... 56
3.2 Results and Discussion... 58
3.2.1 Synthesis and Structural Evaluation ... 58
3.2.2 Photophysical Properties ... 60
3.2.3 Confocal Microscopy ... 62
3.2.4 Radiolabelling with Technetium-99m ... 63
3.3 Conclusions ... 65
3.4 Experimental... 65
3.4.1 General Experimental ... 65
3.5 References ... 72
Chapter 4 ... 74
vii
4.1 Introduction ... 74
4.1.1 Protein Secondary Structure ... 74
4.1.2 Imaging Probe Design: Integrated Versus Pendant ... 75
4.1.3 2,2’-Bipyridine as a Bidentate Chelator ... 76
4.2 Results and Discussion... 78
4.2.1 Synthesis of 3,3’-Diamino-2,2’-Bipyridine Amino Acid ... 78
4.2.2 Design of a b-Hairpin Peptide ... 79
4.2.3 Synthesis of a b-Hairpin Peptide... 81
4.2.4 Structural Evaluation by Circular Dichroism Spectroscopy ... 82
4.2.5 Formation of the [2+1] Rhenium Complex and Radiolabelling with Technetium-99m ... 83
4.3 Conclusions ... 85
4.4 Experimental... 85
4.5 References ... 90
Chapter 5 ... 92
5 Amino-Substituted 2,2’-Bipyridine Ligands as Fluorescent Indicators for Zn(II) and Applications for Fluorescence Imaging of Prostate Cells ... 92
5.1 Introduction ... 92
5.2 Results and Discussion... 93
5.2.1 Synthesis ... 93
5.2.2 UV/Vis Absorption Studies ... 94
5.2.3 Fluorescence Studies ... 100
5.2.4 Effects of Other Metal Ions on the Absorption and Emission Spectra ... 105
5.2.5 Confocal Microscopy of Prostate Cell Lines ... 106
5.3 Conclusions ... 108
5.4 Experimental... 109
viii
Chapter 6 ... 115
6 Conclusions ... 115
6.1 References ... 115
Appendix A: Additional Data for Chapter 2 ... 122
Appendix B: Additional Data for Chapter 3 ... 126
Appendix C: Spectra of Compounds from Chapter 4 ... 141
Appendix D: Additional Data for Chapter 5 ... 147
ix
List of Tables
Table 2.1:Photophysical Properties of DPA-Naph Peptide Conjugates. ... 39
Table 3.1: Photophysical properties of the naphthalimide ligands and their Re(I)-tricarbonyl complexes. ... 62
Table 5.1: UV/Vs absorption characteristics of bipyridine ligands and their Zn(II) complexes in methanol... 95
Table 5.2: Photophysical properties of compound 2 in various solvents ... 96
Table 5.3: Photophysical properties of compound 4 in various solvents. ... 97
Table 5.4: Photophysical properties of compound 7 in various solvents. ... 98
Table 5.5: Fluorescence properties of the bipyridine ligands and their Zn(II) complexes in methanol. ... 104
Table A1: Ex vivo biodistribution data for [99mTc]Tc-7 in NOD/SCID mice two hours post-injection ... 125
x
List of Figures
Figure 1.1: Comparison of spatial resolution and molecular sensitivity between imaging
modalities. ...2
Figure 1.2: Examples of molecular imaging probes for PET ([18F]FDG), SPECT ([99m Tc]Tc-HYNIC-TOC) and OI (RGD-Cy5.5). ...3
Figure 1.3: Structures of some common fluorophores (A-C), bifunctional chelators (D-F) and prosthetic groups (G and H) used in signaling components of molecular imaging probes. ...5
Figure 1.4: Methods for incorporating a radioisotope into PET and SPECT molecular imaging probes. ...7
Figure 1.5: Radioactive decay scheme of 99Mo to the stable isotope 99Ru...9
Figure 1.6: Examples of “99mTc-essential” and “99mTc-tagged” radiopharmaceuticals. ... 10
Figure 1.7: 99mTc(I)-tricarbonyl complexes formed with a wide variety of ligands. ... 11
Figure 1.8: Two-component binding of a carbonyl ligand to a metal center... 12
Figure 1.9: Examples of luminescent Re(I)-tricarbonyl complexes with polypyridyl ligands. ... 13
Figure 1.10: The development of T140 from polyphemusin II ... 15
Figure 1.11: Peptide and small molecule inhibitors of CXCR4. ... 16
Figure 1.12: PET and SPECT molecular imaging agents targeting CXCR4... 17
Figure 1.13: Biological distribution and functions of zinc ... 19
Figure 1.14: Evolution of zinc responsive fluorescent probes: TSQ, to the more cell membrane permeable ZnAF-R2, and the visible light excitable FluoZin-1, and the cell membrane permeable variant FluoZin-1 AM. ... 21
xi
Figure 1.16: ICT mechanism in non-polar and polar solvents (top), and upon coordination to Zn(II) (bottom). ... 24
Figure 1.17: Process of ESIPT occurring in HBO, and Zn(II) coordination suppressing ESIPT... 25
Figure 2.1: Structure of T140 (6) and the newly synthesized derivative DPA-Naph-T140 (7). ... 38
Figure 2.2: Representative competitive binding curves of T140 (black curve) and Re-7 (grey curve) using U87.CD4.CXCR4 cells with [125I]-SDF-1 as the competing radioligand. ... 40
Figure 2.3: Confocal microscope images of U87.CD4.CXCR4 cells (A, C) and U87.CD4 cells (B, D) incubated with Re-7 ... 41
Figure 2.4: Confocal microscope images of BPH-1 (A, D), PC-3 (B, E) and DU 145 cells (C, F) incubated with Re-7 ... 42
Figure 2.5: (Left) UV-HPLC chromatogram of Re-7 (blue) overlaid with the radio-HPLC chromatogram of [99mTc]Tc-7 (black). (Right) In vitro cellular uptake of [99mTc]Tc-7 in
U87.CD4.CXCR4 cells in comparison to U87.CD4 cells. ... 43
Figure 2.6: Ex vivo biodistribution of [99mTc]Tc-7 in U87.CD4.CXCR4 tumor bearing mice
at 2 hours post-injection (n = 3). ... 44
Figure 3.1: Structures of the three naphthalimide ligands coordinated to Re or 99mTc. ... 57
Figure 3.2: 1H NMR spectroscopy chemical shifts of the chelator arm methylene (red) and
linker ethylene (black) protons of L1 (top left) and L3 (top right) and changes upon rhenium coordination (bottom). ... 60
Figure 3.3: UV/Vis absorption (A-C) and fluorescence excitation/emission spectra (D-F) of the ligands (lEx = 440 nm) and their rhenium complexes (lEx = 425 nm) in CH3CN (20 µM).
xii
Figure 3.4: Confocal fluorescence microscope images of OVCAR-8 cells (A-C 40X, D-F 100X) incubated with: (A, D) Re-L1; (B, E) Re-L2; and (C, F) Re-L3 at a concentration of
20 µM (lEx = 458 nm). ... 63
Figure 3.5: HPLC chromatograms(System II, 20-80% Solvent A) of the 99mTc-labelled ligands (blue) and their Re-coordinated standards (pink)... 64
Figure 4.1: Parallel (left) versus anti-parallel (right) β-sheets. ... 74
Figure 4.2: Pendant (left) versus integrated (right) design. ... 75
Figure 4.3: Square planar Cu(II) complexes nucleating β-sheet formation... 76
Figure 4.4: Synthesis of isostructural [2+1] complexes of Re and 99mTc. ... 77
Figure 4.5: Proposed Fmoc-protected 2,2’-bipyridine amino acid. ... 77
Figure 4.6: β-Hairpin peptide BH8 (top). 2,2’-Bipyridine β-hairpin peptide 7 (bottom). ... 81
Figure 4.7: Circular dichroism spectra of peptide 7 in water (blue) and 30% TFE (orange). . 83
Figure 4.8: Coordination of peptide 7 and 4-DMAP with rhenium to form a [2+1] chelation system. ... 84
Figure 4.9: UHPLC chromatograms of the Re coordinated peptide 7 (top) and 99mTc-labelled peptide 7 (bottom). ... 85
Figure 5.1: Amine substituted 2,2’-bipyridine ligands. ... 93
Figure 5.2: Proposed ICT excited state of compound 2. ... 96
Figure 5.3: UV/Vis absorption spectra of compound 4 in (A) non-polar and (B) polar solvents. ... 97
xiii
Figure 5.5: Fluorescence emission spectra of compound 4 in a range of solvents. ... 101
Figure 5.6: Lippert plots of compound 2 (orange), compound 4 (blue) and compound 7
(green). ... 102
Figure 5.7: Fluorescence emission spectra of compound 1 (A) compound 2 (B) compound 4
(C) compound 6 (D) and compound 7 (E) at a concentration of 20 µM in methanol upon titration with ZnSO4 ... 103
Figure 5.8: UV/Vis absorbance and fluorescence emission spectra of compound 6 (A and D, black) and compound 7 (B and D, black) in the presence of Fe(III) (brown), Cu(II) (blue), Mg(II) (magenta), Ca(II) (green) and Zn(II) (red). ... 106
Figure 5.9: (A) BPH-1, (B) DU 145 and (C) PC-3 cells incubated with compound 6 (20 µM) for 60 minutes. (D) BPH-1, (E) DU 145 and (F) PC-3 cells incubated with compound 6 (20
µM) for 60 minutes, followed by the addition of ZnSO4 (200 µM) for 60 minutes ... 107
Figure 5.10:(A) BPH-1, (B) DU 145 and (C) PC-3 cells incubated with compound 7 (20
µM) for 60 minutes. (D) BPH-1, (E) DU 145 and (F) PC-3 cells incubated with compound 7
(20 µM) for 60 minutes, followed by the addition of ZnSO4 (200 µM) for 60 minutes ... 108
Figure A1: 1H NMR spectrum (400 MHz; CDCl
3) of compound 5 (DPA-Naph-OH). ... 122
Figure A2: 13C NMR spectrum (100 MHz; CDCl
3) of compound 5 (DPA-Naph-OH). ... 123
Figure A3: HPLC chromatogram (10-70% CH3CN/H2O + 0.1% TFA) of peptide 6 (T140).
... 123
Figure A4: HPLC chromatogram (20-80% CH3CN/H2O + 0.1% TFA) of peptide 7
(DPA-Naph-T140). ... 124
Figure A5: HPLC chromatogram (20-80% CH3CN/H2O + 0.1% TFA) of peptide Re-7
(Re(CO)3-DPA-Naph-T140). ... 124
Figure B1: 1H NMR spectrum (400 MHz; CD3OD) of compound 3. ... 126
xiv
Figure B3: H NMR spectrum (400 MHz; CDCl3) of L1. ... 128
Figure B4: 13C NMR spectrum (100 MHz; CDCl3) of L1. ... 129
Figure B5: 1H NMR spectrum (400 MHz; acetone-d 6) of Re-L1. ... 130
Figure B6: 13C NMR spectrum (100 MHz; acetone-d6) of Re-L1. ... 131
Figure B7: 1H NMR spectrum (400 MHz; CD3OD) of L2... 132
Figure B8: 13C NMR spectrum (100 MHz; CD3OD) of L2. ... 133
Figure B9: 1H NMR spectrum (400 MHz; CD3CN) of Re-L2. ... 134
Figure B10: 1H NMR spectrum (400 MHz; CD 3OD) of L3... 135
Figure B11: 13C NMR spectrum (100 MHz; CD 3OD) of L3. ... 136
Figure B12: 1H NMR spectrum (400 MHz; CD3OD) of Re-L3. ... 137
Figure B13: 13C NMR spectrum (100 MHz; CD3OD) of Re-L3. ... 138
Figure B14: Confocal microscope images of OVCAR-8 cells incubated with Re-L1 (A, D) Re-L2 (B, E) and Re-L3 (C, F) at a concentration of 20 µM (lEx = 458 nm, 40x objective). ... 139
Figure B15: Confocal microscope images (lEx = 458 nm, 100x objective) of OVCAR-8 cells incubated with Re-L1 (left), Re-L2 (middle) and Re-L3 (right) ... 140
Figure C1: 1H NMR spectrum (CDCl 3; 400 MHz) of compound 1. ... 141
Figure C2: 13C NMR spectrum (CDCl 3; 100 MHz) of compound 1. ... 141
Figure C3: 1H NMR spectrum (CDCl3; 400 MHz) of compound 2. ... 142
Figure C4: 13C NMR spectrum (CDCl3; 100 MHz) of compound 2. ... 142
xv
Figure C6: C NMR spectrum (CDCl3; 100 MHz) of compound 3. ... 143
Figure C7: 1H NMR spectrum (CDCl3; 400 MHz) of compound 4. ... 144
Figure C8: 13C NMR spectrum (CDCl 3; 100 MHz) of compound 4. ... 144
Figure C9: 1H NMR spectrum (DMSO-d6; 400 MHz) of compound 5. ... 145
Figure C10: 13C NMR spectrum (DMSO-d6; 100 MHz) of compound 5. ... 145
Figure C11: 1H NMR spectrum (DMSO-d6; 400 MHz) of compound 6. ... 146
Figure C12: 13C NMR spectrum (DMSO-d6; 100 MHz) of compound 6. ... 146
Figure D1: 1H NMR Spectrum (CDCl 3; 400 MHz) of Compound 1. ... 147
Figure D2: 13C NMR Spectrum (CDCl 3; 100 MHz) of Compound 1. ... 148
Figure D3: 1H NMR Spectrum (DMSO-d6; 400 MHz) of Compound 2. ... 149
Figure D4: 13C NMR Spectrum (DMSO-d6; 100 MHz) of Compound 2. ... 150
Figure D5: 1H NMR Spectrum (DMSO-d 6; 400 MHz) of Compound 4. ... 151
Figure D6: 13C NMR Spectrum (DMSO-d 6; 100 MHz) of Compound 4. ... 152
Figure D7: 1H NMR Spectrum (1:1 CDCl 3:TFA-d; 400 MHz) of Compound 6. ... 153
Figure D8: 13C NMR Spectrum (1:1 CDCl 3:TFA-d; 100 MHz) of Compound 6... 154
Figure D9: 1H NMR Spectrum of (CDCl 3; 400 MHz) Compound 7. ... 155
Figure D10: 13C NMR Spectrum (CDCl 3; 100 MHz) of Compound 7. ... 156
Figure D11: UV/Vis absorption spectra of: (A) compound 2; (B) compound 4; (C) compound 6; and (D) compound 7 in various solvents. ... 157
xvi
Figure D13: Fluorescence emission spectra of compound 6 (20 µM) (top) and compound 7
(20 µM) in non-polar (bottom left) and polar (bottom right) solvents. ... 158
Figure D14: Fluorescence excitation and emission spectra of compound 2 in methanol (black), upon the addition of base (blue) and upon the addition of acid (red). ... 159
xvii
List of Schemes
Scheme 2.1: Synthesis of compound 5 (DPA-Naph-OH). ... 39
Scheme 3.1: Synthetic route to the three naphthalimide ligands and their Re(I)-tricarbonyl complexes. ... 59
Scheme 4.1: Initial synthesis of 3,3'-diamino-2,2'-bipyridine. ... 78
Scheme 4.2: Synthesis of 3,3'-diamino-2,2'-bipyridine amino acid (6). ... 79
xviii
List of Abbreviations
4-DMAP 4-dimethylaminopyridine
4-FB 4-fluorobenzoyl
Alloc allyloxycarbonyl
AM acetoxymethyl
AMC 7-amino-4-methylcoumarin
AU arbitrary units
AVMB 5-arylvinyl-5’-methyl-2,2’-bipyridyl
Boc tert-butyloxycarbonyl
BSA bovine serum albumin
BPA [bis(pyridine-2-ylmethyl)amino]acetic acid
BPH benign prostatic hyperplasia
bpy 2,2’-bipyridine
Bq Becquerel
CC50 half maximal cytotoxic concentration
CD circular dichroism
CD4 cluster of differentiation 4
CXCR4 C-X-C chemokine receptor 4
CyH cyclohexane
Da Dalton
DCM dichloromethane
DIC differential interference contrast
DIPEA N,N-diisopropylethylamine
DMEM Dulbecco’s modified Eagle’s medium
DMF N,N-dimethylformamide
xix
DOTA 1,4,7,10-tetraazacyclododecane-1,4,7,10-tetraacetic acid
DPA di-(2-picolyl)amine
DTPA diethylenetriaminepentaacetic acid
DX 1,4-dioxane
EDG electron donating group
EI electron ionization
EMEM Eagle’s minimum essential medium
ER endoplasmic reticulum
ESI electrospray ionization
ESIDPT excited-state intramolecular double proton transfer
ESIPT excited-state intramolecular proton transfer
EtOAc ethyl acetate
EtOH ethanol
eV electron volt
EWG electron withdrawing group
FBS fetal bovine serum
FDG 2-fluoro-2-deoxyglucose
FITC fluorescein isothiocyanate
Fmoc 9-fluorenylmethylcarbonyl
FRET Förster resonance energy transfer
GPCR G protein-coupled receptor
HATU 1-[bis(dimethylamino)methylene]-1H-1,2,3-triazolo[4,5-b]pyridinium 3-oxide hexafluorophosphate
HBO 2-(2’-hydroxyphenyl)benzoxazole
HBSS Hank’s balanced salt solution
xx
HEPES 4-(2-hydroxyethyl)piperazine-1-ethanesulfonic acid
HIV human immunodeficiency virus
HOMO highest occupied molecular orbital
HPLC high-performance liquid chromatography
HRMS high resolution mass spectrometry
HYNIC hydrazinonicotinic acid
IAP inhibitor of apoptosis protein
IC50 half maximal inhibitory concentration
ICT intramolecular charge transfer
LUMO lowest unoccupied molecular orbital
mAbs monoclonal antibodies
MAG3 mercaptoacetyl triglycine
MBHA methylbenzhydryl amine
MEM minimum essential medium
MeOH methanol
MLCT metal-to-ligand charge transfer
mM millimolar
MRI magnetic resonance imaging
MS mass spectrometry
MSAP multifunctional single attachment point
Naph 1,8-naphthalimide
NIR near infrared
nM nanomolar
NMP N-methylpyrrolidinone
NMR nuclear magnetic resonance
xxi
OI optical imaging
OTf trifluoromethanesulfonate
Pbf 2,2,4,6,7-pentamethyldihydrobenzofuran-5-sulfonyl
PBS phosphate buffered saline
PCa prostate cancer
PeT photoinduced electron transfer
PET positron emission tomography
RPMI Roswell Park Memorial Institute medium
ROS reactive oxygen species
RT room temperature
SAAC single amino acid chelate
SDF-1 stromal cell-derived factor 1
SFB N-succinimidyl 4-fluorobenzoate
SPECT single photon emission computed tomography
SPPS solid-phase peptide synthesis
SS Stoke’s shift
Suc succinamide
TAMRA 5-carboxytetramethylrhodamine
TBME tert-butylmethyl ether
TFA trifluoroacetic acid
TFE 2,2,2-trifluoroethanol
TIPS triisopropylsilane
TLC thin-layer chromatography
TOC Tyr3-Octreotide
Trt triphenylmethyl
xxii
UHPLC ultra high-performance liquid chromatography
UV ultraviolet
UV/Vis ultraviolet/visible
ZIP zrt-like, irt-like protein
Chapter 1
1
Introduction
1.1 Molecular Imaging
Living organisms are a complex medley of synergistic biochemical and cellular events, and unveiling these processes that drive life, death and disease is a formidable task. In the past, our progress towards this goal had been impaired by our inability to observe these processes in living organisms as they occur, without perturbing the natural environment in which they take place. The advent of molecular imaging as a discipline has drastically improved our ability to understand these processes. While the precise definition of the term
molecular imaging may be different amongst various researchers and scientists, the
definition put forth by Gambhir & James will be used here: the non-invasive, real-time visualization of biochemical processes at the cellular and molecular level within living cells, tissues or organisms.1 Not only do molecular imaging techniques allow for
fundamental research into biochemical and cellular processes, they also have use in a clinical setting, allowing for the diagnosis and monitoring of disease which can be used to devise treatments that may preclude the need for invasive procedures such as biopsies.
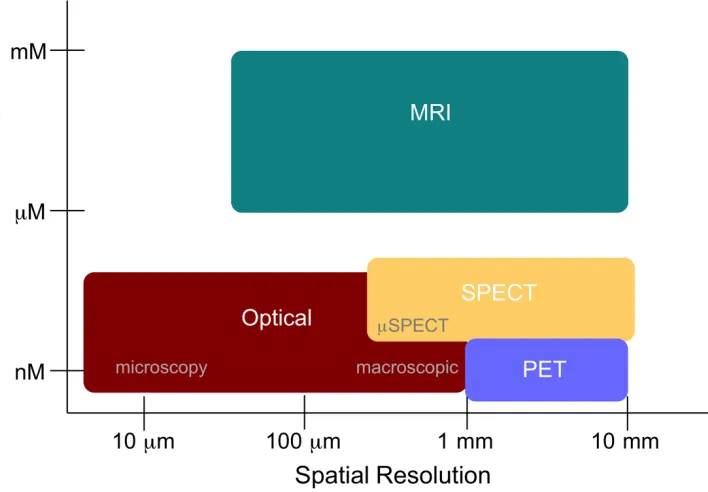
Molecular imaging is an incredibly broad field that encompasses a number of imaging modalities including, but not limited to: positron emission tomography (PET), single photon emission computed tomography (SPECT), magnetic resonance imaging (MRI) and optical fluorescence imaging (OI). Each of these imaging modalities has its own inherent strengths and weaknesses in terms of molecular sensitivity and spatial resolution (Figure 1.1) as well as depth of tissue penetration and cost.2 Nuclear imaging modalities such as
Figure 1.1: Comparison of spatial resolution and molecular sensitivity between imaging modalities.
1.2 Molecular Imaging Probes
Molecular imaging modalities often require a method to create a signal or image contrast that is detectable by external detectors. In order for this signaling entity to reach the organs, tissues or cellular compartments of interest it must be chemically attached to a targeting entity that is able to interact with molecular targets in the region of interest. These molecular targets may be receptors, transporters or enzymes. The combination of a targeting entity and signaling entity for the purpose of molecular imaging is called a molecular imaging probe, though other terms such as molecular imaging agent are often used. Figure 1.2 depicts three examples of molecular imaging probes. Further details about the targeting and signaling entities will be presented in this section.
1.2.1
Targeting Entity
charge, lipophilicity and binding affinity to the target of interest are all contributing factors.3–6 The most common targeting entities are derived from small molecules, peptides
or monoclonal antibodies (mAbs).
Figure 1.2: Examples of molecular imaging probes for PET ([18F]FDG), SPECT
([99mTc]Tc-HYNIC-TOC) and OI (RGD-Cy5.5).
Small molecules (usually <500 Da) typically offer good pharmacokinetic properties such as fast accumulation in the target tissues, and quick clearance from the vasculature, giving good signal-to-background contrast.1 However, due to their small size, they are often
weeks) and are retained in the blood for long periods of time which can result in low signal-to-background ratios, and therefore poor quality images.7 Peptides have found a place as
the “best of both worlds” between small molecules and mAbs. They offer the benefits of small molecules such as membrane permeability and fast clearance kinetics, but retain the high stability, target specificity and tolerance towards modification that mAbs possess.8,9
Peptides are also easily synthesized by solid-phase peptide synthesis, and are easily modified to improve in vivo stability, pharmacokinetics and affinity for the molecular target of interest.
1.2.2
Signaling Entity
A wide variety of signaling entities are available depending on the chosen imaging modality. Optical imaging requires the addition of a fluorescent molecule to the targeting entity. For in vitro cellular microscopy, fluorophores with emission wavelengths ranging from 400-600 nm are most widely used such as fluorescein isothiocyanate (FITC), 7-amino-4-methylcoumarin (AMC) and 5-carboxytetramethylrhodamine (TAMRA) (Figure 1.3, A-C). For in vivo imaging applications however, wavelengths in the near infrared (NIR) window (650-900 nm) are required due to signal attenuation by tissues in the visible range.10 Far-red cyanine dyes are the most commonly used fluorophores for this purpose.11
Figure 1.3: Structures of some common fluorophores (A-C), bifunctional chelators (D-F) and prosthetic groups (G and H) used in signaling components of molecular imaging probes. (A) Fluorescein isothiocyanate (FITC), (B) 7-amino-4-methylcoumarin (AMC), (C) 5-carboxytetramethylrhodamine (TAMRA), (D) 1,4,7,10-tetraazacyclododecane-1,4,7,10-tetraacetic acid (DOTA), (E) diethylenetriaminepentaacetic acid (DTPA), (F) [bis(pyridine-2-ylmethyl)amino]acetic acid (BPA), (G) N-succinimidyl [18
F]4-fluorobenzoate ([18F]SFB), (H) [11C]methyl iodide.
Four common strategies are employed for incorporating radioisotopes into targeting molecules: pendant labelling, prosthetic group labelling, direct labelling and integrated labelling (Figure 1.4).9 Pendant labelling is commonly employed with radiometals for
typically connected to one of the termini, or an amino acid chain such as a lysine side-chain. Some examples of molecules labelled by this method include somatostatin derivatives such as [99mTc]Tc-HYNIC-TOC14 and the CXCR4 targeting peptide [68
Ga]Ga-Pentixafor.15 This method can be problematic as it results in an increase in the molecular
weight and size of the molecule, and can affect binding to the target of interest. An integrated labelling approach may be used to mitigate the effects of pendant labelling. This method attempts to “hide” a radioisotope within the framework of the targeting entity, often using a radiometal to induce the formation of secondary structure in a protein or peptide, or stabilize already present secondary structures.16–18 An integrated approach has also been
employed in steroid mimics targeting the estrogen receptor.19–21 This approach of
concealing the radioisotope would ideally have little effect on the affinity of the targeting entity to the molecular target. Radionuclides such as 18F and 11C are most commonly
incorporated into imaging agents through the prosthetic group labelling approach. This involves the radiolabelling of a small molecule “prosthetic group” containing a reactive group which may then be conjugated to the targeting entities. N-succinimidyl [18
F]4-fluorobenzoate ([18F]SFB)22 and [11C]methyl iodide23 (Figure 1.3, G and H) are common
prosthetic groups employed for radiolabelling of peptides, proteins and small molecules. Direct labelling approaches are typically involved in the radiosynthesis of small molecules such as [18F]2-fluoro-2-deoxyglucose ([18F]FDG),24 where a leaving group is directly
displaced with the radionuclide. There are however, several published methods for the direct labelling of peptides and other biomolecules.25–27
Figure 1.4: Methods for incorporating a radioisotope into PET and SPECT molecular imaging probes. Pendant and integrated methods are often employed when using radiometals such as 68Ga and 99mTc, while prosthetic group and direct labelling are
employed with non-metal radioisotopes such as 11C and 18F.
1.3 Single Photon Emission Computed Tomography
Single photon emission computed tomography (SPECT) imaging is the most widely used imaging modality in nuclear medicine due to the availability of on-site generators to produce the required radionuclides. Gamma-emitting radionuclides such as 99mTc (t
1/2 = 6
hrs), 111In (t1/2 = 2.8 days) and 123I (t1/2 = 13.2 hrs) are employed for this modality. Their
decay energies, which range from 100 to 300 keV, are optimal for tissue penetration, while being relatively innocuous to the subject.28 These isotopes are typically produced in an
on-site generator or by a cyclotron. SPECT radioisotopes tend to be longer lived than PET radioisotopes, with half-lives ranging from 6 hours to 3 days.9 This is sufficient time for
imaging. The longer half-lives of SPECT isotopes also provide the opportunity for imaging over longer periods of time.
Gamma-emitting isotopes produce gamma-rays unidirectionally, requiring the detector (a gamma camera) to be rotated around the subject, collecting images from multiple angles for 3D reconstruction. Signal attenuation is a common problem in SPECT, as collimators are required to exclude gamma rays that have been scattered. This results in lower sensitivity than PET, and makes quantitative information nearly impossible to gather.29,30
Despite these shortcomings, SPECT imaging is an integral technique in nuclear medicine due to its wide availability, and relatively low cost.
1.4 Technetium-99m
Technetium-99m is considered a workhorse radionuclide in nuclear medicine. In the late 1990s to early 2000s, it accounted for approximately 80% of radiopharmaceuticals used clinically and 85% of diagnostic nuclear imaging procedures in hospitals.31,32
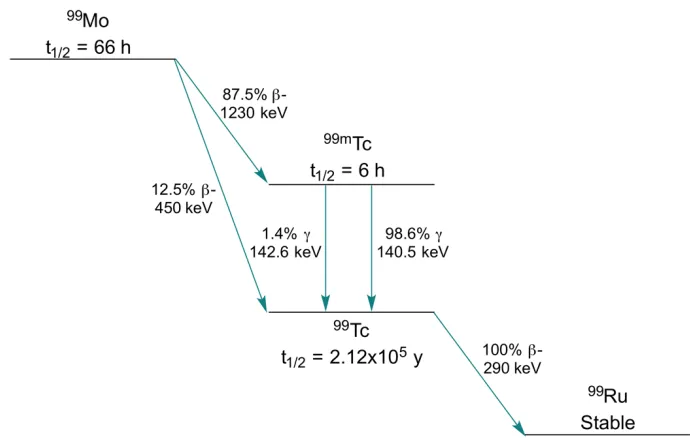
Technetium-99m emits gamma rays with a decay energy of 140 keV, which is considered optimal for imaging with gamma cameras, and has a half-life of 6 hours. This half-life is long enough for preparation and administration of the imaging agent, while minimizing the absorbed radiation dose. Technetium-99m is typically produced by radioactive decay of molybdenum-99 in a generator system.33,34 In recent years, cyclotron production of
technetium-99m has been explored as an alternative.35 From the more common generator
system, molybdenum-99 decays by b- decay (t1/2 = 66 h) to technetium-99m. This
metastable nuclear isomer decays to the ground state technetium-99 predominantly by emission of a 140 keV gamma ray. Technetium-99 subsequently decays with an exceptionally long half-life of 2.12 x 10⁵ years to the stable ruthenium-99 by b- decay
(Figure 1.5).
The technetium-99m is eluted from a 99Mo/99mTc generator in the form of sodium
pertechnetate ([99mTc]NaTcO
4), where the technetium is in the synthetically inaccessible
though for medical applications the +1, +3 and +5 oxidation states are used most commonly.36
Figure 1.5: Radioactive decay scheme of 99Mo to the stable isotope 99Ru.
Technetium-99m radiopharmaceuticals can be classified into two categories: “99m
Tc-essential” and “99mTc-tagged” radiopharmaceuticals. In the former, the technetium-99m is
an integral component of the radiopharmaceutical. Neither the technetium-99m nor the ligand on its own can reach the target of interest, only after metal coordination to the ligand does the agent have the desired pharmacological properties. Perfusion agents such as [99mTc]Tc-MAG337 and [99mTc]-Sestamibi38 are classical examples of “99mTc-essential”
radiopharmaceuticals (Figure 1.6, Top). 99mTc-labelled molecular imaging probes labelled
through the integrated method may be considered as “99mTc-essential” as well.
“99mTc-tagged” radiopharmaceuticals are in the same vein as pendant labelled molecular
imaging probes, where a bifunctional chelator is conjugated to a targeting entity that guides the radioisotope to the molecular target of interest. [99mTc]Tc-HYNIC-TOC,14
[99mTc]TROD-AT-139 and [99mTc]Tc(CO)
3(MIP-1404)40 (Figure 1.6, Bottom) are some
notable examples of “99mTc-tagged” radiopharmaceuticals. “99mTc-tagged”
oxidation states due to their ease of labelling and purification, as well as the availability of kit formulations.
Figure 1.6: Examples of “99mTc-essential” and “99mTc-tagged” radiopharmaceuticals.
Many of these complexes however, suffer from low stability in solution and in vivo41,42 or
contain multiple isomeric forms that may differ in their biological activity.43 In the late
1990’s Schubiger et al developed the fac-technetium(I) tricarbonyl core as an alternative.44
fac-[Tc(H2O)3(CO)3]+was produced in a single step from NaTcO4 by reduction with
NaBH4 in aqueous solution under CO atmosphere. Other reagent systems have been
developed that do not require reaction under CO atmosphere and are therefore more suitable for the synthesis of radiopharmaceuticals in a clinical setting.45 fac
-[Tc(H2O)3(CO)3]+ was demonstrated to be stable in aqueous solution at a pH range from 1
substitution with tridentate ligands to form complexes with exceptional stability (>48 hours in serum). This opened the doors for the development of a wide range of methodologies for the incorporation of 99mTc into imaging probes (Figure 1.7).46–50
Figure 1.7: 99mTc(I)-tricarbonyl complexes formed with a wide variety of ligands.
Examples include tridentate ligands such as the amino acid histidine, cyclopentadienyl ligands coordinated in an h3 fashion, and [2+1] systems where a bidentate and monodentate
ligand occupy the 3 coordination sites.
Figure 1.8: Two-component binding of a carbonyl ligand to a metal center.
1.5 Rhenium
As described in the previous section, the chemistry of technetium is vast, with a variety of oxidation states and ligands available. The development of 99mTc-labelled
radiopharmaceuticals can be challenging, as technetium has no stable isotopes. While technetium-99 complexes may be produced on milligram to gram scales to study the macroscopic properties of the technetium-99m complexes, the radioactive nature of the isotope limits its availability and use. A more common approach is to use the non-radioactive rhenium as a surrogate for technetium. As both are group VII elements, they share similar chemical reactivity, and tend to form isostructural complexes with similar physicochemical properties such as size and lipophilicity.51 This allows not only for
structural characterization of the metal complexes by standard spectroscopic methods such as X-ray crystallography and infrared spectroscopy, but also allows for in vitro evaluation of 99mTc radiopharmaceuticals for their ability to bind a molecular target without the use
of radioactive material.Rhenium exists in nature as a mixture of two isotopes, 185Re (37%)
and 187Re (63%). Radioactive isotopes of rhenium 186Re and 188Re undergo b- decay, and
have seen clinical use as radiotherapeutics.52,53
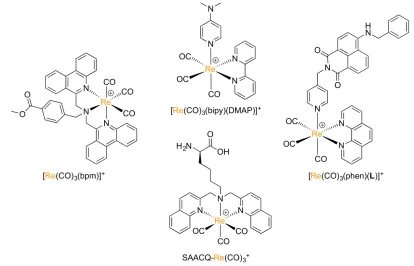
Though rhenium has seen wide use as a surrogate for technetium-99m in the development of radiopharmaceuticals, rhenium complexes are also useful in other aspects. Many Re(I)-tricarbonyl complexes display photoluminescence properties and have been developed as cellular imaging agents for microscopy applications (Figure 1.9).48,49,54–56 While these
(MLCT) electronic transitions, complexation to rhenium has also been shown to modulate the fluorescence properties of fluorophores adjacent to the metal complex.57,58
Luminescent Re(I)-tricarbonyl complexes typically have large Stokes shifts, long luminescent lifetimes, high photostability and high cellular permeability, making them ideal imaging agents for cellular microscopy. They also have the potential to aid in the preclinical development of 99mTc radiopharmaceuticals by allowing the visualization of
tissue uptake and cellular localization of targeted imaging agents without the need for using radioactive isotopes. They may also be helpful in the analysis of ex vivo tissue samples for studying and diagnosing disease.
Figure 1.9: Examples of luminescent Re(I)-tricarbonyl complexes with p-accepting polypyridyl ligands. Suitable ligands include 2,2’-bipyridine, phenanthroline, quinoline and phenanthrodine.
1.6 C-X-C Chemokine Receptor 4
infection into T-lymphocytes.59–63 In addition to T-lymphocytes, it was also shown to be
expressed on B-cells and monocytes.60 The only known natural ligand to CXCR4, stromal
cell-derived factor 1 (SDF-1a, also called CXCL12) has been shown to support the proliferation of B-cells64 and is a strong chemoattractant for lymphocytes and monocytes,
due to the interaction of SDF-1a with CXCR4.65 Together, CXCR4 and SDF-1a also play
a role in the recruitment of T-lymphocytes to sites of infection and inflammation within the body,66,67 hematopoiesis,68 and embryonic development.69 In recent years, there has
been a surge in research on CXCR4/SDF-1a focusing on their role in cancer. CXCR4 is expressed in at least 23 different types of cancer including breast, prostate, lung, colon, glioma and multiple myeloma.70–77 Expression of CXCR4 in cancers has been shown to
promote metastasis,78–81 particularly to sites containing high expression of SDF-1a such as
lymph nodes, bone marrow, lungs and liver.71,82–85 Most healthy tissues contain very low
expression of CXCR4, but in cancerous tissue the expression is greatly enhanced. It may also be noted, that while prostate cancer tissue overexpresses CXCR4, expression remains low in benign prostatic hyperplasia (BPH) and healthy prostate tissue.86 This provides a
diagnostic biomarker that may be used to differentiate healthy and benign tissue from malignant. The roles of CXCR4/SDF-1a in diseases such as cancer and HIV prompted the development of inhibitors as therapeutics and molecular imaging agents for evaluation of CXCR4 expression in vivo.
A turning point in the development of CXCR4 inhibitors occurred upon the discovery of the antimicrobial self-defense peptides tachyplesin I & II and polyphemusin I & II from the hemocytes of the horseshoe crabs Tachypleus tridentatus and Limulus polyphemus.87,88
These peptides are structurally intriguing as they contain 17 or 18 amino acids for tachyplesin and polyphemusin respectively, an amidated C-terminus, and two disulfide bridges stabilizing an anti-parallel b-sheet structure. Not only did these peptides demonstrate antimicrobial activity, but were also shown to inhibit the infectivity of HIV-1 into MT-4 cells.89 Though they were effective at inhibiting HIV-1 infection, they were also
II), which had much greater potency, and reduced cytotoxicity.90,91 It wasn’t until 5 years
after the development of T22 that it was discovered the inhibitory effect on HIV was due to the peptide’s interaction with CXCR4.92 Further efforts to reduce the molecular size of
the peptide while retaining high potency and low cytotoxicity resulted in the peptide TW70, which reduced the size of the peptide to 14 amino acids, and removed one of the disulfide bridges while retaining the b-sheet structure and potency, and reducing cytotoxicity.93 It
was observed that cell membrane permeability and the number of positive charges had a great effect on the selectivity index (SI, ratio of cytotoxicity measure (CC50) to potency
(EC50)), resulting in the peptides T134, and finally T140, which replaced the amidated
C-terminus with a carboxylic acid, and reduced the charge of the molecule to +7, giving the highest SI values thus far.94,95 Figure 1.10 highlights the structural changes made from
polyphemusin II to T140.
Figure 1.10: The development of T140 from polyphemusin II. Black bars indicate disulfide bridges (top bars pertain to polyphemusin II and T22, bottom bar pertains to TW70, T134 and T140), colours indicate structural changes made in the subsequent peptide.
Alanine scans of T140 determined that there were 4 residues that were indispensable to the binding affinity of the peptide to CXCR4: Arg2, Nal3, Tyr5 and Arg14.95 This eventually led
to the development of the cyclic pentapeptide FC131 (cyclo[Nal1-Gly2-D-Tyr3-Arg4
-Arg5]), which retained similar affinity for CXCR4 as T140.96
Small molecule CXCR4 inhibitors have also been developed separately from the peptide inhibitors. It was noticed that molecules containing two cyclam rings (bicyclams) were able to inhibit HIV infection in human T cells with varying potencies, without any noticeable cytotoxic effects.97 It was eventually determined that a p-xylylene spacer linking
AMD3100 or Plerixafor, and it has been shown to inhibit HIV infection through interaction with CXCR4.99 AMD3100 has also seen clinical use as a mobilizer of hematopoietic stem
cells.100 Figure 1.11 depicts the structures of the described CXCR4 inhibitors T140, FC131
and AMD3100.
Figure 1.11: Peptide (T140, FC131) and small molecule (AMD3100) inhibitors of CXCR4.
While CXCR4 inhibitors show great promise as therapeutics for HIV, they have also shown potential as anti-metastatic agents in several cancers.101,102 The ability to target CXCR4 in
cancer has garnered much interest in developing molecular imaging agents containing radioactive and fluorescent tags for evaluation of CXCR4 expression both in tissue samples, and in vivo. As healthy tissue surrounding the diseased site does not express high amounts of CXCR4, the diseased tissue may be specifically targeted by molecular imaging agents. Figure 1.12 depicts the structures of several radiolabelled molecular imaging agents targeting CXCR4. A wide range of T140 derivatives have been developed containing imaging labels. These labels are typically placed on the peptide’s N-terminus, or from the
D-Lys side chain. It has been demonstrated that the turn region lies outside of the CXCR4
binding pocket, making the D-Lys side chain ideal for conjugation of an imaging moiety.103
binding. The first reported PET imaging agent based on the T140 scaffold was [18
F]4-FB-TN14003 (Figure 1.12, Top Right).104 This peptide contains an [18F]4-fluorobenzoyl
([18F]4-FB) group on the N-terminus, which improved CXCR4 affinity for the receptor.
However, addition of the 4-FB group had the unwanted side effect of causing non-specific binding to red blood cells, which made targeting CXCR4 expressing tumors rather challenging in vivo. Inclusion of a non-radioactive, fluorine-19 containing N-terminal 4-FB group in other radiolabelled T140 derivatives showed similarly high blood uptake in in vivo animal models.105 Several other radiolabelled T140 derivatives have mitigated the
problem of binding to blood cells, but often give poor tumor uptake or high accumulation in the liver and kidneys.106–108 Despite the shortcomings of these agents, a 68Ga-labelled
T140 derivative has been tested for imaging of CXCR4 expression in glioma patients.109
This imaging agent showed specific uptake of the tracer in the cancerous tissue, with a much lower background signal in comparison to [18F]FDG. Fluorescently labelled T140
derivatives have been used successfully as an alternative to antibody staining to evaluate CXCR4 expression in Ewing sarcoma110 and high-grade bladder cancer.111
Figure 1.12: PET and SPECT molecular imaging agents targeting CXCR4.
Structure-activity relationship studies on FC131 led to the development of the Pentixafor (previously named CPCR4-2) scaffold (Figure 1.12).112,113 Coordination of Ga(III) to the
expression in a wide variety of cancers, and has great promise as a clinically useful PET imaging agent.15,114,115 Several other derivatives of Pentixafor have been explored in in
vitro models, and also show promise for in vivo imaging as well as radiotherapy.116–119 It
was previously demonstrated that coordination of AMD3100 with metal ions such as Cu(II), Zn(II) and Ni(II) improved the binding affinity of the molecule to CXCR4.120 This
concept has been used in the development of radiolabelled AMD3100 analogues. [64Cu]Cu-AMD3100 was used to successfully differentiate CXCR4-positive tumors in an
in vivo animal model.121,12299mTc-labelled AMD3100, and the derivative AMD3465 have
also shown promise as SPECT imaging agents for imaging of CXCR4 expressing tumors
in vivo.123,124
Targeting of the CXCR4/SDF-1a axis for therapeutic and diagnostic purposes in HIV and cancer is a large and rapidly growing field. Despite all of the work in the field, the need for imaging agents with improved pharmacokinetic and biodistribution profiles is still an area of research that is actively being developed. While radiolabelled agents targeting CXCR4 are being evaluated in humans for PET imaging, there is still a need for imaging agents compatible with SPECT imaging, as well as PET agents with improved pharmacokinetics.
1.7 Biological Roles of Zinc
Zinc is a ubiquitous element in the human body. It is the second most abundant transition metal, second only to iron. Under physiological conditions, zinc is found in the form of Zn(II). While total zinc concentration in cells is in the mM range, free zinc concentrations are tightly regulated. This is achieved through active transport by the zinc transporter (ZnT) and zrt-like, irt-like protein (ZIP) classes of transporters,125 buffering of zinc by
metallothioneins,126 and sequestering of zinc into organelles such as zincosomes.127,128 This
results in free zinc concentrations in the nM range.129
Zinc has a broad range of cellular functions and roles (Figure 1.13). Zn(II) ions function as co-factors for a number of zinc-dependent enzymes.130–132 Enzymes such as carbonic
anhydrase,133 carboxypeptidase A,134 and alkaline phosphatase135 require the Zn(II) ion to
also stored as a hexamer through coordination with Zn(II),137 and metal ions such as Zn(II)
and Cu(II) have been implicated in the formation of amyloid plaques in Alzheimer’s disease.138 Zn(II) signaling plays a key role in neurotransmission,139,140 as well as the
activation and inhibition of transcription factors.141 Disruption of the tightly regulated zinc
homeostasis has been implicated in a number of diseases such as diabetes,142 Alzheimer’s
disease138 and prostate cancer.143 The following section will discuss the role of zinc in the
latter.
Figure 1.13: Biological distribution and functions of zinc. Abbreviations: IAP, inhibitor of apoptosis protein; ROS, reactive oxygen species; ER, endoplasmic reticulum; ZIP, Zrt-like, Irt-like protein; ZnT, zinc transporter.
1.7.1
Zinc in Prostate Cancer
It was documented as early as the 1920s that the human prostate has the highest zinc
this is not entirely clear. It has been noted that prostate epithelial cells have characteristically high aerobic glycolysis, low respiration rates, and high citrate secretion, and it has been proposed that high zinc concentrations are required to maintain these characteristics.145,146 Zinc was shown to inhibit m-aconitase, an enzyme responsible for
citrate oxidation, which may be responsible for the high citrate secretion and low respiration in prostate tissue.147,148 It has also been demonstrated that in malignant prostate
tissue there is a nearly ten-fold reduction in zinc concentration.149 Decreases in cellular
zinc may lead to an increase in cellular respiration favouring growth and differentiation, which may lead to malignancy.150 Zinc has also been shown to regulate apoptosis in
prostate cells.151 Lower levels of zinc can be attributed to an increase in the expression of
ZnT proteins, responsible for zinc export, and a decrease in the expression of ZIP proteins, which are responsible for zinc import.152 Also to be noted, benign hyperplastic prostate
tissue retains the high zinc accumulation observed in healthy prostate tissue.149
Due to the characteristic decrease in zinc concentration in malignant prostate tissue, there has been much clinical interest in zinc as a biomarker for prostate cancer, allowing for the differentiation of malignant prostate tissue from benign and healthy. Evaluation of prostatic zinc levels has mostly been limited to ex vivo analysis of biopsies through a variety of methods.153–155 More recently, the development of molecular imaging agents for in vivo
analysis of prostatic zinc levels has been investigated.156 However, for the pre-clinical
study of zinc as it relates to disease, the development of fluorescent, cell permeable indicators for zinc has been a large area of investigation.157,158 The following section will
discuss the mechanisms behind the function of zinc-sensitive fluorescent probes.
1.7.2
Fluorescent Probes Responsive to Zinc
The detection of zinc by spectroscopic methods can be challenging, as the 3d10 electron
Zn(II) over other metal ions would give a fluorescent probe with a signal unique to the presence of Zn(II).
Fluorescent stains for biological zinc began gaining wide acceptance in the 1980s with histochemical stains based on 8-aminoquinoline such as N-(6-methoxyquinolin-8-yl)-p -toluenesulfonamide (TSQ).159 Further research has focused on improving cellular
permeability160 and shifting excitation and emission wavelengths further into the visible
range (Figure 1.14).161
Figure 1.14: Evolution of zinc responsive fluorescent probes: TSQ, to the more cell membrane permeable ZnAF-R2, and the visible light excitable FluoZin-1, and the cell membrane permeable variant FluoZin-1 AM.
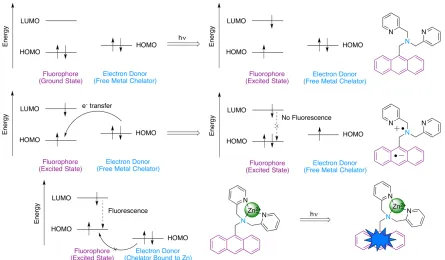
A variety of ligand-centric photophysical processes have been exploited in the development of zinc-responsive fluorescent probes. These include: photoinduced electron transfer (PeT), intramolecular charge transfer (ICT), excited-state intramolecular proton transfer (ESIPT), Förster resonance energy transfer (FRET), and excimer/exciplex formation. In this section, PeT, ICT and ESIPT will be discussed in further detail.
molecular orbitals). Upon promotion of the fluorophore to the excited state, the electron donor may donate an electron into the half-filled HOMO of the fluorophore (a redox process), affording a radical cation/anion pair. This prevents the electron located in the LUMO of the fluorophore from returning to the ground state, effectively quenching fluorescence emission. As PeT applies to Zn(II) indicators, the electron donor is typically a chelating moiety, capable of selectively binding to Zn(II). Chelators containing tertiary amino groups are often employed due to their oxidizable nature. The HOMO of the chelator is of a higher energy than that of the fluorophore, allowing for donation of an electron from the chelator to the fluorophore. In the free ligand state, fluorescence is efficiently quenched (Figure 1.15, Top).
However, coordination of the chelating moiety to Zn(II) lowers the HOMO energy of the electron donor, preventing electron transfer to the excited state fluorophore HOMO. This restores the fluorescence emission pathway (Figure 1.15, Bottom). PeT sensors are therefore “turn-on” sensors. Coordination to Zn(II) typically causes little change in the excitation and emission energies, but an increase in fluorescence quantum yield (ff) is
Figure 1.15: The process of PeT as applied to Zn(II) indicators. Coordination of Zn(II) prevents the metal chelator from acting as an electron donor, increasing fluorescence intensity from the fluorophore.
Figure 1.16: ICT mechanism in non-polar and polar solvents (top), and upon coordination to Zn(II) (bottom).
In the case of the zinc indicator ZnAF-R2 (Figure 1.14, middle) where Zn(II) binds to the electron donor site, the ability of the donor to transfer electron density to the acceptor is reduced and the excited state is destabilized, which hypsochromically shifts the excitation and emission wavelengths. However, coordination of Zn(II) to the acceptor site, as is the case in many 2,2’-bipyridine based zinc indicators, results in a stabilization and a decrease in polarity of the excited state due to the cationic Zn(II) (Figure 1.16, Bottom). As a result, a bathochromic shift in the excitation and emission wavelengths occurs. As the free ligand and the Zn(II) complex will typically display fluorescence, in theory the ratio of the fluorescence emission from the ligand and the Zn(II) complex may be used to determine Zn(II) concentrations. This is usually not done in practice however, as the absorption wavelengths of the free ligands often occur in the UV range, and are not ideal for use in live cells and tissues.
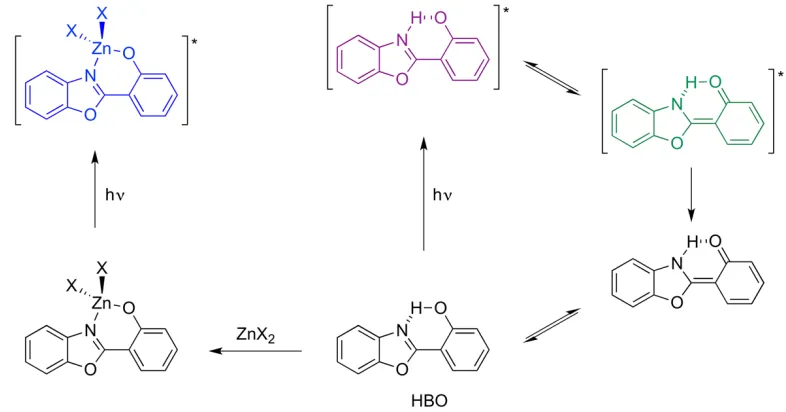
ESIPT occurs in molecules where intramolecular hydrogen bonds are present, and tautomerization is possible.163 Phototautomerization may occur in the excited state of a
become coordinated to a metal ion such as Zn(II), ESIPT is no longer possible (Figure 1.17, Left). The emission energy becomes intermediate between the energies of the phototautomeric forms. As with ICT fluorophores, the ratio between emission from the free ligand and the metal complex may be used to determine Zn(II) concentrations.
Figure 1.17: Process of ESIPT occurring in HBO, and Zn(II) coordination suppressing ESIPT.
While there is certainly a plethora of Zn(II) sensitive fluorescent probes to choose from, there is still plenty of room for advancement in the field. There is still a need to develop sensors with useful ratiometric fluorescence emission, so that the probe may be visualized in the free ligand, and Zn(II) coordinated states, improvement in cellular permeability and cellular localization as well as a lack of toxicity to the target cells or tissues that are being interrogated.164
1.8 Summary
This thesis will document the discovery of new metal chelators for Re/99mTc, new methods
development of a dual modality Re/99mTc imaging probe for fluorescence/SPECT imaging
derived from T140 for the evaluation of CXCR4 expression in cancer cells, with applications to differentiating malignant prostate cells from benign. Chapter 3 contains a study evaluating the fluorescence properties and radiolabelling of Re/99mTc-containing
4-amino-1,8-naphthalimides towards tuning the pharmacokinetic and biodistribution properties of their bioconjugates. Chapter 4 highlights the challenges in developing integrated molecular imaging probes. The development of 3,3’-diamino-2,2’-bipyridine containing peptides as SPECT imaging agents will be discussed. Chapter 5 will discuss the development of amino-substituted 2,2’-bipyridine ligands as intracellular Zn(II)sensors, and their application in differentiating malignant and benign prostate cells by their differences in Zn(II) uptake. Chapter 6 will summarize the findings of the thesis and how they advance the field of molecular imaging as a whole.
1.9 References
(1) James, M. L.; Gambhir, S. S. Physiol. Rev.2012, 92, 897–965.
(2) Meikle, S. R.; Kench, P.; Kassiou, M.; Banati, R. B. Phys. Med. Biol. 2005, 50, R45–R61.
(3) Vladimir P. Torchilin. Handbook of Targeted Delivery of Imaging Agents; CRC: Boca Raton, FL, 1995.
(4) Ogawa, M.; Kosaka, N.; Choyke, P. L.; Kobayashi, H. Cancer Res.2009, 69, 1268–1272.
(5) Schmidt, M. M.; Wittrup, K. D. Mol. Cancer Ther.2009, 8, 2861–2871.
(6) Longmire, M.; Choyke, P. L.; Kobayashi, H. Nanomedicine2008, 3, 703–717.
(7) Wu, A. M. J. Nucl. Med.2008, 50, 2–5.
(8) Schottelius, M.; Wester, H. J. Methods2009, 48, 161–177.
(9) Charron, C. L.; Hickey, J. L.; Nsiama, T. K.; Cruickshank, D. R.; Turnbull, W. L.; Luyt, L. G. Nat. Prod. Rep.2016, 33, 761–800.
(10) Ntziachristos, V. Nat. Methods2010, 7, 603–614.
(11) Lee, S.; Xie, J.; Chen, X. Chem. Rev.2010, 110, 3087–3111.
(13) McKay, C. S.; Finn, M. G. Chem. Biol.2014, 21, 1075–1101.
(14) Decristoforo, C.; Mather, S. J.; Cholewinski, W.; Donnemiller, E.; Riccabona, G.; Moncayo, R. Eur. J. Nucl. Med.2000, 27, 1318–1325.
(15) Herrmann, K.; Lapa, C.; Wester, H. J.; Schottelius, M.; Schiepers, C.; Eberlein, U.; Bluemel, C.; Keller, U.; Knop, S.; Kropf, S.; Schirbel, A.; Buck, A. K.; Lassmann,
M. J. Nucl. Med. 2015, 56, 410–416.
(16) Hickey, J. L.; Simpson, E. J.; Hou, J.; Luyt, L. G. Chem. Eur. J.2015, 21, 568– 578.
(17) Fridkin, G.; Bonasera, T. A.; Litman, P.; Gilon, C. Nucl. Med. Biol.2005, 32, 39– 50.
(18) Barda, Y.; Cohen, N.; Lev, V.; Ben-Aroya, N.; Koch, Y.; Mishani, E.; Fridkin, M.; Gilon, C. Nucl. Med. Biol.2004, 31, 921–933.
(19) Hom, R. K.; Katzenellenbogen, J. A. J. Org. Chem.1997, 62, 6290–6297.
(20) Hom, R. K.; Chi, D. Y.; Katzenellenbogen, J. A. J. Org. Chem. 1996, 61, 2624– 2631.
(21) Chi, D. Y.; O’Neil, J. P.; Anderson, C. J.; Welch, M. J.; Katzenellenbogen, J. A. J.
Med. Chem.1994, 37, 928–937.
(22) Vaidyanathan, G.; Zalutsky, M. R. Nat. Protoc. 2006, 1, 1655–1661.
(23) Szydło, M.; Jadwiński, M.; Chmura, A.; Gorczewski, K.; Sokół, M. Contemp.
Oncol. (Pozn.)2016, 20, 229–236.
(24) Yu, S. Biomed. Imaging Interv. J.2006, 2.
(25) Pourghiasian, M.; Liu, Z.; Pan, J.; Zhang, Z.; Colpo, N.; Lin, K. S.; Perrin, D. M.; Bénard, F. Bioorganic Med. Chem.2015, 23, 1500–1506.
(26) Jacobson, O.; Zhu, L.; Ma, Y.; Weiss, I. D.; Sun, X.; Niu, G.; Kiesewetter, D. O.; Chen, X. Bioconjug. Chem. 2011, 22, 422–428.
(27) McBride, W. J.; Sharkey, R. M.; Goldenberg, D. M. EJNMMI Res.2013, 3, 36.
(28) Dimitris, M. Nuclear Medicine Physics: The Basics. 7th ed.; Lippincott Williams and Wilkins: Philadelphia, 2012; Vol. 39.
(29) Rahmim, A.; Zaidi, H. Nucl. Med. Commun.2008, 29, 193–207.
(30) Blake, P.; Johnson, B.; VanMeter, J. W. J. Neuroophthalmol.2003, 23, 34–41.
(32) Jurisson, S. S.; Lydon, J. D. Chem. Rev. 1999, 99, 2205–2218.
(33) Molinski, V. J. Int. J. Appl. Radiat. Isot.1982, 33, 811–819.
(34) Boyd, R. E. Int. J. Appl. Radiat. Isot.1982, 33, 801–809.
(35) Benard, F.; Buckley, K. R.; Ruth, T. J.; Zeisler, S. K.; Klug, J.; Hanemaayer, V.; Vuckovic, M.; Hou, X.; Celler, A.; Appiah, J. P.; Valliant, J.; Kovacs, M. S.; Schaffer, P. J. Nucl. Med.2014, 55, 1017–1022.
(36) Mease, R. C.; Lambert, C. Semin. Nucl. Med.2001, 31, 278–285.
(37) Fritzberg, A. R.; Kasina, S.; Eshima, D.; Johnson, D. L. J. Nucl. Med.1986, 27, 111–116.
(38) Prats, E.; Aisa, F.; Abós, M. D.; Villavieja, L.; García-López, F.; Asenjo, M. J.; Razola, P.; Banzo, J. J. Nucl. Med.1999, 40, 296–301.
(39) Kung, H. F.; Kung, M. P.; Wey, S. P.; Lin, K. J.; Yen, T. C. Nucl. Med. Biol.2007,
34, 787–789.
(40) Schmidkonz, C.; Cordes, M.; Beck, M.; Goetz, T. I.; Schmidt, D.; Prante, O.; Bäuerle, T.; Uder, M.; Wullich, B.; Goebell, P.; Kuwert, T.; Ritt, P. Clin. Nucl. Med.2018, 43, 1.
(41) Syhre, R.; Seifert, S.; Spies, H.; Gupta, A.; Johannsen, B. Eur. J. Nucl. Med. Mol.
Imaging1998, 25, 793–796.
(42) Edwards, D. S.; Liu, S.; Barrett, J. A.; Harris, A. R.; Looby, R. J.; Ziegler, M. C.; Heminway, S. J.; Carroll, T. R. Bioconjug. Chem.1997, 8, 146–154.
(43) Liu, S.; Edwards, D. S.; Looby, R. J.; Harris, A. R.; Poirier, M. J.; Barrett, J. A.; Heminway, S. J.; Carroll, T. R. Bioconjug. Chem.1996, 7, 63–71.
(44) Alberto, R.; Schibli, R.; Egli, A.; Schubiger, A. P.; Abram, U.; Kaden, T. A. J. Am.
Chem. Soc.1998, 120, 7987–7988.
(45) Alberto, R.; Ortner, K.; Wheatley, N.; Schibli, R.; Schubiger, A. P. J. Am. Chem. Soc. 2001, 123, 3135–3136.
(46) Simpson, E. J.; Hickey, J. L.; Breadner, D.; Luyt, L. G. Dalt. Trans.2012, 41, 2950.
(47) Kluba, C.; Mindt, T. Molecules2013, 18, 3206–3226.
(48) Yazdani, A.; Janzen, N.; Banevicius, L.; Czorny, S.; Valliant, J. F. Inorg. Chem.
2015, 54, 1728–1736.
![Figure 1.2: Examples of molecular imaging probes for PET ([18F]FDG), SPECT ([99mTc]Tc-HYNIC-TOC) and OI (RGD-Cy5.5)](https://thumb-us.123doks.com/thumbv2/123dok_us/1943998.1255717/26.612.138.511.150.465/figure-examples-molecular-imaging-probes-fdg-spect-hynic.webp)