Page 143 www.ijiras.com | Email: [email protected]
Strategic Assets And Performance: The Role Of Research And
Development In Food Processing Firms In Nairobi City County,
Kenya
Justus M. Kyengo Stephen M.A. Muathe
Godfrey M. Kinyua
School of Business, Kenyatta University, Nairobi, Kenya
I. INTRODUCTION
The centrality of performance in enhancing the ability of an organization to realize success in the various strategic objectives areas has made it a domineering theme in management research. As has been noted by Ortega and Maria (2010), business organizations continually seek ways of improving their performance to compete and operate effectively and aggressively in the market. A central premise of the resource-based view of the firm is that competition in an industry is fundamentally linked to access, control and management of an assortment of strategic assets and capabilities (Barney, 2012). According to Leventhal and Wu (2010), distinct performance is easily perceived through
heterogeneity of resources and capabilities possessed by different firms in an industry.
Indeed, the key concern of senior management relates to strategic assets that are fundamental for continued existence and success of firms, and for general economic prosperity in the highly competitive and dynamic global market (Mitrega, 2011). Extant literature is replete with evidence that suggests that corporate resources have potential to enhance the competitive posture of a firm (Gasik, 2011; Rao & Kumar, 2011).
Existing body of management literature associates the ability to optimize firm’s performance with availability of strategic assets particularly for environment characterized with high volatility, heightened competition, short product life cycles and unpredictable factor and product market Abstract: This study examined the effect of research and development as a strategic asset on performance of 102 registered Food Processing Firms based in Nairobi City County in Kenya. The independent and dependent variables in this study were informed by the postulates of the resource based view of the firm. The researcher espoused positivism research philosophy and a mix of explanatory and descriptive research designs as a basis for conducting this quantitative empirical investigation. A sample of 155 respondents comprising of heads of functional areas was randomly selected using multistage probability sampling. Self-administered semi-structured questionnaires were used to collect primary data. Data analysis was conducted using both descriptive and inferential statistics so as to summarize the characteristics of the sample as well as test the research hypotheses. Responses to open ended questions were analysed using content analysis and reported in narrative form. The results of statistical analysis confirmed that research and development capability a positive effect on performance. Therefore, it is important for management of food processing firms to support regarding research and development through commitment of adequate organizational resources to promote utilization of relevant technology for development of new products in line with the changing needs of the market.
Page 144 www.ijiras.com | Email: [email protected] (Anantharaman, 2003). This scenario raises significant policy
and practical implications on the need for management of business enterprises to constantly search for newer sources of competitive advantage through the pursuit of innovative activities at can that can guarantee realization of new services, products and processes, or improvement of existing services, products and processes. Chaffar and Khan (2014) assert that capacity to conduct research and development (R & D) is a critical factor for success of almost each and every firm in the prevailing uncompromising environment. According to Wang, (2012), firms that allocate more funds to R&D should expect to earn more than those that do not since R&D have an effect on the overall performance and so is a mechanism for enhancing performance of the firm.
The performance of a given organization firm in the long run outweigh the costs of investment in research and development. After a period of time equilibrium is attained and the costs of research and development are compensated by the benefits that received. Investment in research and development capability is an imperative for success and survival in an environment that is becoming increasingly competitive as it allows an organization to prevent imitation by its rivals that would lead to above average returns (Donelson & Resutek, 2012). The level of performance any firm is a function of its resources and capabilities, and thus research and development is an essential factor for improving performance. Chan et al.(2011) assert that research and development is an in intangible assets with potential to contribute to the long term growth and performance of an organization. Successful investment in research and development yields innovative products which enables organizations to differentiating its offerings from those of other firms (Ehie & Olibe, 2010).
The concept of measurement of corporate performance has always been a focal point of scholars in the field of management particularly bearing in mind the fact that corporate performance provides a criterion for appraising the organizations’ actions and their environments (Short, McKelvie, Ketchen & Chandler, 2009; Gavrea, Ilieş & Stegerean, 2011; Kinyua, Muathe & Kilika, 2015) that while some past researchers have opted to use either financial indicators or non-financial indicators, others have settled for a blend of financial and non-financial indicators in measurement of firm’s performance. Each stream of researchers has presented a strong case for their choice of indicators for operationalizing and evaluating performance of organizations. On one hand, those using financial indicators have contended that finance is crucial organizational resource that primarily precedes other resources required for pursuing corporate goals and objectives and thus financial performance exists at all levels of an organization (Richard, 2009). On the other hand, the researchers using non-financial indicators are of the view that non-financial metrics are relevant for embracing the present and predicting future operating conditions of a business enterprise (Raymond & St-Pierre, 2005, Kinyua, Muathe & Kilika, 2015). However, in this empirical investigation, an integrated approach for evaluating performance which emphasizes financial and non-financial indicators was adopted where performance of food processing firms was measured using profitability, market share and
customer retention. This position was considered by the researcher so as to leverage on the two distinct set of indicators for evaluating performance as advocated by Kaplan and Norton (2007).
As noted by the Kenya Association of Manufacturers (KAM), food processing firms are a key driver of economic growth in Kenya just as is the case in many economies globally (KAM, 2016). To this effect the Government has favourably responded to the call for implementation of key infrastructures and improvement of general logistics systems and regional market penetration protocols to support this important segment of the manufacturing sector. However, even with the substantial infrastructural support given to the industry, the Kenya National Bureau of Statistics (KNBS) indicates that food processing firms have been experiencing declining performance in the last three years (KNBS, 2016).
Available statistics from KNBS have shown that the industry grew at 3.5% in 2014, 3.2% in 2015 and 3.01% in 2016 (KNBS, 2016). This implies that the proportion of contribution of Food Processing firms to the gross domestic product (GDP) has been reducing over time. As a result, the has been notable closures of some of the food process firms such as Kuguru Foods Complex Limited in July 2015, Pecha Food Limited in July 2016, Stawi Food and Fruits Limited in August 2016 and Maz International Limited in March 2017 (KAM, 017).
The existing body of theoretical and empirical literature demonstrates that research and development capability as a strategic asset has potential to improve organizational efficiency and effectiveness, hence becoming a source of superior performance (Penrose, 1959; Barney, 2007; Filatotchev & Piesse, 2009; Wang, 2011, Ren, Tsai & Eisingerich, 2015). Past researchers (Filatotchev & Piesse; 2009; Ehie & Olibe, 2010; Ren, Tsai & Eisingerich, 2015) have identified research and development capability as a key strategic assets with potential to build competitive advantage and firm performance.
Page 145 www.ijiras.com | Email: [email protected] II. LITERATURE REVIEW
Penrose (1959) posits that superior performance by the firm is realized when it has full control of its resources. Wernerfelt (1984) further assert that the way that the organization manages its essential assets and resources affects its overall performance. RBV underscores resources and capability attributes which serve to refine the firm's performance, diversity and longevity (Morheney & Pandian, 1992). The theory of RBV presupposes that people are motivated to utilize economic resources available to the maximum possible and the general economic framework informs the logical choices that a firm makes (Barney, 2007). In a study of the mobile phone industries in Kenya, it was found that RBV theory played a role in evaluating and justifying resources and the capability of the firm. These had the capability to create and maintain the firm’s competitive advantage in the sector (Sheehan & Toss, 2007).
There are three main compositions of resources as presented by Barney and Hesterly (2010) as capabilities, competences and resources. Resources as defined in strategic management literature are the stocks of accessible items that the firm possesses. Competencies are the unique strong points that enable the firm to distinguish its deliverables’ quality through technological systems that are built to respond to the needs of the customer. They empower and equip the firm to compete with its rivals in the marketplace. RBV has been found to contribute in strategic management due to the prominence on firm-specific resources, which are perceived as key contributors of the firm’s competitive advantage and exemplary performance (Mckelvie & Davidsson, 2009; Levesque, 2010; Anderson, 2011).
Mckelvie and Davidsson (2009) contribute that multifaceted skills acquired from knowledge, ability and experience that empowers the company’s management and utilization of resources for performance by mobilizing and setting resources in their rightful and most effective use in the formal processes is what defines capability. On RBV, Lockett, Thompsons and Morgensrern (2009) share that it illuminates the firm’s resources and specific abilities that are responsible for it highest rates of return and elevated performance benefits. The theory of RBV adds to the ways of helping firm managers to check if elements contributing to positive performance exist or not. Locket, Thompson and Morgenstern (2009) affirm that Resource Based View theory helps to bring to the fore elements that contribute towards positive performance of a firm. This empowers managers to exploit deficiencies in the market to set their firm’s performance at a higher level. Managers are then positioned to be able to bring together resources for sustenance of superior performance.
The propositions of RBV encourage organizational decision makers to select the most critical strategic inputs to acquire and utilize from the industry. Rouse and Daellenbach (2009) and Kenneth at el. (2011) however argue that RBV oversimplifies organizational reality and it tends to assume a linear non-problematic relationship. Further, the theory does not take into account the aspect of environmental factors, which affect firm's performance. For competitive advantage and above average performance, a firm’s resources and capabilities should qualify to be valuable, atypical and not
easily replaced. Barney and Hesterly, (2010) expound that resources that are valuable advances the firms' performance and that rareness creates ideal competition especially where resources in the same category are found in only a few of them would cost too much to duplicate while resources that are said to be non-substitutable have no alternative to accomplishing the same goal or end-product amongst competing firms.
Barney, Wright and Kitchen (2001) maintain that every organization has a varied range of resources that are tangible and intangible. Tangible resources are the visible, material items that an organization possesses such as the structural facilities, raw materials and work equipment. On the other hand, organizational attributes like values, processes, networks and branding that are not included in the typical managerial and/or accounting systems are classified as intangible resources. The authors add that intangible resources are more likely to lead to competitive advantage and good performance than the tangible resources. The propositions of the resource-based view of the firm have been used to anchor both the independent and dependent variables in this study.
EMPIRICAL LITERATURE REVIEW
Wang (2011) observed that the performance of a firm far outweigh the cost of investment in research and development. Indeed, beyond the equilibrium point, the cost incurred by a firm in research and development is compensated by the benefits received. Furthermore, innovative ideas may not have tremendous effects but eventually they have potential as firm specific assets to leverage performance. Research and development capability has emerged as a central and dominant theme in international ventures and internationalization literature and is considered as a strategically significant source of competitive advantage (Filatotchev & Piesse, 2009).
Ren, Tsai and Eisingerich (2015) undertook an empirical investigation of the effect of marketing, research and development capabilities, and degree of internationalization synergistically on innovation performance of small and medium-sized enterprises in China. The results of this study indicated that internationalization has a positive impact on innovation performance when research and development capability or marketing capability is high. Furthermore, the results revealed that the impact of internationalization on innovation performance has a negative result whenever research and development capability or marketing capability is low. In this study, research and development capability was considered as a binary variable manifesting at either low or high level. Similarly, the contextual bias could allow the inferences made to be generalized to food processing firms in Nairobi City County, Kenya.
Page 146 www.ijiras.com | Email: [email protected] Moreover, Ehie and Olibe (2010) conducted an empirical
investigation on the effect of research and development investment on firm value in United State manufacturing and service industries. The study focused on relative contributions of research and development investment to firm value of the 26,500 firms in both manufacturing and service industries and its time scope spanned a period of 18 years. The findings of this study demonstrated that after controlling for firm size and industry concentration, research and development investment positively affects firm value. As may be noted, these empirical studies focused on different aspects of research and development and were carried out in other sectors. Therefore, the findings of these studies could not be generalized to the food processing firms in Nairobi City County, Kenya.
The research hypothesis for this study as;
Ho: Research & Development capability has no effect on
performance of Food processing firms in Nairobi City County Kenya
Research & development capability was operationalized using product patents and new products. Likewise, the indicators of performances of food processing firms consisted of profitability, market share and customer retention.
III. RESEARCH METHODOLOGY
This study adopted positivism research philosophy, which as observed by Mertens (2005) and Creswell (2009), is appropriate for quantitative studies as it is directed at explaining causes that influence outcomes and provides a basis for prediction and generalization.
The study utilized both explanatory and descriptive research designs specifically cross-sectional survey as recommended by Saunders, Lewis and Thornhill (2009). Kerlinger and Lee (2000), Robson (2002), and Saunders et al. (2009) explained that the validity of study findings is increased by combining different research designs since they enable triangulation of results. The study used descriptive research design to collect data from the study subjects in their natural state. Moreover, descriptive research design was used to provide information on the characteristics and/or behavior of the sample with respect to statistical measures deriving from the research variables. The explanatory design established the cause and effect relationship between research and development capability, and performance.
The target population of this study comprised of food processing firms registered by KAM and located in Nairobi City County as shown in Table 1
Category Turnover (Ksh. per annum)
Frequency Percentage
Large At least
750,000,001
36 35.2
Medium 500,000,000 to 750,000,000
33 32.4
Small At most
500,000,000
33 32.4
Total 102 100
Source: KRA (2017) and KAM (2017)
Table 1: Distribution of Target Population
According to KAM (2017), there are 102 food processing firms in Nairobi City County in Kenya. This was made of 36 large firms, 33 medium and 33 Small firms making 35.2%, 32.4% and 32.4% respectively.
The researcher utilized multistage probability sampling method to select the desired sample size for this study. This type of sampling “divides large populations into stages to make the sampling process more practical” (Mugenda & Mugenda, 2003). In this case a combination of stratified or cluster and simple random is used to select the required sample size (Mugenda & Mugenda, 2003, Saunders, Lewis and Thornhill, 2009) as shown in Table 2.
Strata Size of strata
Sampling Ratio
Sample Sampling Factor
Sample Frequency
Percentage
Large 36 0.3 11 5 55 35.6
Medium 33 0.3 10 5 50 32.2
Small 33 0.3 10 5 50 32.2
Total 31 155 100
Source: Author (2017)
Table 2: Distribution of Sample Size
The researcher randomly sampled 30% of the 102 firms; this translated to 31 food-processing firms. However, the unit of observation was the key functional areas in each firm. The key function areas include, Finance, Human resource, marketing, ICT, Operations, internal audit, procurement and supplies, research and development, store. For triangulation purpose as argued by Saunders, Lewis and Thornhill (2009) the research randomly selected the five functional areas considered to have adequate and relevant information related to this study. The 31 firms and the five functional areas translated to 155 respondents that formed the unit of observation.
Primary data was collected for the purpose of this empirical study through a structured questionnaire. The closed-ended questions in the questionnaire were constructed on a 5-point Likert scale that facilitated quantitative analysis of data, testing of the research hypotheses and extracting facts and points for conclusion. The questionnaire was divided into two sections. Section A sought general information about the respondents and consisted of three questions. On the other hand, section B focused on specific information regarding IT capability and performance of food processing firms in Nairobi City County in Kenya. In addition, the researcher gathered secondary data through document review encompassing relevant published sources available from the Kenya Association of Manufacturers including KAM Annual Report.
The tests of validity encompassed face, content and construct validity of the research instrument. The researcher ensured face validity by soliciting opinions from the experts in the field of management. Similarly, content and construct validity were ensured through extensive review of existing body of both theoretical and empirical. This provided the basis for revision of the questionnaire and thus enhancing its validity.
Page 147 www.ijiras.com | Email: [email protected] questionnaire. Cronbach’s Alpha index was computed using
STATA software to assess whether the set of items different variables in the research instrument had a good level of internal consistency. The results of analysis of pilot data for internal consistency are displayed in Table 3.
Research Variable
Number of Items
Cronbach Alpha
Comment
Firm Performance 14 0.914 Reliable
R & D Capability 8 0.904 Reliable
Aggregate Score 22 0.910 Reliable
Source: Survey Data (2017)
Table 3: Results of Reliability Test
Table 3 show the various Cronbach alpha statistics obtained from the analysis of reliability. Notably, the values of Cronbach alpha were 0.914 and 0.904 for performance and research and development capability respectively. It can also be noted from the results of reliability that the aggregate score of Cronbach alpha associated with the twenty items relating to the two research variables was 0.910. Marczyk, DeMatteo and Festinger (2005) and Field (2009) propose a Cronbach's alpha index of not less than 0.70 as an appropriate measure for demonstrating the reliability of a research instrument. Consequently, the research variables had Cronbach’s alpha values that were greater than the recommended threshold of 0.70.
Data collection is an important process for obtaining useful data required for analysis and is subject to empirical research that is guided by theory (Groves et al., 2009). It is the set of information gathered from the targeted units of a study. A research permit was sought from NACOSTI before commencing the data collection exercise. At the food processing firm level, permission was official requested from the firm management to collect data from their managers. The respondents’ consent was requested and their readiness to be part of the study recorded formally as confirmation of their corporation and willingness to participate. The researcher used drop-and-pick method to administer or distribute the questionnaires to each respondent of the study. The investigator was careful to monitor and control this process by ensuring that all issued questionnaires are collected. A register of questionnaires was maintained for this purpose as it provided a clear account of the issued and the duly filled and returned questionnaires, together with the respective dates.
Before processing the responses, the collected data was prepared for a statistical analysis. Validation and checking was done after the questionnaires have been received from the field. The collected responses were checked to ascertain their clearness, relevance to the study objectives, legibility and suitability. Moreover, the questionnaires were edited for completeness and consistency. Coding was done on the basis of the locale of the respondents. Descriptive and inferential statistics were used to analyze collected data that was quantitative; to aid this STATA version 12 software was used. Under descriptive statistics -percentages, frequencies, means, and standard deviations was calculated and presented in figure and table formats. Analysis of inferential statistics involved the use of simple linear regression analysis. However, as pointed out by Verbeek (2008), it is necessary to test the data for conformity with the assumptions of linear regression before conducting inferential statistics. The researcher
therefore conducted diagnostic tests such as - test for sample adequacy, outliers test, normality test, linearity test, homoscedasticity test, multi-collinearity test, and auto-correlation test.
The study was guided by the statistical model presented in model 1
Y = β0 +β1X1 + ε ... 1 Where;
Y = Performance
X1= Research and Development Capability Β0 = Beta coefficient for the constant
β1 = Beta coefficient for the independent variable ε = Error term
The results of regression analysis were tested for statistical significance using a threshold of 95% level of confidence.
The study ensured conformance with ethical research standards throughout the research stages or process. A formal clearance letter from the graduate School of Kenyatta University research committee and prerequisite license from NACOSTI was be obtained. In this study, confidentiality was critical since the information sought is strategic nature to the food processing firms. Hence, permission was obtained from the firms and informed consent of the study participants ensured. These measures enhanced the willingness and objectivity of the respondents. In addition, responses attributed to specific individuals or firm were maintained in strict confidence through use of codes. As recommended by Mugenda and Mugenda (2003) coding helps to uphold confidentiality of the information from individuals in the different food processing firms.
IV. RESEARCH FINDINGS AND DISCUSSION The results of analysis of response rate revealed that 110 dully filled-in questionnaires were received from the field confirming that response and non-response rate were approximately 73 and 37 percent respectively. The successful response rate of 73.3 per cent is well within the acceptable threshold recommended by Mugenda and Mugenda (2008) for facilitating further statistical analysis in order to make generalizations and conclusions. In the views of Mugenda and Mugenda, a response rate of 50.5% is adequate for analysis and reporting; a rate of 60% is good while a response rate of 70% and over is excellent.
A. DESCRIPTIVE STATISTICS
Sample mean and sample standard deviation were utilized by the researcher to arrive at appropriate summary measures for describing the characteristics of the sample. Descriptive statistics was analyzed on the responses obtained from the respondents on the two variables that were at the center of this investigation. The results of this analysis formed the basis for statistical analysis and making of inferences.
Page 148 www.ijiras.com | Email: [email protected] The results of analysis of descriptive statistics for research and
development capability are displayed in Table 4.
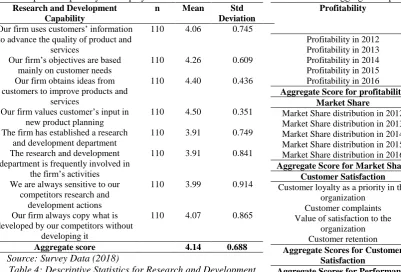
Research and Development Capability
n Mean Std
Deviation Our firm uses customers’ information
to advance the quality of product and services
110 4.06 0.745
Our firm’s objectives are based mainly on customer needs
110 4.26 0.609
Our firm obtains ideas from customers to improve products and
services
110 4.40 0.436
Our firm values customer’s input in new product planning
110 4.50 0.351
The firm has established a research and development department
110 3.91 0.749
The research and development department is frequently involved in
the firm’s activities
110 3.91 0.841
We are always sensitive to our competitors research and
development actions
110 3.99 0.914
Our firm always copy what is developed by our competitors without
developing it
110 4.07 0.865
Aggregate score 4.14 0.688
Source: Survey Data (2018)
Table 4: Descriptive Statistics for Research and Development Capability
The results shown in Table 4.6 demonstrates that the sample mean for individual responses ranged between 3.91 and 4.50 generally approximating to 4.00 on the rating scale adopted for this study. The statistical implication of this reported sample means is that the respondents were in agreement that the set of activities represented by the statements on research and development capability were undertaken in Kenya food processing firms. In addition, the sample standard deviation associated individual responses ranged between 0.351 and 0.914 confirming low variability of responses particularly given that the coefficient of variation with respect to the extreme values of sample standard deviation were 7.8 percent and 22.9 percent respectively. Variability scores on the lower part of the spectrum is a strong indicator that the responses gathered on the eight measures of research and development capability were concentrated around the sample mean.
Furthermore, the aggregate scores of sample mean and sample standard deviation attained from the set of eight responses with respect to research and development capability were 4.14 and 0.688 respectively. As a result, the aggregate coefficient of variation associated with the responses is 16.6% implying that on average the spread of responses around the aggregate sample mean was a narrow and as such it was possible to estimate population from the sample mean. Similarly, the low level of variability depicted that the eight activities collectively used as measures of research and development capability were practiced in food processing firms and were therefore considered crucial to performance.
In addition, the researcher conducted analysis of sample measures using the data on responses to the statement regarding performance of food processing firms. This analysis
yielded sample means and sample standard deviations for individual and aggregate responses as shown in Table 5.
Profitability n Mean Std
Deviat ion
Profitability in 2012 110 3.36 1.11
Profitability in 2013 110 3.34 1.12
Profitability in 2014 110 3.37 1.11
Profitability in 2015 110 3.33 1.10
Profitability in 2016 110 3.40 1.13
Aggregate Score for profitability 3.36 1.11
Market Share
Market Share distribution in 2012 110 4.15 0.730
Market Share distribution in 2013 110 4.27 0.597
Market Share distribution in 2014 110 3.92 0.774
Market Share distribution in 2015 110 4.08 0.890
Market Share distribution in 2016 110 4.00 0.796
Aggregate Score for Market Share 4.08 0.757
Customer Satisfaction Customer loyalty as a priority in the
organization
110 4.13 0.756
Customer complaints 110 4.29 0.646
Value of satisfaction to the organization
110 4.33 0.593
Customer retention 110 4.39 0.436
Aggregate Scores for Customer Satisfaction
4.29 0.608
Aggregate Scores for Performance 3.88 0.842
Source: Survey Data (2018)
Table 5: Descriptive Statistics of Firm Performance
The results displayed in Table 5 showed that the aggregate sample mean and sample standard deviation for profitability food processing firms in the five years that were considered for this survey were 3.36 and 1.11 respectively. The implication of these results is that on average, the respondents were in agreement that food processing firms made profits of between KES11 and KES20 million between the years 2012 and 2016. The results also revealed that the aggregate sample mean and sample standard deviation for market share in the five years under consideration were 4.08 and 0.757. The mean score round off to a score of four on the five point scoring adopted by the study imply that on average the respondents concurred that their firms market share ranged between 51 and 75 per cent of the market in the five years involved in this survey.
Page 149 www.ijiras.com | Email: [email protected] estimator of the true (population) mean. The aggregate scores
also demonstrated that the activities that were used to indicate performance were practiced in food processing firms.
B. TEST OF HYPOTHESIS
Simple linear regression analysis was performed using STATA in order to estimate a statistical model for determining the effect of IT capability on performance of food processing firms in Nairobi City County. To this end, IT capability was regressed on performance. The results of this statistical analysis are reported in Tables 6.
Test Statistic P-value
Adjusted R-squared 0.4762
R-squared 0.4955
F-statistic (1, 105) 25.8 0.000***
Regression results
Coefficients t-statistic P-value
Research and development
Capability 0.160**
3.20 0.002
Constant 0.353*** 1.37 0.173
Key : ** significant at 5 percent and *** significant at 1 percent
Source: Survey Data (2018)
Table 6: Results of Regression Analysis
The output of the regression analysis in respect of the estimated model demonstrated that the value of R-squared was 0.4955 which corresponds to a product moment correlation coefficient of 0.703 implying that there was a strong positive linear relationship between IT capability and performance. Notably, the value of adjusted R-squared which essentially represents the coefficient of determination was 0.4762 percent. Thus, the estimated linear model accounted for 47.62 percent variation in performance of food processing firms in Nairobi City County, Kenya.
Similarly, the output of simple linear analysis relating to the F-statistic showed that the statistical model that was estimated sufficiently fitted the set of data observed from the field. Generally, if the calculated F value in a test is larger than the critical F statistic, the null hypothesis is rejected. Conversely, where the calculated probability is less than the level of significance adopted, the null hypothesis is rejected. The value of F-statistic (1, 105) for the estimated linear model was 25.8 at a level of significance of 0.000 which is less than the p-value of 0.05 that had been chosen as the statistical threshold for inferences at 95% level of confidence. Consequently, the linear regression model that was estimated provides a good fit to the observed data. In this case, the coefficient of determination that indicates the explanatory power of IT capability on performance of food processing firms did not occur by chance and therefore can be attributed to the four dimensions of independent variable chosen for this study.
The results of regression coefficients displayed in Table 6 were used to generate the statistical model below.
Performance = 0.353 + 0.160 Research and Development Capability ……Model 2
Generally, the calculated probability values for the parameters associated with the predicator variable is less than the 0.05 threshold adopted as criterion for testing corresponding hypotheses.
However, it can be noted that the calculated probability value for the parameter associated with y-intercept is greater than the threshold of 0.05. Therefore, in the case that research and development capability is held at a constant zero, performance of food processing firms surveyed would be at 0.353, however, the calculated probability for this parameter is 0.173 which is relatively greater than 0.05 and thus there is no sufficient statistical evidence to reject the null hypothesis that the y-intercept is equivalent to zero.
The study sought to investigate the effect of research and development capability on performance of Food Processing Firms in Nairobi City County, Kenya. The null hypothesis that was formulated to match this objective proposed that research and development capability has no significant effect on performance of Food Processing firms in Nairobi City County, Kenya. The beta coefficient for marketing capability was 0.160, with a t-statistic of 3.20 and a corresponding value of calculated probability of 0.002. As may be noted, the value of the calculated probability was relatively smaller than 0.05 that signified the threshold chosen for testing the null hypothesis. Moreover, the researcher rejected the null hypothesis confirming that at 95 percent level of confidence, research and development capability has a statistically significant effect on performance.
Furthermore, the value of regression coefficient indicated that in the event that research and development capability is increased by 1 unit, performance of food processing firms increases by 0.160 units and the converse is true. The researcher thus concludes that research and development capability has an effect on performance of Food Processing Firms in Nairobi City County, Kenya. The finding that research and development capability positively affect firm performance is in agreement with those of past researchers who had a similar focus in terms of research variables (Ehie & Olibe, 2010; Ren, Tsai & Eisingerich, 2015). Chao-Hung Wang (2011) explains that after a frim reaches its equilibrium position costs on R&D will be compensated by the benefits received. This conclusion corroborates the arguments of dynamic capabilities theory that organization capabilities approach builds upon innovation in architecture, competence in configuration and combinative capabilities (Newbert, 2008; Bani-hani, 2009). The conclusion with regards to research and development supports the propositions of resource based view that firm-specific resources are key contributors to the firm’s competitive advantage and exemplary performance (Mckelvie & Davidsson, 2009; Levesque, 2010; Anderson, 2011).
Page 150 www.ijiras.com | Email: [email protected] statistical analysis of the observed data regarding the variable
indicated that research and development has a positive effect on performance of food processing firms in Nairobi City County, Kenya.
The results of statistical analysis confirmed that research and development capability has an effect on performance. Therefore the conclusion informed by these statistical results is that research and development capability positively affects performance of food processing firms in Nairobi City County, Kenya.
In this case, it is important for management of food processing firms to support practices and activities regarding research and development through commitment of adequate organizational resources to promote utilization of relevant technology for development of new products in line with the changing needs of the market.
Relevant policies should be formulated to inform practice in food processing firm in respect of activities relating to product patents and new products.
VI. SUGGESTIONS FOR FURTHER RESEARCH The findings and inferences made from this study are delimited to the constructs of research and development capability and performance in the context of food processing firms in Nairobi City County. It is therefore necessary for future researchers to undertake similar or replicative empirical studies in food processing firms in other Counties in Kenya as well as in other organizations and industries in order to validate the findings and conclusions of this study. In addition, future research work should focus on investigating the effect of other strategic assets particularly those that are intangible in nature as well as extends the conceptualization to include moderating and mediating variables such as firm size and firm strategy. Similarly, other factors that may not have been accounted for in the direct relationship as implied by the coefficient of determination may also warrant the attention of future researchers.
REFERENCES
[1] Barney ,J., Wright, M. & Ketchen, D. J. (2001). The RBV of a firm; Ten years after 1991, Journal of Management 27 (6):.625 -641.
[2] Clarke, M., Seng, D., & Whiting, R. H. (2011). Intellectual capital and firm performance in Australia. Journal of Intellectual Capital, 12(4): 505–530.
[3] Frink (2011). An examination of Employee Reactions to perceived corporate citizenship, Journal Of Applied Psychology….
[4] Gavrea, C., Ilieş, L. & Stegerean, R. (2011). Determinants of Organizational Performance: the Case of Romania.
Management and Marketing Challenges for the Knowledge Society, 6(2), 285-300.
[5] Kanibir, H., (2014). 10th International strategic management conference 2014: A Research Article [6] Kenya Association Manufactures of Kenya, (2016).
Quarterly sector Statistics Report 2017. Retrieved 2017, June 16 from www.kam.go.ke.
[7] Krasnikov & Jarachandran (2008). Do market orientation and innovation improve organizational performance An international and comparative review of the effects page 19.
[8] Nkatha, G. (2012). Competitive advantage and performance. Business Journal Africa, 30-50
[9] Pebrianto, A. & Djumhur, S. K. (2013). Influence of Information Technology Capability, Organizational Learning, and Knowledge Management Capability on Organizational Performance: A Study of Banking Branches Company in Southern Kalimantan Province. Information and Knowledge Management, 3(11), 112-120.
[10]Remenyi, D. (2009). Multi-tasking : The uncertain impact of technology on knowledge workers and managers: The Electronic Journal Information Systems Evaluation, 12(1).
[11]Sambomirthy V. , Bharadwaj A. & Grover V. (2003). Shaping agility through digital options : Re-conceptualing the role of information technology in contemporary firms…
[12]Santhanam, R. & Harton, e., (2003). Issues in linking Information Technology capability to Firm performance…….
[13]Teece, D, J., (2007). Explicating dynamic capabilities: the nature and micro foundations of (sustainable) enterprise performance. Strategic Management Journal 28:1319-1350.
[14]Teece, D., & Pisano, G. (1994). The dynamic capabilities of firms: An introduction. IIASA Working Paper. IIASA, Laxenburg, Austria, WP-94-103 Retrieved from http://pure.iiasa.ac.at/4109/
[15]Turulja, L. & Bojgoric, N. (2016). Innovation and Information Technology Capability as Antecedents of Firms’ Success. Interdisciplinary Description of Complex Systems, 14(2), 148-156.
[16]Vicente, M., Antunes, M. J. & Malva, M. (2016). The Impact of Marketing Capabilities, Technological Capabilities and Organizational Innovation on Export Performance. Universidade Europeia. ICEMC 2016, 328-337.
[17]Ward J. & Peppard J. (2002). Strategic planning for information systems ( 3rd Edition)