TABLE OF CONTENTS: Vol. 40, No. 1, January 1987
ARTICLES
Range
Plants2
6
1015 19 23 21 31 35 41 46 38
Wet-dry Cycle Effects on Warm-season Grass Seedling Establishment by G.W. Frasier, J.R. Cox, and D.A. Woolhiser
Plant Water Potential for Shrubs in Argentfna by Daniel V. PeHez and Roberto M. Boo
Yield and Digestibility of Old World Bluestem Grasses as Affected by Cultivu, Plant Part, and Maturity by SM. Dabo, C.M. Taliaferro, S.W. Coleman, F.P. Horn, and P.L. Claypool
Grazing Effects on Water Relations of Caucasian Bluestem by Tony Svejcar and Scott Christiansen
Adaptive Strategies of Desert Grasses in %udf Arabia by U.G. Bokhari, Faisal Alyaeesh, and Mahmud Al-Nori
Relationship of Saltbush Species to Soil Chemical Properties by Harmon S. Hodgkinson
Cs/G Production Shift on Seasonal Burns-Nortbem Mixed Prairie by Allen A. Steuter
Influence of Clipping Frquency on Herbage Yield and Nutrient Content of Tall Wheatgrass by D.J. Undersander and C.H. Naylor
The Woody Vegetation of Eastern Senegal by Alex Dickie, IV; Rex D. Pieper; and James R. Dickey
An Evaluation of Range Condition on One Range Site in the Andes of Central Peru by Bradford P. ,Wilcox, F.C. Bryant, and Victor Belaun Fraga
Recovery of Compacted Soil on Pastures Used for Winter Cattle Feeding by G.R. Stephenson and Anne Veigel
Shrub Litter Production in a Sagebrush-Steppe Ecosystem: Rodent Population Cycles as a Regulating Factor by Robert R. Parmenter, Mark R. Mesch, and James A. MacMahon
Animal Nutrition and Forage Selection 55
60 67 71 76 80 84
Grazing System Infl&nces on Cattle Performance on Mountain Range by Jerry L. Holechek, Timothy J. Berry, and Martin Vavra
Dietary Relationships among Feral Horses, Cattle, and Pronghom in Southeastern Oregon by Michael L. McInnis and Martin Vavra
Livestock and Wildlife Population Distributions in Relation to Aridity and Human Populations in Kenya by Donald G. Peden
Foraging Ecology of Bison in Aspen Boreal Habitats by R.J. Hudson and S. Frank Seasonal Diets of Camels, Cattle, Sheep, and Goats in a Common R8nge in Eastern Africa by Wangoi Migongo-Bake and Richard M. Hansen
Elk, Mule Deer, and Cattle Habitats in Central Arizona by Mark C. Wallace and Paul R. Krausman
Published bimonthly-January, March, May, July September, November
Copyright 1967 by the Society for Range Manage ment
INDIVIDUAL SUBSCRIPTION is by membership in INSTITUTIONAL SUBSCRIPTIONS on a calendar year basis are $56.00 for the United States postpaid and the Society for Range Management.
LIBRARY or other $66.00 for other countries, post- paid. PaymentfromoutsidetheUnitedStatesshould be remitted in US dollars by international money order or draft on a New York bank.
BUSINESS CORRESPONDENCE, concerning sub- scriptions, advertising, reprints, back issues, and related matters, should be addressed to the Manag- ing Editor, 2760 West Fifth Avenue, Denver, Colo. 66204.
EDITORIALCORRESPONDENCE, concerning manu- scripts or other editorial matters, should be addressed to the Editor, 2760 West Fifth Avenue, Denver, Colo. 80204.
INSTRUCTIONS FOR AUTHORS appear on the inside back cover of each issue. A Style Manual is also available from the Society for Range Manage mentat theaboveaddress@$1.25forsinglecopies; $1.00 each for 2 or more.
THE JOURNAL OF RANGE MANAGEMENT (ISSN 0022~409X) is published six times yearly for $56.00 per year by the Society for Range Management, 2760 West Fifth Avenue, Denver, Cola. 60204. SECOND CLASS POSTAGE paid at Denver, Colo. POSTMASTER: Return entire journal wlth addross change-RETURN POSTAGE GUARANTEED-to Society for Range Management, 2780 West Fifth Avenue, Denver, Colo. 80204.
The Journal of Range Management serves as a forum for the presentation and discussion of facts, ideas, and philosophies pertaining to the study, management, and use of range- lands and their several resources. Accord- ingly, all material published herein is signed and reflects the individual views of the authors and is not necessarily an official position of the Society. Manuscripts from any source- nonmembers as well as members-are wel- come and will be given every consideration by the editors. Submissions need not be of a technical nature, but should be germane to the broad field of range management. Editor- ial comment by an individual is also welcome and subject to acceptance by the editor, will be published as a “Viewpoint.”
Ecology
88 Succession 01 Pinyon-Juniper Communities after Mechanical Disturbance in Southcentral New Mexico by M.R. Schott and R.D. Pieper
BOOK REVIEWS
95 A Review of Wildlife Management by James M. Peek; Management of Migratory Shore and Upland Game Birds in North America edited by Glen C. Sanderson; Soil Erosion and Crop Productivity edited by R.F. Follett and B.A. Stewart; Beef Cattle Production: An Integrated Approach by Verl M. Thomas; Bear Attacks: Their Causes and Avoidance by Stephen Herrero
MISCELLANEOUS
2245 49 54 83
Election Results Reviewers
Call for Papers for 1988 Position Announcements Deadline Schedule
Managing Editor PETER V. JACKSON Ill
2760 West Fifth Avenue Denver, Colorado 66204 Edltor
PATRICIA G. SMITH
Society for Range Management 2760 West Fifth Avenue Denver, Colorado 60204 Book Revkw Editor GRANT A. HARRIS
Forestry and Range Management Washington State University Pullman, Washington 991646410 ASSOCIATE EDITORS
E. TOM BARTLETT Dept. of Range Science Colorado State University Fort Collins, Colorado 60523 G. FRED GIFFORD
Dept. of Range Wildlife, and Forestry University of Nevada
Rena, Nev. 69506 THOMAS A. HANLEY
Forestry Sciences Lab. Box 909
Juneau, Alaska 99662 RICHARD H. HART
USDA-ARS 6406 Hildreth Rd. Cheyenne, Wyoming 62009 N. THOMPSON HOBBS
Colorado Div. of Wildlife 317 W. Prospect
Fort Collins, Colorado 60526
W.K. LAUENAOTH JAMES YOUNG
Department of Range Science USDA ARS
Colorado State University Renewable Resource Center Fort Collins, Colorado 60523 Rena, Nevada 69512
LYMAN MCDONALD Statistics Department
College of Commerce and Industry University of Wyoming
Laramie, Wyoming 62071 HOWARD MORTON
2~ggg E. Allen Road Tucson, Arizona 65719 ROBERT MURRAY
US Sheep Experiment Station Dubois, Idaho 63423 DARRELL UECKERT
Texas Agricultural Experiment Station 7667 N. Highway 67
San Angelo, Texas 76901 LARRY M. WHITE
USDA ARS
S. Plains Range Research Station 26C~ll6th St.
Wet-dry Cycle Effects on Warm-season Grass Seedling
Establishment
G.W. FRASIER, J.R. COX, AND D.A. WOOLHISER AbstrrrCt
A series of 14d8y field experiments were conducted to evahtatt seedling estrblishment ch8r8cteristics of Bou&ka, ErogrostLr, md Punicum grass specks with controlled wet-dry w8tering com- binations. The objective of the study ~8s to vrlid8te previously published greenhouse d8tr of Frrsier et 8l. (1985) on the effects of the first wet-dry wnitering sequence followhtg pl8nting on seedling emergence urd surviv8i. &ding surviv8i numbers were different between the field 8nd greenhouse experiments but the s8me genenl responses to w8tering sequences were measured. With short wet periods (2 drys), seeds gener8lly did not germimte but survived the subsequent dry period as vi8ble seeds. Most seeds genuin8ted with 5 Wet d8ys urd produced seedlings thit were 8ble to survive drought periods of 5 to 7 d8ys. Fewer seedlings survived with 3 drys wet th8n with either 2 or 5 d8ys wet. High rites of soil moisture ev8pontion in 8 spring fleid experiment mide it difficult to m8int8in adequ8te soil mOi!%turc for seed germin8tion, 8ad seeds which germhmted f&d to produce seedlings. Seedlings were suc- cessfully est8blished in 2 experiments conducted Lter in the summer following the onset of summer rrins, which incre8sed the rel8tive humidity 8nd reduced the nte of soil moisture evrporn- tion. This effect w8s verified in 8 greenhouse study. In both the greenhouse 8nd 5eld experiments, seedlings were est8blished when the reiative humidity exceeded 59% for over one-half of the time during the initirl wet-dry period.
Key Words: Erogrostii sp., Panhun rmlfddalc, Bouteha curti- pad&, drought tolennce, plant survival, seeding
The development of improved techniques for plant establish- ment under rainfed conditions in semiarid regions requires an understanding of seed germination and seedling responses to water quantity and frequency following planting. Cox and Jordan (1983) found that the amount and distribution of precipitation during the first growing season affected plant densities and forage production
10 years later.
There are several intervals during plant establishment when water availability is critical to seedling establishment. Wilson and Briske (1979) found that blue grama (Boutelouugracilis (Willd. ex. H.B.K.) Lag. ex. Griffiths) requires 2 to 4 days of moist soil conditions for seed germination and initial root growth. A similar wet period, 2 to 8 weeks later, was necessary to ensure plant establishment. In a greenhouse study, Frasier et al. (1985) identi- fied 2 factors that affected the survival of warm-season grass seedlings during the first wet-dry watering sequence following planting. They are: (1) the number of seedlings which developed sufficient vigor in the wet period to survive the subsequent dry period: and (2) the number of ungerminated but viable seeds which remain after the initial wet and dry periods following planting. Frasier et al. (1984) showed how seedling emergence and seedling survival probabilities, evaluated under various wet-dry watering Authors are research hydraulic engineer, range scientist, and rcscarch hydraulic engineer, Aridland Watershed Management Research Unit, USDA-AR& 2000 East Allen Road, Tucson, A&. 85719.
This paper was presented in part at the 1984 Annual Meeting, Society for Range Management, Rapid City, S. Dak., 15-16 February 1984 under the title “Grass Seedling Emergence Characteristics as Affected by Precipitation Gccurrcnces.”
Seeds for the study were furnished by the U.S. Department of Agriculture, Soil Conservation Service, Plant Materials Center, Tucson, Ariz., and Rancho Expcri- mental La Compana, SARAH, INIP, Chihuahua? Mexico.
Authors wish to thank John Griggs, physical science technician, and Randi Pcrcz, student research apprentice, for their diligence and assistance in collecting the data.
Manuscript accepted 26 June 1986.
2
sequences, could be combined with estimates of the joint probabili- ties of the lengths of the first wet and dry periods after planting to select the optimum time for seeding in a specific area, or identifying plant species which are best suited for a given climatic regime.
The objectives of the study were: (1) determine the effects of selected combinations and lengths of initial wet-dry watering sequences on the germination, emergence, and survival of 5 grasses in the field; and (2) determine if seedling establishment and survival responses to the initial watering sequences were qualitatively the same in the field as those observed in previously reported green- house studies (Frasier et al. 1984, Frasier et al. 1985). Following completion of the field study, a greenhouse study was conducted to evaluate the effect of air humidity on initial seedling establishment.
Materials and Methods Field Study
Site Reparation
The field experiments were conducted on a Sonoita tine-loamy mixed thermic, Typic Haplargid soil (Gelderman 1970) at an eleva- tion of 1,330 m (MSL) on the Walnut Gulch Experiment Watershed near Tombstone, Ariz. A IO X 50-m area was cleared of all vegeta- tion, smoothed with a road grader, and the top 12 cm of soil loosed with a rototiller. The entire area was covered with black polyethy- lene sheeting and methyl bromide injected under the sheeting for 48 hr to kill any plant propagules remaining in the soil surface. Plot Inst8lktion 8nd Seeding
The study consisted of three, IQ-16day experiments conducted at different times during the summer of 1983. Experiment 1 was initiated on 25 May 1983, experiment 2 on 22 July 1983 and experiment 3 on 15 August 1983. There were IMplots, 30.5 X 30.5 cm square with a 5cm high wooden border in each experiment. Plots were grouped 10 cm apart in rows of 5. Rows were spaced 1 m apart. The grasses used in the study were ‘Premier’ sideoats grama [Bouteloua curtipendula (Michx.) Torr.], ‘A-68’ Lehmann love- grass (Eragrostis lehmanniana Nees), ‘Catalina’ boer lovegrass (E. curvula var. confertu (Schrad.) Nees), ‘Cochise’ lovegrass (E. leh- munniana Nees X E. trichophoru Coss & Dur.), and ‘SDT’ blue panicgrass (Panicurn antidotule Retz). Each grass species was ran- domly located in each row.
All plots were wetted with 3 mm of water and the surface smoothed. One hundred small depressions, 0.6 cm deep and 2.5 cm apart on a 10 X 10 grid, were made on each plot surface with an impression plate. Each plot was seeded with 100 seeds, one seed in each depression, with a vacuum chamber seed planter (Frasier
1985) and covered with a 2- to 3-mm layer of soil. W8ter Sequences 8nd Applicrtion
The watering sequences consisted of: (1) an initial wet period, (2) a dry period, and (3)a final wet period. Three separate wet-dry-wet watering sequences and an everyday wet sequence were used simul- taneously in each experiment (Table 1). Ten to 12 mm of water were applied immediately following seeding which wetted the soil to a depth of approximately 10 cm. A single fan-shaped deflector nozzle on a reciprocating spray bar sprayed water downward onto a single row from a height of 25 cm. The nozzle applied 0.8 mm of water per pass. All plots in a row received the same water quantity and distribution. In Experiment 1, the quantity of water applied on each subsequent day was determined by gravimetric measurement of the water lost from 4 small plastic cones (3.8cm D. by 20cm
Table 1. Wet-dry-wet watering sequences used In tbe three field cx- perimeats.
Experiment Water sequence
No. identification Wet
Period
DN Wet
land2 2-5 3-5 5-5 14-O 3 2-7
3-l 5-l 16-O
(days)
2 3 5 14 2 3 5 16
‘d”r”’ (days)
7 : 4 6 0
7 7 7 6 I 4 0
long) filled with soil and buried level with the soil surface between the plots. In Experiments 2 and 3 the daily water application quantity was equal to a Standard Class A evaporation pan, next to the plots, loss that had occurred during the previous 24 hours. On the first day following the dry period the plots received 12-14 mm of water to insure adequate soil moisture below the depth of the rooting zone.
Soil water contents were measured in depth increments of O-5 mm, S-10 mm, lo-30 mm, and 30-60 mm by gravimetric sampling on separate unplanted plots, 1 plot for each watering sequence. Prior to water application, soil samples from 3 random locations within each plot were collected and combined into a single compos- ite sample for each depth increment for each watering sequence.
A moveable translucent corrugated fiberglass roof was used to prevent wetting of the plots by rainfall. The roof was pulled over the plots at sunset or when a rainfall event was imminent and removed at sunrise the next morning or after the rainfall stopped. Air temperature and humidity were recorded at ground level with a hygrothermograph.
Data Collection and Analysis
Seedlings were counted daily at 0600 hours. A grid template was used to pinpoint the location of the planted seeds (Frasier 1985). Any visible sign of a plant was recorded as a seedling. Seedling counts were normaliz:d relative to pure live seed (PLS) using IO-day filter paper and germination percentages determined in a constant temperature incubator at 29.Y C and 100% relative humidity.
The experimental design was a randomized block with 6 replica- tions, 4 watering sequences, and 5 species. Five plots were aligned into a single row. Four rows were grouped into a block. Results of separate experiments were not directly compared because of dif- ferent climatic conditions. Seedling count means for each experi- ment and each data set period were subjected to analyses of var- iance. When “F” values were significant, (KO.OS), Duncan’s new multiple range test was used to determine differences among spe- cies and water sequences.
Greenhouse Study
The study was conducted in 2 separate greenhouses using the procedure reported by Frasier et al. (1984). The grass species were the same as used in the field study. Tapered plastic cones, 3.8 cm in diameter by 20 cm long, were filled with 210 g of dry 60-mesh silica sand. Ten seeds were placed on the dry surface of each cone and covered with a 2- to 3-mm layer of dry sand. Ten cones were prepared for each grass species per watering treatment for each greenhouse.
Watering sequences used in the study were the same as in field Experiments 1 and 2 (Table 1). Water was applied to the cones with an overhead reciprocating spray system. Ten percent of the total number of cones in an experiment were randomly selected and marked for daily weighing to determine evapotranspiration losses and verify the quantity of applied water. All cones were initially wetted to field capacity with 20 g of water (loo/, moisture by
weight). In wet periods, the cones were sprinkled daily with sufti- cient water to bring the average moisture content to the original weight.
One greenhouse (high humidity) was cooled by a standard eva- porative cooler. The other greenhouse (low humidity) had the same ventilation system but without water applied to the evaporative pads. Air movement was provided by an oscillating fan. The cones in the low humidity greenhouse were moved to the high humidity greenhouse for watering. Following the end of the dry period of each watering sequence, the cones were permanently moved to the high humidity greenhouse. Cones in the 160 watering sequence were moved into the high humidity greenhouse on Day 8.
Live plants in each cone were recorded daily. The plant count of 10 cones for each species was averaged for the replication mean. The study consisted of 3 identical experiments conducted during the summer of 1985. No attempt was made to make direct compari- sons of plant counts in the field study to the greenhouse study. Analysis of variance was used to determine differences among species and watering sequences. When “F” values were significant (KO.O5), Duncan’s new multiple range test was used to separate means.
Results and Discussion Field Study
Experiment No. 1
No seedlings emerged in this experiment on any watering sequence. This period of the year was characterized by high air temperatures and low relative humidities which rapidly dried the soil. One hour after sprinkling, the measured soil moisture con- tents in the top 60 mm were 11 to 12% by weight (field capacity). Twenty-three hours later, the soil moisture in the seed zone (O-5mm) was less than 1.5% (approximately -1.5 MPa), (Table 2).
Table 2. Climetic and soil moisture perameters for tbe three field experiments.
Experiment No. Item Units 1 2 3 Length of experiment (days) 14 14 16 Starting date 25 May 22 Jul 15 Aug
Pan Evaporation
Daily (24 Hour) (mm) 13 2.1 9 2.9 9 2.2 Nighttime (1800-0600) (mm) -1 3 1.3 3 0.8 Air temperature
Maximum ::; 35 2.2 35 1.3 35 2.6 Minimum 14 4.4 20 0.9 17 3.0 Humidity
Maximum F; 73 14 100 1 95 5 Minimum 0 30 4 33 10 33 6 Soil Moisture*
O-5 mm (% by weight) 1.2 0.4 7.4 3.9 4.4 1.4 5-10 mm ($ by weight) 1.2 0.4 9.1 2.8 6.1 1.4 IO-30 mm (% by weight) 4.8 0.9 10.4 1.6 7.8 1.9 30-60 mm (% by weight) 5.7 1.9 10.5 1.4 8.1 1.9
Waluc not determined.
2Mean values for the experiment duration from the 14-O watering sequence plot at O@lO each day prior to water application starting with Day 2.
Following the 14day experiment, water was sprayed on the plots with a set of low-pressure lawn-soaker hoses for 4 hours daily for 6 days. A seedling count on Day 6 of this post-experiment watering period showed that less than 50% (PLS) of the seeds had survived the initial wetdry watering sequences.
Experiment No. 2
Seedlings of all species were established with all watering sequences during this mid-summer experiment. This experiment was conducted after the onset of the summer “rainy” season and late afternoon or evening thunderstorms were common. The rela-
tive humidity increased and the evaporative demand on soil mois- ture decreased. These conditions are conducive to seedling estab- lishment, but there were fewer seedlings with the 3 wet-dry water- ing sequences than with the 14-O water sequence (Table 3).
Table 3. Mean seedling coonts(PLS), for tbe initial wet period end Day 14 for fkld experiment No. 2 with 4 watering sequencea @-day dry).
Catalina A-68 SDT Premier Water Cochise Boer Lehmann blue sideoats sequence lovegrass lovegrass lovegrass panicgrass grama
2-5 3-5 5-5
Water Maximum Initial Plant Count Sequence
Means 5.4’ 12.7 6.2 5.3 51.9 16.3 c2 19.2 19.2 32.6 30.8 75.7 35.5 b 35.0 21.3 29.2 50.2 73.2 41.8 b 14-O --- 100.4 30.9 43.3 54.3 87.0 63.2 a Species 40.3 bs 21.0 c 27.8 c 35.2 bc 72.0 a
Means
2-5 71.7 3-5 62.9 5-5 85.5
Day 14 Plant Count
35.9 34.2 33.8 60.8 47.3 ns 33.4 51.8 43.9 75.3 53.5 ns 32.4 36.6 54.3 71.0 56.0 ns 14-O --- 115.0 37.6 49.9 63.2 84.1 69.8 ns Species 83.8 a 34.8 b 43.1 b 48.6 b 72.8 a
mean
‘Mean seedling count of 6 blocks normalized for germination percentage (PLS). *Water sequence means with the same letter are not significantly different (KO.05). ‘Species means with the same letter are not significantly different (KO.05).
Two seedlings count data sets are of major interest for evaluating seedling survival characteristics (Frasier et al. 1985). These are: (1) the maximum number of seedlings from the initial wet period; and (2) the final seedling count at the end of the experiment. The M-day wet treatment does not include a dry period; therefore the maxi- mum seedling count on Day(s) 6-8 were used for the initial period data set (Table 3).
Water treatment and species interactions were not significant for either the initial or Day 14 counting periods (KO.05). Species means in both the initial maximum and the Day 14 counting periods were different (Table 3). In the initial count there were 10 times more sideoats grama seedlings with the 2day wet watering sequence than with the other 4 species. With 5 days wet, there were twice as many sideoats grama seedlings compared to the other species. These differences were not present in the Day 14 count period. There were no changes in the number of sideoats grama seedlings between the 2 counting periods, indicating that the final sideoats grama seedlings were plants that had been established during the first wet period. Conversely, with the SDT blue panic- grass, Catalina lovegrass, and A-68 Lehmann lovegrass, seedling numbers increased approximately 1.5 times and the Cochise love- grass doubled between the initial and Day 14 counting periods. This indicates that the seeds of these 4 species did not germinate in the first wet period but remained viable through the S-day dry period.
Seedling counts on several Cochise lovegrass plots on Day 14 were greater than 100% PLS. Germination percentages at 10 days on filter paper in the constant temperature incubator were: Pre- mier sideoats grama-7370, A-68 Lehmann lovegrass-87%, Cata- lina lovegrass-87%, Cochise lovegrass-40%, and SDT blue panic- grass-81%. The germination percentage and/or germination rate of some of the species were evidently higher in soil than on filter paper.
Mean seedling counts differed among water sequences in the initial count period but not on day 14 (KO.05) (Table 3). The 2 days wet watering treatment initially produced less than 5% as many seedlings as the other water treatments. The exception was
sideoats grama, which had a threefold increase in seedling numbers with the 2 days wet treatment between the 2 counting periods. This indicates that many of the final seedlings of the other 4 species were from seeds that survived the dry period. There were smaller increases in seedling counts between the 2 counting periods with the 3 and 5day wet treatments. The final seedlings with these watering sequences were from plants established in the initial wet period which survived the dry period.
Experiment No. 3
There were no significant interactions of water sequence and species for either the initial maximum period or on Day 14 (X0.05). There were no significant differences in mean seedling counts among species and among watering sequences in both the initial wet and Day 14 periods (Table 4).
Table 4. Mean seedling counts (PLS), for the initial wet period and Day 14 for field experiment No. 3 with 4 watering aequencea (7days dry).
Catalina A-68 SDT Premier Water Cochise Boer Lehmann blue sideoats sequence lovegrass lovegrass lovegrass panicgrass grama
Water Maximum Initial Plant Count Sequence
Means 2-7 0.0’ 0.0 0.2 0.2 36.3 7.3 b2 3-7 1.3 0.4 4.0 1.0 56.2 12.6 b 5-7 66.3 25.0 59.3 40.6 78.7 54.0 a 14-O --- 96.7 39.7 52.0 41.6 81.6 62.3 a Species 41.0 b’ 16.3 d 28.9 c 20.9 c 63.2 a
Means
Dav 14 Plant Count
2-7 97.1 23.0 25.0 12.5 49.4 41.4 b 3-7 39.2 13.1 13.1 6.4 57.6 25.9 c 5-7 67.5 23.6 57.5 38.3 80.3 53.4 b 14-o --- 118.7 43.5 62.3 48.4 87.5 72.0 a Species 80.5 a 25.8 b 39.5 b 26.4 b 68.7 a
Mean
‘Mesn seedling count of 6 blocks normalized for germination preccntage (PLS). 2Water sequence means with the same letter are not significantly different (KO.05). %pecies means with the same letter are not significantly different (KO.05).
Final seedling counts were lower in the wet-dry water sequences compared to the 14day wet treatment, indicating a seed/ seedling mortality during the 7day dry period. Some specific similarities in the results to Experiment 2 were: (1) high initial counts of sideoats grama seedlings which survived the dry period as seedlings; and (2) low initial seedling counts of the other 4 species with 2 and 3day wet watering sequences, and a subsequent increase in seedling count at Day 14 from seeds surviving the dry period. With the exception of sideoats grama, there were fewer surviving seedlings in the Day 14 plant count period with the 3day wet sequence than with the other watering sequences. One possible interpretation, is that the species were vulnerable to an extended dry period if the first wet period initiated germination but there is insufficient mois- ture for subsequent seedling development (Frasier et al. 1984).
Effect of lTme of Year on Seedling Establkhment
Cox et al. (1982) reported that a common recommendation in the southwestern United States is to seed prior to the summer rains. In the same report it was also stated that the success rate of seeding trials in many areas was only 1 in 4. Schreiber and Sutter (1972) showed that the probability of water availability for plant growth in southeastern Arizona, defined as ‘four consecutive days of wet
soil,’ was best from 5 July to 10 Aug. Smith and Schreiber (1973) showed that the peak summer rainfall frequency occurs in the period 15 Jul-15 Aug. This would indicate that soil moisture conditions may be more favorable for plant establishment with later planting dates.
In our later summer studies (Experiments 2 and 3), successful seedling establishment was achieved with the same length of wet periods as used in Experiment 1. While these experiments were not dependent upon natural rainfall, a micro-climate favorable for seedling establishment was created during the “rainy period.‘* This is evidenced in the climatic data collected at the site (Table 2). The maximum air temperatures and minimum relative humidities were similar in all 3 experiments. There were differences in the maxi- mum relative humidity and the length of time during the day that the high relative humidity persisted. In Experiments 2 and 3, the relative humidity exceeded 50% for more than half the time, com- pared to 20% of the time during Experiment 1 (Table 5). The high
Table 5. Percentage of time the relative humidity was greeter then 3046, 50% and 70%, end air temperatures greater then 21° C, 27” C, end 320 C for the three fkld experiments.
Experi- Percent of Time
ment Relative Humidity Air Temperature Number >30% X0% >70% >2 I” C >26“ C >32O C
1 (%&) ‘2 ‘7) (Z) (Z) ‘%8)
2 93 64 39 79 32 11
3 93 58 36 62 31 8
relative humidities with the onset of the summer storms from increased cloud cover during Experiments 2 and 3 contributed to a lower evaporative demand as reflected in the soil moisture mea- surements. The higher soil moisture in the upper soil profile for a longer time was sufficient to stimulate seed germination and aid in seedling establishment.
Greenhouse Study
The everyday wet (14-O) watering sequence was the only sequence which produced any plants in the initial wet period in the low humidity greenhouse (Table 6). Water treatment and species interactions were not significant in the initial plant count for either greenhouse condition (X0.05). In the high humidity greenhouse there were significantly fewer seedlings in the initial wet period with the 2 day wet water sequence. There were differences among
Table 6. Mean seedling counts (PLS), for the in&l wet period for the greeohonr experiment with 4 watering sequenca (S-day dry).
Catalina A-68 SDT Premier
Water Coehise Boer Lehmann blue sideoats sequence lovegrass lovegrass lovegrass panicgrass grams
2-5 3-5 5-5 14-Or Species
Means
2-5 3-5 5-5 14X@ Species
7.7’ 40.3
Water Wet Greenhouse Sequence Means 16.3 58.3 28.7 29.7 28.1 b2 49.0 97.0 48.0 47.7 56.4 a
82.7 79.0 105.7 68.0 55.0 78.1 a
62.3 66.7 111.0 61.3 47.3 69.7 a
---
48.3 b’ 52.8 b 93.0 a 51.5 b 44.9 b
Dry Greenhouse
0.0 00 00 0.0 b 0.0 Fz 0’0 a:0 0.0 b 0.0 0:o 0:o 0.0 0.0 b 5.7 11.0 8.7 9.0 10.7 9.0 a ---
1.4 ns 2.8 ns 2.2 ns 2.3 ns 2.7 ns
species with the A-68 Lehmann lovegrass having approximately twice as many initial seedlings as the other 4 species. There were no differences among species in the low humidity greenhouse.
There were no significant differences in the Day 14 count among species, water sequences or greenhouse condition (X0.05). In the low humidity greenhouse, soil moisture contents of the seeded zone could not be maintained at adequate levels for sufficient time to induce seed germination and seedling emergence, even with 5 consecutive days of morning water application. The data from the hygrothermograph in the low humidity greenhouse shows that the relative humidity was less than 50% for over one-half of the time (Table 7), similar to field Experiment No. 1.
Table 7. Percentage of time tbe relative humidity was greater than 30%, 50% end 7046, and elr temperature greater than 21° C, 2P C, end 32” C for tbe greenhouse experiments.
Greenhouse Condition
Experi- Percent of Time ment Relative Humidity Air Temperature. Number >30% >50% >70%>21°C>260c>320C
Wet 1
(%) (F; ‘?) \z (2) (Y$ 100
2 _I - - - - 3 100 100 93 100 96 25 Dry 1 48 6 0 100 85 39 2 91 46 17 loo 95 58 3 79 36 17 98 66 30 lhlalfunction of hygrotherrnograph
Conclusions
This study reinforces the conclusions of Frasier et al. (1984). If the wet period is very short, most of the seeds will not have time to germinate and will survive the following dry period as viable seeds. In longer wet periods, many seeds will germinate. There may be a critical length of wet period during which a high percentage of seeds will germinate but the seedlings may not be sufficiently developed to withstand a short drought period. In our studies a 3day wet period followed by 7 dry days produced fewer seedlings than either 2 or 5 wet days followed by 7 dry days.
The field and previously reported greenhouse studies (Frasier et al. 1985) did show similar seedling establishment characteristics. Most of the final seedlings of the sideoats grama were from plants which emerged from the first wet period and survived the dry period. Final seedlings of the other 4 species were from ungermi- nated seeds which survived the initial wetdry period. The number of seedlings which died in the field studies was less than reported for the greenhouse studies. The soil at the field site has a finer texture and a higher water holding capacity than the silica sand used in the greenhouse study. The soil at the field site did not dry out as fast as the silica sand in the greenhouse study.
The study indicates that slight changes in climatic conditions at the time of seeding can be a major factor in achieving successful seedling establishment. High air temperatures and low relative humidities in an early summer experiment resulted in a high poten- tial evaporative demand of soil moisture. With short interval watering periods, it was not possible to maintain soil moisture at levels adequate for seedling establishment. Later in the summer, with the onset of the rainy season, the increased relative humidity reduced the evaporative demand, allowing successful seedling establishment.
Literature Cited
‘Mean seedling count (PLS) of 3 replications.2Water sequence means with the same letter are not significantly different (X0.05). ‘Day 7 was used for the initial plant count of the 14-O sequence.
+$&es means with the same letter are not signfieantly different (PCO.05).
Cox, J.R.,H.L.Morton,T.N. Jobnsen, Jr., G.L. Jordan, S.C. Mutin,end
L.C. Fierro. 1982. Vegetation restoration in the Chihuahuan and Sono- ran deserts of North America. USDA-ARS Oakland, California. Agri- cultural Reviews and Manuals. ARM-W-28.
Cox, JR., and G.L. Jordan. 1983. Density and production of seeded range
grassesinsoutheastemArizona(l970-1982). J. RangeManage. 36649-652.
Frasier, G.W. 1985. Technical Note: A precision planter for small plots. J. Range Manage. 38:187-190.
Frasicr, G.W., J.R. Cox, and D.A. Woolhitw. 1985. Seedling survival response of seven grasses to initial wetdry sequences. J. Range Manage. 38:372-377.
Frasfer, G.W., D.A. Woolhiser, and J.R. Cor. 1984. Emergence and see- dling survival of 2 warm-season grasses as influenced by the timing of precipitation: A greenhouse study. J. Range Manage. 37:7-l 1.
Gelderman, F.W. 1970. Soil survey of Walnut Gulch Experimental Watershed, Arizona: A special report. USDA Soil Conserv. Serv. Agr. Res. Serv., Oregon.
Scbreiber, H.A., and N.G. Sutter. 1972. Available soil water: Time- distribution in a warm season rangeland. J. Hydrol. 15:285-300.
Smith, R.E., and HA. Sebreiber. 1973. Point processes of seasonal thun- derstorm rainfall. 1. Distribution of rainfall events. Water Resources Res. 9:871-884.
Plant Water Potential for
DANIEL V. PELAEZ AND ROBERTO M. BbO
Abatiet
Shrubs in Argentina
W8ter reMions of Prosopis fkxuosa, P. cai&n& Condblbkz microphylb, Larrea divaricata, md Chuqubaga &tacea, 5 &rub species of a temperate semiarid region of Argentina were analyzed by periodic measurement of soil water potential, plant water potential, and air humidity. Water potential in all species showed recovery during the night, the values obtained early in the morning being higher (less negative) than those recorded in the afternoon. Plant water potential showed higher correlation with soil water potential than with the other environmental variables considered. Results indicate that these species have the capacity to adjust to summer drought conditions.
Key Words: Con&&a microphy& Larrea divaricata, Chuquiraga efinactq Pfosopis sp., drought tolerance, soil w8ter, plant survivrl
Undesirable shrub invasion is one of the main problems of the semiarid phytogeographic region of Argentina known as the Caldtn District (Cabrera 1976). This territory extends from south- ern San Luis through the center of L.a Pampa to southwest Buenos Aires province. Cow-calf operations are the primary economic activity in this area. Native pastures are the only source of grazing. The high stocking rates practised by traditional management usu- ally tend to deteriorate soil and vegetation (B6o and Pelaez unpub- lished). One thus finds poorly managed pastures where the propor- tion of low value grasses and undesirable shrubs is very high (Cano
1975).
The climate diagram of Rio Colorado (Rio Negro province) 40 km southwest of the study area shows a relative drought period during summer (Fig. 1). Drought may also occur in winter, but with less intensity. These characteristics show that the regional range communities are closely linked to water availability.
Limited water results in stress, thus reducing plant growth either directly or indirectly.
The ecology and physiology of shrubs growing on rangelands are probably influenced more by water relations than by any other group of factors. Periodic water deficits are critical to growth in seasons when other factors such as light and temperature are favorable (Hass and Dodd 1970).
Authors are graduate researcher Centro de Rccursos Naturales Rcnovables de la Zona_Semiirida, and professor and research assistant, Comisi6n de Invcsti~ciones Cicntdicas and Departamcnto de Agronomia, respectively. Universidad Naclonaldel SW, 8000 Bahia Bianca, Argentina.
The authors gratefully acknowledge Dr. Osvaldo A. Femindez of the Centro de Recursos Naturales Renovables de la Zona Semilrida and the Departamento de Agronomla, Univcrsidad National de1 SW, and Mr. David L. Anderson of the Institute Nacionalde Technologla Agropecuaria (1NTA)for their valuable comments on the manuscript.
Manuscript accepted 6 March 1986.
6
7.q . , . . , . , , , . .
-‘la6
J A S 0 N D J F M A M J188
- Precipitation a Dry seasan ---- Temperature UllIl Wet sasan
Fig. 1. Climate diagram of Rio Colorado (390 01’s ht. and 610 051~ long.), Rio Negro province.
This study was undertaken in order to assess the seasonal plant water potential relationships of 5 of the most conspicuous shrubs of the Cald6n District and to relate these measurements to several environmental factors. Water relation values can give some indica- tion of how adaptable these shrubs are to a semiarid environment.
De!scription of the Study Area
The site where the study was carried out is located in southeast La Pampa province (38O 45’S lat. and 6O 45’W long.). The sampling site is a 20-ha area closed to grazing 12 years ago. The characteristic vegetation of this site is an open shrub stand including jarilla (Lurrea divaricata), caldin (Prosopis caldenia), algarrobo (P.flex- uosa), and piquillin (Condalia microphylla). The most prominent grasses are flechilla negra (Prptochaetium napostaense) and fle- chilla fina (Stipa tenuis), both high forage value cool-season grasses. The climax community has totally disappeared and thus valuable species such as pasto de vaca (Sorghastrumpellitum). poa (Poa ligularis), and flechilla grande (Stipa clarazii) are very scarce or nonexistent (INTA et al. 1980).
Yearly average temperature is 15.3” C. The mean temperature of the coldest month (June) is 7’ C, with a maximum mean of 13.8O C and a minimum mean of 2“ C. The warmest month is January with a mean of 23.6’ C, a maximum mean of 32.2” C, and a minimum
t
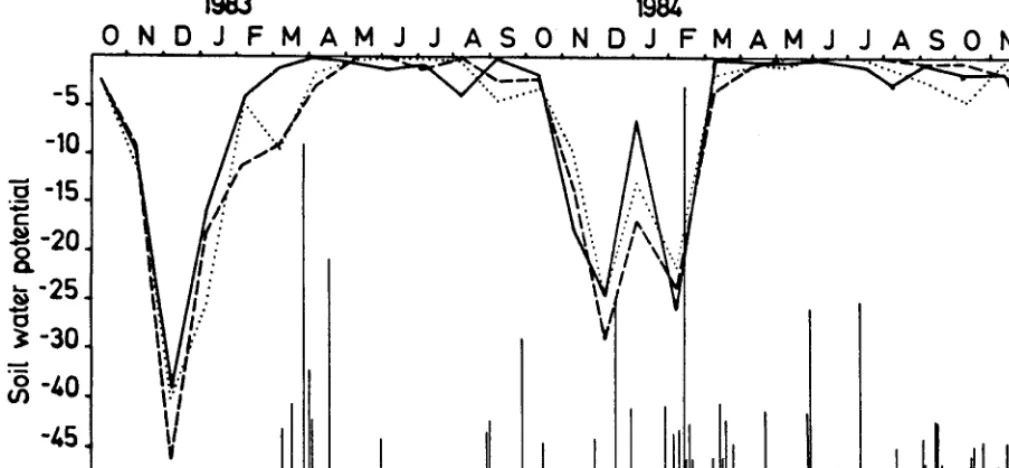
Fig. 2. Evolution of soil water potential (bars) at 30 ( -), SO (---), and 70 cm +) depth, and daily distribution of rainfall (mm) during the measurement cycle.
mean of 14.8’ C. For a period between the years 1941 and 1960 the absolute maximum temperature recorded was 42.7O C and the absolute minimum -11.8O C.
The relative mean humidity varied from maximum mean values in winter (June 76%) to minimum mean values in summer (January 47%).
with the following environmental variables: minimum soil-moisture stress (maximum soil water potential), soil water potential at 30, 50, and 70 cm depth, vapor pressure deficit, and maximum soil and air temperatures.
Results
Between the years 1971 and 1982 the average rainfall was 448mm, concentrated mostly in fall and spring. Average potential evapotranspiration was over 800 mm/year, with a negative water balance all year round.
Precipitation during the study period exceeded the yearly aver- age rainfall of 448 mm (521 mm in 1982,532 mm in 1983, and 632 mm in 1984).
Soil is a typical Paleorthid, well drained, with a medium to heavy texture and a local slope of 0.5 to 1%. A petrocalcic horizon (“tosca’? is found at an average depth of 40-60 cm (Sanchez, personal communication).
The evolution of soil water potential (SWP) and daily distribu- tion of rainfall during the measurement cycle are given in Figure 2.
Materials and Methods
The hydric state of the soil was characterized by the measure- ment of water potential at 30,50, and 70 cm depth. To determine soil water potential, 5 spanner thermocouple psychrometers with ceramic chambers (Dalton and Rawlins 1968, Paster and Sosebee 1974) were located at each depth. Individual calibration of each unit was achieved with sodium chloride (Na Cl) solutions of 0.1, 0.3,0.5, and 0.8 and 1 .O Molal with known water potential (Wiebe et al. 1971). The microvolt output for each was measured with a microvoltimeter. A regression equation was calculated for each thermocouple psychrometer, allowing conversion of the field recorded microvolt readings into water potential values expressed in bars. Soil temperature was also measured.
Water availability decreased with increasing depth. This ten- dency was constant between 30 and 50 cm and between 30 and 70 cm, from October 1982 to April 1983, but became more erratic as of May 1983. Measurements for September and October 1983 and for January and May 1984 then reverted to the former constant trend. The SWP for the 3 levels decreased during spring, reaching its critical value at the end of this season or in the summer. The values of SWP throughout the period oscillated from saturation (0 bar) to a minimum of -41.4 bars recorded at a depth of 50 cm in December 1982.
An important amount of water was stored in the soil due to the high precipitation that occurred January (135 mm), March (130 mm), and April (62 mm) of 1983. As a consequence, high SWP values (greater than -5 bars) were recorded from April to October inclusive. A similar occurrence was observed from April through May 1984.
The dynamics of plant water potential for jarilla, calden, algar- robo, piquillin, and chilladora (Chuquiruga erinacea) was mea- sured by inserting a young branch of each species into a pressure bomb (Scholander et al. 1965). Measurements were made on 3 plants of each species from 9-10 a.m. and from 3-4 p.m. every 30 days during the growing Season (from October until May).
Air temperature and relative humidity were recorded with a hygrometer, and the values were used to calculate vapor pressure deficit.
Plant water potential (plant WP) showed a similar pattern in all species. The afternoon values were lower than those obtained in the morning (Fig. 3 and 4). This was coincident with greater values of temperature and vapor pressure deficit (Fig. 5).
Precipitation was measured in the same working area with an automatic registering rain gauge.
The minimum water potential of each species, determined on each sampling date, was correlated (Snedecor and Cochran 1971)
In the first growth cycle studied jarilla exhibited the greatest seasonal fluctuation of morning plant WP, which decreased from -11.2 bars in October to a minimum of 40 bars in December. For the period between 3 p.m. to 4 p.m. the greatest variation was found in algarrobo, whose plant WP oscillated between -35 bars in January and a maximum of -7.3 bars in March. In the 1983-1984 growth cycle, the highest fluctuation was observed in piquillin for the morning determination. Thus, values varied from a minimum of -40 bars in February to a maximum of -8.7 bars in March. With
oNo’~FMAMJJASONO~FMAM
Table 1. Cord&ion coefficient of plant water potential with ‘I measured variables.Species Environmental Variables r minimum soil-moisture stress
vapor pressure deficit
soil water potential at 30 cm .534* (O-0) juina Jarilla soil water potential at 70 cm .479
(-) chi~1~or.
( "..".) piqui11ln soil water potential at 50 cm .476
t-1 l 1sutobo .389
(----) ca1db
maximum air temperature
maximum soil temperature .212 soil water potential at 70 cm .806 l
vapor pressure deficit .800 l
minimum soil-moisture stress .767 * Chilladora maximum air temperature .673 l
soil water potential at 30 cm .665 *
Fig. 3. Plant waterpotential (bars)for theperiod between 9 a.m. to 10 soil water potential at 50 cm .584 *
a.m. maximum soil temperature .344
soil water potential at 30 cm .870 * 0 N O’?F M A M J J A S 0 N O?ii M A.M.
minimum soil-moisture stress .847 * soil water potential at 50 cm .792 l
Piquillin soil water potential at 70 cm .771 *
-5. (w 1 juiua vapor pressure deficit .685 +
( - ) Chlllador~ maximum air temperature .575 l
B -10.
( . . . )
t-1 l vrmba maximum soil temperature .423
E -15. (---. J cald4. soil water potential at 30 cm .753 * s
soil water potential at 70 cm .738 *
-20. minimum soil-moisture stress .724 *
Algarrobo vapor pressure deficit .713 * soil water potential at 50 cm .698 *
maximum air temperature .581 *
maximum soil temperature .490 * soil water potential at 30 cm .384 vapor pressure deficit .343 minimum soil-moisture stress .337 Fig. 4. Plant waterpotential (bars)for theperiod between 3p.m. to 4p.m. Caldkn soil water potential at 70 cm soil water potential at 50 cm .330 .282
&OC
( - ) t”pr.t(V. , . . . . t. LO . . . . l-1 t..wr.t- , P... to . P...
t . 1 “PO , ..a ta 10 . . . . ( . ) m , ,... I. 4 ,...
maximum air temperature maximum soil temperature *Significant at 5% level.
.192 ,185
ONDJFMAMJJASONDJFMAM
Discussion
1983 1981,
Fig. 5. Air temperature c C) and vapor pressure deficit (mm).
recorded values varying from -35.6 bars in February to -7.7 bars in
April, algarrobo exhibited the greatest fluctuation for the after- noon determinations.
The highest plant WP morning values were generally found in caldCn and algarrobo, and the lowest afternoon values in jarilla. This trend remained constant during the first observation cycle and throughout most of second cycle (Fig. 3 and 4).
Afternoon precipitations occurred during January and December 1983, which affected the 3-4 p.m. determinations, causing in- creased plant WP values in chilladora and jarilla.
The lowest water potential of each species for each sampling date was correlated with different environmental variables. The simple linear correlation coefficient (r) of plant WP with 7 measured variables is shown in Table 1. The plant water potential showed a
significant correlation with the analysed soil water potential varia- tions. Even though there was a similar trend for caldin, correlation coefficients were non-significant at fi 0.05. For chilladora 2 parameters were closely related with plant WP: the vapor pressure deficit (r = 0.800) and SWP at 70 cm depth (r = 0.806). The air and soil maximum temperatures were, in general, the worst correlated variables with plant WP (r10.673). The air and soil maximum temperatures are the highest measured on each sampling date for each category.
Several authors have demonstrated that plant water potential undergoes daytime variations, exhibiting a maximum peak at dawn and a minimum at midday or in the first hours of the afternoon. In fact, Branson and Shown (1975) recorded the most critical water potential in big sagebrush (Artembia tridentata)at 4
p.m.. Nielsen et al. (1981) found a similar trend in mesquite (Pro- sopisglandulosa)suggesting that this behavior is related to highest stomata1 conductance, which occurs in morning hours in arid species.
The lowest plant water potential was better correlated with soil water potential in the present study. A close relationship between plant water potential and moisture stress in soil was demonstrated for Acacia aneura (Slatyer 1961) and between the plant moisture stress and soil moisture content for red pine (pinus resinosa) (Sucoff 1972). However, Hass and Dodd (1972) reported the lack of influence of soil moisture upon the minimum and maximum
water potential in mesquite. Branson and Shown (1975) found that minimum soil-moisture stress was the highest correlated variable with water stress in big sagebrush. Nevertheless, the same authors emphasized that when soil moisture is readily available for plants, above all in spring, then it is probably factors other than SWP that determine plant WP.
Maximum soil and air temperatures were poorly correlated with plant WP except in the case of chilladora, where maximum air temperature occupied an intermediate plane. Dina et al. (1973) found a highly significant correlation between these 2 variables and the water potential in shrubs belonging to a mountainous area of Utah (U.S.A.).
Vapor pressure deficit was one of the variables best correlated for chilladora. Hass and Dodd (1972) working with mesquite found highly significant correlations between plant water potential and vapor pressure deficit. However, Dina et al. (1973) detected significant correlations between these 2 parameters only in 1 of the 9 species.
The 5 species under study exhibited a plant WP recovery during the night. The values obtained earlier in the morning, were higher (less negative) than those recorded in afternoon hours. According to Sala et al. (1981) such plant behavior can been seen as an indication of plant response flexibility in the face of water stress- inducing changes. A wide range in plant WP between morning and afternoon values would indicate a high degree of flexibility or a high capacity to return daily to relatively high water potentials. On the other hand, a narrow range between values would reveal situa- tions of intensive stress. Two examples which can be used to illustrate the latter are the December 1982 and February 1984data recordings for jarilla and piquillin. The plant WP values obtained on both dates for these species were of -40 bars in the morning and afternoon hours. The inability of jarilla and piquillin to daily recover their water potential affects the metabolic functions essen- tial to their growth (Kozlowski 1972, Hsiao 1973, Fitter and Hay 1983), implying a higher susceptibility to water stress than the other 3 species studied here.
The water potential range of these shrub species as measured in the morning and afternoon hours suggests a relatively efficient adjustment to the conditions of summer drought. It is hypothe- sized that such behavior patterns facilitate the elimination of com- petition from other species, mainly those of the understory, in periods of long or intensive drought. According to Vallentine (1974) drought may be an important cause of undesirable plant invasions on ranges previously weakened by grazing or other factors.
Minimum plant water potential is better correlated with soil water potential for the different forms. Branson and Shown (1975) suggested that the highly significant correlation of internal plant stress with lowest soil-moisture stress indicates that rapid and
inexpensive plant-stress measurements might be used to estimate minimum soil-moisture stress.
Literature Cited
Bbo,
R.M., and D.V. Peticz. Unpublished. Comunidades vegetales de1 sur de1 Distrito de1 Calden.Branson, F.A., and L.M. Shown. 1975. Soil-moisture stress related to plant-moisture stress in big sagebrush. J. Range Manage. 28:212-215.
Cabrera, A.L. 1976. Regiones fitogeograficas argentinas. Enciclopedia Argentina de Agricultura y Jardineria. Tomo II. Fast. 1. Acme S.A.C.I. Buenos Aires.
Cano, E.A. 1975. Pastizales en la regioin central de la provincia de La Pampa. I.D.I.A. julio-septiembre 1975: l-15.
Dalton, F.N., and S.L. Rawllns. 1968. Design criteria for peltier-effect thermocouple psychrometers. Soil Science 10512-17.
Dina, S.J., L.G. Klikoff, and M.B. Keddington. 1973. Seasonal water potential patterns in the mountain brush zone Utah. Amer. Mid. Natur. 893234239.
Easter, J.S., and R.E. Sosebee. 1974. Use of thermocouple psychrometry in field studies of soil-plant-water relationships. Plant and Soil 40:707-712. Fitter, AH., and R.K.M. Hay. 1983. Environmental physiology of plants.
Academic Press. London.
Hass, R.H., and J.D. Dodd. 1970. Seasonal water stress pattern in honey mesquite. Brush Research in Texas/ 1970~59-62.
Haas, R.H., and J.D. Dogg. 1972 Water-stress patterns in honey mesquite. Ecology 53:674680.
Hsiao, T.C. 1973. Plant responses to water stress. Ann. Rev. Plant Physiol- ogy 24519-570.
Institute Nacionai de Tecnologia Agropecuaria, Prov. de la Pampa, y Univ. Nat. de La Pampa. 1980. Inventaro integrado de 10s recursos naturales de la provincia de La Pampa. ISAG. Buenos Aires.
Koalowsky, T.T. 1972. Wildland shrubs-their biology and utilization. Internat. Symp. Utah State Univ. Logan. July 1971. Intermountain Forest and Range Exp. Sta. 229-244.
Nielsen, E.T., P.W. Rundel, and M.R. SharKi. 1981. Summer water rela- tions-of the desert phreatophyte Prosopis glandulosa in the Sonoran Desert of southern California. Oecoloaia (Berlin) 50~271-276.
Sala, O., A. Soriano, and S. Perelman. l%l: Relaciones hldricas de algu- nos componentes de un pastizal de la depresion del Salado. Rev. Facul- tad de Agronomia 2:1-10.
Ssholander, P.F.,H.T. Hammel, E.D. Bradstreet,and E.A. Hemmingsen.
Sap pressure in vascular plants. Science 148:339-346.
Slatyer, R.O. 1961. Internal water balance of Acacia aneura F. Muell. in relation to environmental conditions. In: Plant-water relationships in arid and semi-arid conditions. Madrid Symp. Proc., Paris. UNESCO:
137-146.
Snedecor, G.W., and W.G. Cuchran. 1971. Mbodos estadfsticos. CECSA Sucoff, E. 1972. Water potential in red pine: soil moisture, evapotranspira-
tion, crown position. Ecology 53:681-686.
Vallentbte, J.F. 1974. Range development and improvements. Brigham Young Univ. Press, Provo.
Wiebe,H.H., G.S. Campbell, W.H. Gardner,S.L. Rawlins, J.W. Cary,and R.W. Brown. 1971. Measurement of plant and soil water status. Bull. 484 Utah Agr. Exp. Sta.
Yield and Digestibility of Old World Bluestem Grasses as
Affected by Cultivar, Plant Part, and Maturity
S. M. DABO, C. M. TALLAFERRO, S. W. COLEMAN, F. P. HORN, AND P. L. CLAYPOOL
AbStlWt
Old World bluestems (Bothriochloa spp.) have been used in the
U.S. for over 60 years but few data are available on effects of management or cuitlvar differences for forage yield and quality. Field experiments were conducted on a Kirkland silt loam (Uderic Paleustoii) soil for 2 years (198E83), in order to asseas the yield and quality of 4 such cultivars as affected by maturation and plant part. The experimental design was a split-split plot, in a random- ized complete block, with 4 replications, 4 cuitivars (‘Caucasian’, ‘Canada’, ‘Plains’, ‘WW Spar’), 10 harvest dates, and 3 piant parts (whole piant, stem, and leaf). Cuitlvarr were main plots; harvest dates and plant parta were sub and sub-sub plots, respectively. Response variables were dry matter yield (DMY), in vitro dry matter disappearance (IVDMD), leaf to stem ratio (L/S), and in vitro digestible dry matter yield (IVDDMY). Canada consistently had the lowest leaf, stem, and whole plant DMY and IVDDMY. Caucasian had higher leaf, stem, and whole plant DMY and IVDDMY than Plains and WW-Spar in 1983, but the DMY and IVDDMY of these cultivars were simile in 1982. Quadratic and linear equations were satisfactorily 5t to the DMY and IVDDMY data in 1982 and 1983, respectively. The IVDMD ln whole piant samples decreased at average rates of 4.2 and 5.5 g kg ha-’ da5y in 1982 and 1983, respectively, during harvest week one. Among cultivars, Caucasian had the highest rate of decline and Ganada the lowest. The decline was quadratic in nature and faster in stem fractions. Cuitivu IVDMD differences were consistent over plant parts. Ganada and Cawasian had the highest and lowest IVDMD concentrations, respectively. Plains and WW-Spar had IVDMD values of slm5ar magnitude and intermediite to those of Ganada and Caucasian. Cuitivar leaf to stem ratios were shnilu in 1982 but different in 1983 with Plains and Caucasian having higher L/S ratios than Ganada and WW-Spar. For these cultivars leafiness was a poor indicator of digestibility.
Key Words: ‘Ganada’, ‘WW-Spar’, ‘Plains’, ‘Caucasian’, plant morphology, dry matter yield, IVDMD, IVDDM, leaf to stem g&O
Old World bluestems (Borhriochlou spp.) are highly apomictic, perennial, warm-season, bunchgrasses of Eurasian origin (Harlan and Chheda 1963, Harlan et al. 1964, and Taiiaferro and Harlan 1973). These grasses are known for their apparent superiority to American forms (Andropogon spp.) with respect to production, quality, persistence under grazing, and ability to respond to high fertility levels. They are also potentially important as erosion con- trol and reclamation grasses for millions of hectares of depleted range and marginal farmlands in the southern Great Plains.
Despite extensive use of Old World bluestems (OWB) by live- stock producers in the southern Great Plains, few data are avail- able on their yield and quality trends, and on leaf and stem contri- butions to these parameters throughout the growing season.
Comparative forage yield tests in Oklahoma have shown ‘Plains’ bluestem [Borhriochloa bchaemum (L.) King. var. ischaemum] to Senior, second, and fifth authors are former research assistant, Department of Agronomy, and professors, Department of Agronomy and Statistics, respectively, Oklahoma State University, Stillwater 74078. Third and fourth authors are research animal scientists, Livestock and Forage Research Laboratory, USDA-ARS, El Reno, Okta. 73936.
The authors wish to thank Dr. D.M. Ahring, research agronomist, USDA-ARS, Plant Science Research Laboratory, Stillwater! Okla., and Dr. R. D. Pieper, Depart- ment of Animal and Range Science, New Mextco State University, for reviewing this manuscript and providing thoughtful suggestions.
Manuscript accepted 7 July 1986.
10
be less productive than ‘Caucasian’bluestem [B. cuucusicu (Trin.) C.E. Hubbard] but equal in persistence (Taliaferro et al. 1972). Dalrymple et al. (1980) reported preliminary yield test results- of commercially available OWB cultivars. The Caucasian and Plains cultivars had the highest yields (about 5,712 kg ha-‘) and ‘Ganada’ [B. ischuemum (L.) Keng. var. ischuemum] the lowest (about 5,176 kg ha-‘).
Taliaferro et al. (1972) found that the in vitro dry matter disap- pearance (IVDMD) of the Plains cultivar was higher than that of Caucasian (49.3 vs. 45.4%). The IVDMD of both cultivars decreased as the growing season advanced. Horn and Taliaferro (1979), studied seasonal changes in IVDMD values of hay from 5 OWB cultivars including Plains and Caucasian. A downward trend in IVDMD occurred as the season progressed though the total decline was not great. The lowest IVDMD values were reached in August.
The nutritional value of forage may be underestimated by ana- lyzing only whole plant samples because livestock seldom consume whole plants, but rather selectively graze individual parts (Kalm- bather 1983). The parts of a plant (inflorescence, leaf blade, leaf sheath, and culm) differ in quality (Kalmbacher 1983). Generally, the nutritive value of leaves is superior to that of stems (Minson et al. 1960, Minson et al. 1964, Terry and Tilley 1964, and Kalm- baeher 1983). In vitro studies by Minson et al. (1960, 1964) with ryegrasses, fescue, timothy and cocksfoot grasses separated into leaf lamina, leaf sheath, stem, inflorescence, and dead material, indicated that digestibility of the leaf lamina fraction decreased 0.10% per day with advancing maturity. Leaf sheaths and stem fractions decreased more rapidly than the lamina with increasing maturity (0.40% and 0.70% per day, respectively). Yet, stem frac- tions were more digestible than leaf fractions in immature stages of growth. Similar results were reported by Mowat. et al. (1965).
The objectives of this study were to: (a) characterize the forage yield and quality differences of whole plant and component plant parts of 4 OWB cultivars as affected by stage of maturity, and (b) ascertain the relationships between yield patterns and IVDMD.
Materials and Methods
This study was conducted in 1982 and 1983 on the Agronomy Research Station, Stillwater, Okla. The soil type was a Kirkland silt loam (Uderic Paleustoll). The field plot design was a split-split plot, in a randomized complete block design with 4 replications. The 4 OWB cultivars were Plains, Caucasian, Ganada, and “WW- Spar’[B. ischuemum (L.) Keng var. ischuemum]. Plots were 6 s .6 m, each consisting of 5 rows spaced I5 cm apart. The test was seeded 28 July 1980.
The nursery was prepared for study by cutting the experimental area to a uniform height (staged) of about 1.00 cm, 22 June 1982 and 25 May 1983. The plots were fertilized with 120 kg N ha-’ soon
after staging. Plots were then divided into ten 0.5 m* subplots. During the experiment, the nursery was irrigated regularly to maintain abundant soil moisture. Prior to harvest, plots were trimmed to eliminate border effects. Harvesting was started 3 weeks after staging; and continued at weekly intervals for 10 weeks. Harvest dates (1 through 10) were randomly assigned to subplots. Plants in subplots were clipped at 1.3 cm from ground level. Subplot total green weight was recorded for yield measurements and 2 subsamples were taken. One subsample was oven dried at 65’ C for 7 days and used to convert subplot green yield weights to dry