ABSTRACT
HONG, KYUNG WHA. Improving Interface Usability through Model Transformation using Interaction Design Models. (Under the direction of Robert St. Amant and Emerson Murphy-Hill.)
Providing easy-to-use user interfaces (UIs) is a central issue in human-computer interaction. Many approaches and theories have been developed to design UIs, measure usability, and analyze human behavior. This dissertation describes a new approach focused on transforming interaction models to generate design recommendations and improve interface usability. The research draws on the areas of
model-based usability
evaluation and model-based user interface generation.
In this dissertation, I first conducted a study that replicates prior work using a model-based evaluation tool (i.e., CogTool) to evaluate a user interface as well as to justify design recommendations. The findings from this study are motivation of my work. I then present a model transformation approach that produces design recommendation that directly lead to design changes for improving usability. This approach is different from a traditional approach in that it automatically traverses the space of possible design alternatives and generates design recommendations as guidance for the designer to improve usability. The goal of this research is a framework to support the model transformation
approach for improving the usability of a design during the iterative user interface development process. On the issue of representation in this approach, I demonstrate the how action graph
formalism can be extended to incorporate multiple interaction models. Additionally, I provide an implemented system reflecting the approach with a state space search algorithm. An empirical study
The contributions of this research are the following:
• Replication of prior study on model-based usability evaluation.
• A model transformation approach validated through empirical findings.
• Demonstration of models in action graphs as a basis for model transformation.
Improving Interface Usability through Model Transformation using Interaction Design Models
by
Kyung Wha Hong
A dissertation submitted to the Graduate Faculty of North Carolina State University
in partial fulfillment of the requirements for the degree of
Doctor of Philosophy Computer Science
Raleigh, North Carolina 2014
APPROVED BY:
_______________________________ ________________________________
Robert St. Amant Emerson Murphy-Hill
Co-chair of Advisory Committee Co-chair of Advisory Committee
________________________________ ________________________________
Christopher Healey James Lester
DEDICATION
To my husband, Jeseung Oh.
BIOGRAPHY
ACKNOWLEDGMENTS
I thoroughly thank my co-advisors, Dr. Robert St. Amant and Dr. Emerson Murphy-Hill for their guidance and encouragement. They both have been great advisors. Dr. Robert St. Amant, who has been my advisor from the beginning of my Ph.D. study, always gave thoughtful advice and insightful comments through my journey and led me to finish this dissertation. Dr. Emerson Murphy-Hill, who co-advised me from 2012, gave inspiring feedbacks to help improve my work. It would not have been possible to finish my dissertation without them. I would also like to thank my committee members, Dr. Christopher Healey, Dr. James Lester, Dr. Benjamin Watson, and Dr. Alexander Dean for their helpful comments to shape my research direction.
I am grateful to my friends in the Knowledge Discovery Lab. This includes Thomas Horton, Arpan Chakraborty, Prairie Rose Goodwin, Pat Cash, Shea McIntee, Sina Bahram, Lihua Hao, and Srinath Ravindran. Discussions and support from them were always exciting and helpful. I would also like to thank my fellow Korean friends at NCSU for their encouragement. I especially thank all members in Nehemiah group at Duraleigh Presbyterian Church for their sharing and prayers.
TABLE OF CONTENTS
LIST OF TABLES ... ix
!
LIST OF FIGURES ... x
!
1
!
INTRODUCTION ... 1!
1.1
!
Background ... 1!
1.2
!
Motivation ... 3!
1.3
!
Challenges ... 5!
1.4
!
Contributions ... 6!
1.5
!
Dissertation Organization ... 8!
2
!
RELATED WORK ... 9!
2.1
!
Model-based User Interface Development ... 9!
2.2
!
Interaction Design Models ... 10!
2.2.1
!
Action Graphs ... 11!
2.2.2
!
Keystroke Level Models ... 13!
2.2.3
!
Fitts’ Law ... 16!
2.2.4
!
Parhi et al.’s Model ... 17!
2.3
!
Model-based Usability Evaluation Tools ... 19!
2.4
!
Automatic Interface Generation ... 19!
2.4.1
!
Model-based Interface Generation ... 19!
2.4.2
!
Interface Generation with Adaptation ... 20!
2.5
!
Tools for Interface Guidelines ... 21!
2.6
!
Discussion ... 21!
3
!
MODELING TECHNIQUES FOR UI RECOMMENDATIONS ... 23!
3.2
!
Experiment ... 24!
3.2.1
!
Participants ... 24!
3.2.2
!
Study 1: Recommendations with CogTool ... 25!
3.2.3
!
Study 2: Recommendations with Other Modeling Techniques ... 27!
3.3
!
Results ... 28!
3.3.1
!
Study 1: Recommendations with CogTool ... 28!
3.3.2
!
Study 2: Comparative Analysis ... 33!
3.4
!
Discussion ... 36!
3.5
!
Limitations ... 37!
4
!
THE MODEL TRANSFORMATION APPROACH ... 39!
4.1
!
Model States ... 41!
4.2
!
Model Transformation Operators ... 47!
4.2.1
!
Add an Edge ... 49!
4.2.2
!
Remove an Edge ... 49!
4.2.3
!
Remove a Vertex ... 49!
4.3
!
Implications for Design Recommendations ... 52!
4.4
!
Discussion ... 52!
5
!
A MODEL TRANSFORMATION SYSTEM ... 55!
5.1
!
UI representation ... 55!
5.1.1
!
Design Components Model ... 57!
5.1.2
!
Action Graphs ... 58!
5.1.3
!
Keystroke Level Model ... 60!
5.2
!
Model Transformation ... 61!
5.2.2
!
List of Design Variations ... 65!
5.3
!
Implications for Design Recommendations ... 66!
5.3.1
!
Analysis of the Selected Design Variation ... 67!
5.3.2
!
Basic Recommendations to Change the Goal Task Path ... 68!
5.3.3
!
Further Recommendations to Improve the Goal Task Path ... 68!
5.4
!
Search Space Analysis ... 69!
5.4.1
!
Quantitative Analysis ... 70!
5.4.2
!
Qualitative Analysis ... 72!
5.5
!
Discussion ... 74!
6
!
EVALUATION ... 77!
6.1
!
Experiment ... 77!
6.1.1
!
Participants ... 78!
6.1.2
!
Materials ... 79!
6.1.3
!
Procedure ... 94!
6.2
!
Results ... 95!
6.2.1
!
Demographics ... 96!
6.2.2
!
Design Improvement ... 97!
6.2.3
!
Design Rationale ... 105!
6.3
!
Discussion ... 108!
7
!
CONCLUSION ... 112!
7.1
!
Summary ... 112!
7.2
!
Future work ... 114!
BIBLIOGRAPHY ... 116
!
Appendix A Additional Data Analysis of Design Improvement Study ... 122!
A.1 Do Participants use the Recommendation from the Transformation Condition? ... 122!
A.1.1 Factors causing a Usability Difference between the Conditions ... 122!
A.1.2 Use of the Recommendation by Presentation Order of the Designs ... 122!
A.2 Is the Recommendation from the Transformation Condition actually useful? ... 123!
A.2.1 Usability Difference by the Use of the Recommendations ... 123!
LIST OF TABLES
Table 2.1 KLM operators and standard execution times (Kieras, 1993) ... 13
!
Table 3.1 Study 1: Correct and well-supported recommendations ... 30
!
Table 3.2 Study2: Correct and well-supported recommendations ... 34
!
Table 3.3 Performance per participant as tail distribution function: % of participants ... 35
!
Table 4.1 Action graph operators and corresponding KLM operators with design implications ... 48
!
Table 5.1 Analysis of the number of states and operators ... 71
!
Table 6.1 Demographic characteristics of student participants ... 97
!
Table 6.2 Frequency of designs by use of the recommendation ... 99
!
Table 6.3 Summary statistics of KLM execution times ... 103
!
Table 6.4 KLM execution time difference ratio overall in the Transformation Condition ... 104
!
Table 6.5 Number of differences based on difference category by UI ... 106
!
Table 6.6 Differences covered by model transformation system ... 107
!
Table 6.7 Number of design rationales based on design rationale category by UI ... 107
!
LIST OF FIGURES
Figure 1.1 Improving design through the traditional model-based approach ... 2
!
Figure 1.2 Improving design through the model transformation approach ... 4
!
Figure 2.1 Model-based Interface Development Process (Szekely, 1996) ... 9
!
Figure 2.2 Example UI design sequence ... 11
!
Figure 2.3 KLM for ‘Find the file icon to be deleted and drag it to the trash can’ task (Kieras, 1993)14
!
Figure 2.4 Mean percentage of erroneous trials to single target for each target size ... 17!
Figure 2.5 Mean percentage of erroneous trials to multiple targets for each target size ... 18
!
Figure 2.6 Interfaces for the FTP client application (Gajos, 2004) ... 20
!
Figure 3.1 Task instructions given to students ... 25
!
Figure 3.2 Screen shot sequence mapping to task instructions ... 26
!
Figure 3.3 Modeling instructions given to students ... 26
!
Figure 3.4 CogTool model for Amazon task ... 28
!
Figure 3.5 CogTool timeline visualization with annotation to support recommendations ... 29
!
Figure 3.6 KLM with mark-up support recommendations ... 33
!
Figure 3.7 Percent of participants per recommendation category ... 34
!
Figure 4.1 Improving design through the model transformation approach ... 39
!
Figure 4.2 Example wireframe design for design components model ... 41
!
Figure 4.3 A model state composed of interaction models ... 43
!
Figure 4.4 Example action graph ... 43
!
Figure 4.5 Example KLM ... 45
!
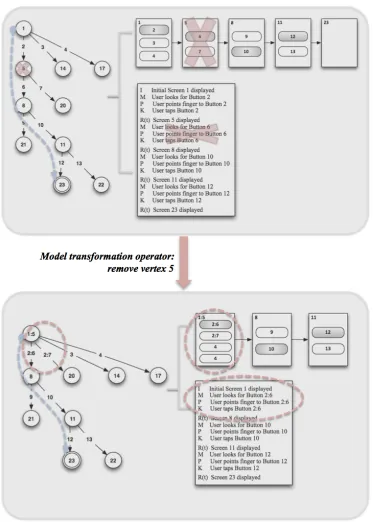
Figure 4.6 Model transformation example with ‘Remove Vertex 5’ operator ... 51
!
Figure 5.3 Scrabble: Design Components Model representation of Screen 2 ... 58
!
Figure 5.4 Scrabble: Action graph representation of design sequence ... 59
!
Figure 5.5 Scrabble: KLM representation of ‘Tap Button 12 and transition to Screen 3’ ... 61
!
Figure 5.6 List of the applications to analyze ... 62
!
Figure 5.7 Screen sequence and cost of shortest goal path ... 63
!
Figure 5.8 Usability costs based on various measures for original design ... 63
!
Figure 5.9 Design components of original design arranged with Java FlowLayout ... 65
!
Figure 5.10 List of design variations by difference screen sequences ... 66
!
Figure 5.11 Usability cost based on various measures for selected design variation ... 67
!
Figure 5.12 Design components of selected design arranged with Java FlowLayout ... 67
!
Figure 5.13 Design recommendation to satisfy selected goal path ... 68
!
Figure 5.14 Design recommendation to improve selected goal path ... 69
!
Figure 5.15 Number of taps versus number of states ... 71
!
Figure 6.1 Facebook: Close the chat window and hide the chat icon ... 82
!
Figure 6.2 TransLoc: Show one of the CRX bus information items ... 83
!
Figure 6.3. Zipcar: Reserve a Zipcar near the current location ... 83
!
Figure 6.4 Facebook: Close the chat window and hide the chat icon ... 86
!
Figure 6.5 TransLoc: Show one of the CRX bus information items ... 86
!
Figure 6.6 Zipcar: Reserve a Zipcar near the current location ... 87
!
Figure 6.7 Facebook: Design variations and recommendations ... 87
!
Figure 6.8 Scrabble design sequence in 2014 ... 89
!
Figure 6.9 Amazon: Before and after versions ... 89
!
Figure 6.10 AngryBirds: Before and after versions ... 90
!
Figure 6.12 Scrabble: Before and after versions ... 92
!
Figure 6.13 Experiment procedure ... 95
!
Figure 6.14 Number of improved designs per participant using the recommendation ... 100
!
Figure 6.15 Facebook: Distribution of KLM execution times of improved designs ... 102
!
Figure 6.16 TransLoc: Distribution of KLM execution times of improved designs ... 102
!
Figure 6.17 Zipcar: Distribution of KLM execution times of improved designs ... 103
!
Figure A.1 Traditional Condition: KLM execution time difference ratio by use of recommendation ... 124
!
Figure A.2 Transformation Condition: KLM execution time difference ratio by use of recommendation ... 125
!
Figure A.3 Both conditions: KLM execution time difference ratio by use of recommendation ... 126
!
Figure A.4 Facebook: Distribution of KLM execution times when recommendation not used ... 128
!
Figure A.5 TransLoc: Distribution of KLM execution times when recommendation not used ... 128
!
Figure A.6 Zipcar: Distribution of KLM execution times when recommendation not used ... 129
!
Figure A.7 Facebook: Distribution of KLM execution times when recommendation used ... 129
!
Figure A.8 TransLoc: Distribution of KLM execution times when recommendation used ... 130
!
1
INTRODUCTION
1.1
Background
Providing easy-to-use user interfaces (UIs) is a central issue in human-computer interaction. Many
approaches and theories have been developed to design UIs, measure usability, and analyze human
behavior. This dissertation describes a new approach focused on transforming interaction models to
generate design recommendations and improve interface usability. This research draws on the areas
of model-based usability evaluation and model-based user interface generation.
There are two general approaches to evaluate user interfaces. The first is testing a user interface with
real users. This approach is effective because usability is measured based on the users’ interactive
behavior with the system or a prototype of the system. However, performing live user testing is
usually considered to be time consuming and expensive. The second approach is model-based: it
examines the characteristics of the system’s interface and the behavior of the user on the system, with
reference to abstractions (i.e., models) that represent the user or the system (or both). This approach
can be used to predict user performance without the need for live user testing. We can use such
interaction models to evaluate interface usability (Kieras, 2002).
Model-based user interface generation tools generate user interfaces automatically from an abstract
representation of relevant information about users and tasks. This approach helps interface designers
by reducing the cost of creating or modifying designs. Models used in these approaches can be
categorized into three types: task and domain models, abstract user interface specifications, and
concrete user interface specifications (Szekely, 1996). My research extends past approaches by
applying interaction modeling techniques to the problem of interface generation, particularly in
In traditional human computer interaction (HCI) development, a user interface is designed and then
evaluated, either with modeling techniques or with user testing. Techniques like user testing are
usually applied in the later stages (iterations) of the development process, by observing how the user
actually uses the interface; modeling techniques are often applied in earlier stages (Ivory & Hearst,
2001). Figure 1.1 shows the flow of an interface development process that includes model-based
usability evaluation techniques. The core difference between what we call the “traditional”
model-based usability evaluation approach and conventional user testing is that in the former case the
decision for redesigning the interface is based on usability as measured by a model that predicts or
simulates a user’s interaction with the design (Kieras, 2002).
Figure 1.1 Improving design through the traditional model-based approach
In the traditional model-based usability evaluation approach, once the designer designs a UI (UI1), the
modeler or the designer constructs a model of the interface (M1) using modeling formalisms. Having
a model, the designers are able to measure some aspects of usability by the information represented
by the model, such as predicted user performance (e.g., how long the model takes to execute tasks),
the complexity or difficulty of interaction (e.g., whether the model can map its internal representation
and whether performance improves as the model gains information about how to carry out the task by
interacting with the UI). From this information, the designers can make decisions about whether the
UI needs to be redesigned to improve usability. If the designers makes the decision to improve the UI,
the original UI design (UI1) is modified to produce a new UI design (UI2). Redesigning tasks can be
done by redesigning the UI (UI1), based on the designers’ experience or knowledge of design
principles (UI1 ! UI2). Alternatively, if the designers have a good understanding of the relationship
between the design (UI1) and the interaction model (M1), they may be able to create a new design
(UI2) with better usability based on that knowledge (M1 ! UI2). We call the redesign steps (UI1 !
UI2 and M1! UI2) in this approach a UI transformation. However, this redesign step may take days
or even weeks and may involve an arbitrarily large number of design decisions.
1.2
Motivation
One major benefit of using a model-based evaluation approach is that design iterations can be carried
out at lower cost and in less time, because usability results can be obtained prior to implementing a
prototype or actual user testing. Moreover, the designer can gain the insight into how the design
supports the user in performing the task (Kieras, 2002). The designer can also compare usability
between alternative designs in quantitative terms.
Nevertheless there are shortcomings in the traditional model-based approach to improving the
usability of a user interface. Given the possible changes the designer can make in the UI
Transformation stage, the result may be a UI with better usability, but this is not guaranteed; the
designer may miss considering other design changes suggested by the model. Moreover, while
analysis of the model M1 provides information about the usability of UI1, decisions about how to
Designers can refer to a large body of literature on how to improve usability in user interfaces, but the
information may not directly influence the usability of modified interfaces; the designer may even
make mistakes in connecting the model with design information. To summarize, the first shortcoming
is that the steps in the redesign do not always guarantee improvements in usability, as appropriate
decisions in the redesign depend on the modeler’s judgment. The second shortcoming arises in the
step U2! M2. To fairly judge usability improvements in a new design, the designer must build a new
model. If the usability of the new design is not improved, based on the new model, the whole process
of redesign iterates; this is the third shortcoming of the traditional model-based approach.
Figure 1.2 Improving design through the model transformation approach
Thus to overcome some of the shortcomings of the traditional model-based approach for usability
improvement of a UI, I present a new model transformation approach. This approach comprises three
steps (Figure 1.2). First, the designer constructs (possibly but not necessarily by hand) a model M1 to
evaluate the usability of a given interface. Second, a set of transformations is automatically applied to
M1 to produce one or more new models (M2) with improved usability. Third, UI2 is generated by
using design suggestions related to the transformations made in the second step, taking into account
This approach has several potential advantages. Instead of going through repetitive steps for
designing, constructing, and evaluating interfaces as in the traditional model based approach, this
approach redesigns (transforms) models to give appropriate guidelines to designers, which should
lead to improved usability. Because models are more abstract than actual user interfaces, the space of
models to consider for improvements is much smaller than the space of interfaces. Further, because
model transformations are applied automatically, this approach explores a much larger space of
possible improvements than is typically considered by a human designer. This resolves the first
shortcoming of the traditional model based approach. Additionally, the transformation from the
model of an original interface to another model, then to a new interface, does not require building a
new model to validate the usability of new design. Finally, giving appropriate design guidelines that
lead to better usability will save designers effort in making their decisions and can potentially reduce
the number of redesign iterations.
1.3
Challenges
The goal of this research is to develop a framework to support the model transformation approach for
improving the usability of a design during the iterative user interface development process. The first
step, constructing an appropriate model from a UI design for usability, is related to model-based
evaluation. The third step, recommending or generating a UI design from a model, is related to
model-based user interface generation. Past research has shown that both steps are feasible, carried
out either by hand or by the system. However, there are no existing approaches for the second step,
model transformation. Therefore, this work will focus on what is needed for the model transformation
step. With respect to HCI, automating model transformation may reduce designers’ cost and effort for
UI design. From an AI perspective, developing representations of models for UIs and determining
1.4
Contributions
This dissertation makes the following contributions:
• Replication of prior study on model-based usability evaluation: Wilson et al. (Wilson,
Mackay, Chi, Bernstein, Russell, & Thimbleby, 2011) emphasize the value of replication in
HCI, to ensure that past results generalize, to check assumptions about prior work, and to
build new findings on solid ground. The study described in Chapter 3 replicates prior work by
John (John, 2011), showing that a modeling tool can be used effectively by novice designers
to improve a user interface. My results generalize John’s experimental conditions (i.e., the
sample of novice designers and the training procedures); the novice designers’ work had
similar accuracy and consistency. In addition, this result justifies the direction of my
dissertation work (Chapter 3).
• A model transformation approach presented and validated through empirical findings: I
propose a new approach in the model-based usability evaluation process to help the designers
improve usability of UI. I present a framework to support this approach that automatically
explores possible alternative designs based on the interaction models specified. The
framework also provides recommendations as guidance to designers for usability
improvements (Chapter 4). The effectiveness of this approach is validated through empirical
findings from two studies: a study that compares the traditional model-based approach and
the model transformation approach on a set of design improvement tasks, and an exploratory
study on adapting the model transformation approach to the problem of inferring design
rationale. From the results of the study, we find evidence that the proposed approach is useful
• Demonstration of models extending action graphs to represent the model transformation
approach: To provide better recommendations to the designer (considering various aspects of
the design), I integrate multiple interaction models with action graphs. In theory, the action
graph representation is a formalism that can incorporate other interaction models (Thimbleby,
2013). However, a detailed account of how models other than Fitts’ Law can be combined
with action graphs is missing in the existing literature. I use design information to integrate
features of other models into action graphs and show how the usability measures of each
model is used for providing the recommendation. (Section 4.1, Section 5.1)
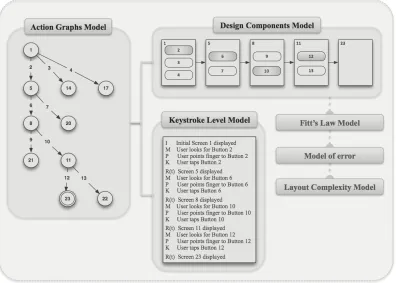
• Implementation of a system reflecting the model transformation approach: Three components
are necessary to simulate the proposed model transformation approach: a module to process a
UI representation, a module to run model transformations, and a module to analyze design
rationale. Each module reflects the conceptual flow of the proposed model approach (Figure
4.1). A module for UI representation manages information about the appearance of the
design as well as the interaction models of the design. A module for model transformation
runs a conventional state space search algorithm to explore possible alternative designs
represented in successor model states. The state space as well as operator information is
collected to analyze design implications in the design rationale module. This module
generates the recommendation to improve the original design. Implementation of this system
also led me to identify important issues for improving the quality of recommendations, such
as the need for an automatic layout design algorithm and different levels of abstraction that
1.5
Dissertation Organization
The structure of this dissertation is as follows. In Chapter 2, I present related work on model-based
user interface development. In Chapter 3, I present a study that motivates my work. In Chapter 4, the
overall process as well as the representation of model transformation approach is described, and in
Chapter 5, I present a system designed to execute the process. In Chapter 6, two studies to evaluate
my approach are illustrated, with results. Chapter 7 summarizes the contributions and future
2
RELATED WORK
In this chapter, I summarize related work on model-based user interface development. I first go
through interaction models for usability evaluation, particularly the models used in my model
transformation approach. In addition, an overview of previous model-based user interface
development research is described, for relevant ideas about the representation of the model
transformation process as well as the content of UI recommendations.
2.1
Model-based User Interface Development
Figure 2.1 Model-based Interface Development Process (Szekely, 1996)
In order to assist in the development of interfaces during the software lifecycle process, a
Model-Based Interface Development Environments (MB-IDE) exists. With a model specified for the
design generation, expressing design with high-level specifications, help system generation, and
generating critics/advisors for a design (Szekely, 1996).
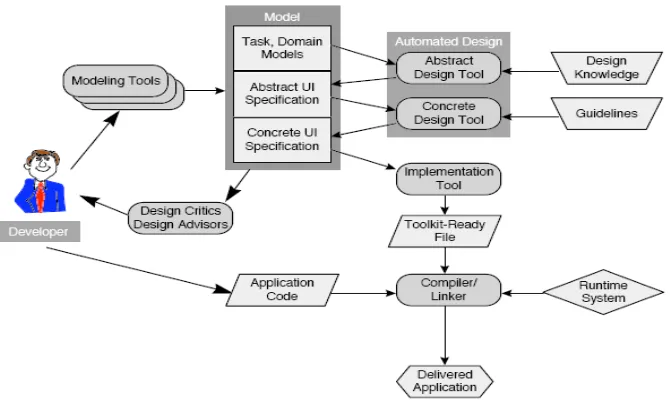
Szekely describes the general architecture for a MB-IDE as shown in (Szekely, 1996). In this
architecture, the main components related to my work are the model component and the design
critics/design advisors component. The model component has three levels of abstraction: task and
domain models, abstract UI specification, and concrete UI specification. A task model specifies the
tasks performed using the interface, and a domain model specifies the data and operations supported
by the interface. An abstract UI specification represents the structure and content of the interface. It
includes abstract interaction objects, information elements, and presentation units. A concrete UI
specification specifies the style for rendering in terms of toolkit primitives. The design critics/design
advisors component evaluates the interface design. Usually this is done at the level of the concrete UI
specification. It suggests refinements based on design knowledge.
2.2
Interaction Design Models
There are a variety of ways to evaluate designs using modeling techniques, including physical models
(e.g., Fitts’ Law (Fitts, 1954)), performance models (e.g., the Keystroke Level Model or KLM (Card,
Moran, & Newell, 1980), (Kieras, 1993), GOMS (Card, Moran, & Newell, 1983), (Gray, John, &
Atwood, 1993), (John & Kieras, 1996a), (John & Kieras, 1996b), (Kieras, 1999), ACT-R (Anderson,
Bothell, Douglass, Lebiere, & Qin, 2004), (ACT-R Research Group, 2002)), and descriptive models
(e.g., state machine models (Dix, Finlay, Abowd, & Beale, 2003)). Each model represents different
aspects of UI design, system status, user actions, and performance. In this section, I summarize the
2.2.1 Action Graphs
The Action Graph model, due to Thimbleby (Thimbleby, 2013), is a generalized finite state machine
formalism. An action graph is a graph in which each vertex represents a state of the system plus the
action that leads to that state; edges are transitions between those vertices. It is defined by analyzing
all possible state changes based on user actions throughout the design. In other words, the action
graph model is a conventional device state representation derived from a system specification with
path information encoded in individual vertices and edges. Considering a conventional transition
system as G, a vertex <!,!> in action graph G' is interpreted as “vertex ! in G is reached by user
action !.” Thimbleby also describes action graphs as a formalism that could include other user
performance models. Unless another model is incorporated to represent user performance, an action
graph considers the lower bound estimate of task time as 0.2 seconds times the lower bound count of
the action (e.g., button press) to reach the goal.
Figure 2.2 Example UI design sequence PLAY
OPTION
HELP
SINGLE PLAY
MULTI PLAY
RESUME GME
NEW GAME
START GAME
SETTING
As an example, Figure 2.2 shows a sequence of mobile UI screenshots visited in starting a new game,
a simplified wire-frame design of the Scrabble1 interface for the iPhone. Gray rounded rectangles
represent buttons touched by a user for this task. Assuming the state is represented as a screen with
the user action that caused the transition, the action graph can be represented as follows (‘*’ is used to
represent the action that produced the initial screen, and the name of the state for playing the game is
a ‘new game’).
The first line of this model represents the first screen transition in playing Scrabble (Figure 2.2). The
<Initial Options, *> state represents the initial screen. Initial Options is the name of the screen and
‘*’ is the name of the action that corresponds to the transition to the Initial Options screen. <Play
Mode, Play> represents the state of the second screen in Figure 2.2. Play Mode is the name of that
screen and Play is the name of the action (tapping the Play button on the Initial Options Screen) that
leads to the Play Mode screen. In sum, the first transition represents the transition caused by tapping
the Play button on the Initial Options Screen to move to the Play Mode screen. Each line of this
example model represents each transition (shown as arrows between the screens), while the last line
represents a transition to the screen for playing the actual game (which is not included in the screen
shot sequence).
1 Scrabble is a mobile game application developed and distributed by Electronic Arts Inc < Initial Options, * > ! <Play Mode, Play>
<Play Mode, Play> ! <Single Play Options, Single Play>
2.2.2 Keystroke Level Models
The Keystroke-level Model (KLM) (Card, Moran, & Newell, 1980), (Kieras, 1993) decomposes a
task into a sequence of operators and predicts user performance. This model considers only primitive
operators at the level of pressing buttons and moving the mouse cursor, plus an operator representing
mental preparation. These operators are shown in Table 2.1.
Table 2.1 KLM operators and standard execution times (Kieras, 1993)
In order to evaluate usability using the KLM, representative task scenarios for an interface must be
chosen. Keystroke-level actions needed for a task are specified, based on the interface design, and the
physical operators corresponding to each keystroke-level action are determined (e.g., pressing a
mouse button after pressing a keyboard key with the right hand implies a movement of the hand from
the keyboard to the mouse). After this step, the physical operators corresponding to the action
sequence for performing the given task are listed. Operators representing the user waiting for the
User execution time is calculated by summing the standard execution time of the operators. If we
assume Ti denotes the product of ni and ti, where i is type of operator, ni is number of operators i, and
ti is standard execution time of i, then the total execution time can be calculated as:
!!"!#$%!=!!+!!+!!+!!+!!+!!+!!(!)
Figure 2.3 shows a KLM model shown for the task of finding the file icon to delete and dragging it to
the trash can, as given by Kieras (Kieras, 1993).
Figure 2.3 KLM for ‘Find the file icon to be deleted and drag it to the trash can’ task (Kieras, 1993)
The KLM was originally proposed for the desktop computer environment. However, one of the
benefit of using the KLM is that the operators as well as the time durations can be adapted based on
the interaction style specific to the devices. For instance, Holleis et al. (Holleis, Otto, Hussmann, &
Schmidt, 2007) present a KLM for the mobile phone that defines and adapts operators for user
interaction in the mobile phone UI (i.e., Mobile KLM). The Mobile KLM predicts interaction time on
mobile devices. Whereas the original KLM defined six operators and time values for interaction on
desktop computers in order to predict the execution time, Mobile KLM basically extends the original
operators and re-examined the original operators to determine whether they are applicable as is,
derivable to new values, or not applicable. The Mobile KLM is used to determine the efficiency of a
task in a given interface design.
The Macro Attention Shift (SMacro) operator is used to model the time needed for shifting focus
between an object on the screen and in the real world. The Micro Attention Shift (SMicro) operator is
used to model the time for looking at the different regions on the device (e.g., keypad, hotkey,
screen). The Distraction (X) operator is for times when a user is distracted by some external event; the
Action (A(t)) operator is for complex actions; the Gesture (G) operator is for the system to recognize
gestures; the Finger Movement (F) operator is for the action of moving a finger; and the Initial Act (I)
operator is for preparing the mobile device before actually using it. The conventional KLM operators,
Keystroke (K), Pointing (P), and Homing (H), are also part of the Mobile KLM. The Mental Act (M)
operator and Response time (R(t)) operator are used unchanged from original KLM; the Drawing
(D(nD,ID)) operator is eliminated as not being applicable. Execution time is defined below, where
op={A, F, G, H, I, K, M, P, R, SMicro, SMacro}.
Mobile phone technology has evolved since the Mobile KLM was originally developed. Nowadays,
mobile phones with touch screens enable users to perform new actions. Therefore some operators of
the Mobile KLM may need to be re-examined considering the features of current devices. For
instance, the Drawing operator (D(nD,ID)) is considered not applicable, but it is available on mobile
phones with touch screens in a variant form for dragging and dropping. However, re-adapting and
validating the duration of each Mobile KLM operator is not in the scope of this dissertation. In this
2.2.3 Fitts’ Law
Fitts’ Law is one of the most commonly used physical interaction design models; physical models do
not consider purely cognitive activity. Fitts’ Law analyzes the time for tapping a target based on the
size of the target and the distance to it. This model is defined under the assumption that information
capacity and the human motor system are related (Fitts, 1954).
Fitts’ Law (Fitts, 1954) is defined by three equations. These equations define the index of difficulty
(ID), movement time (MT), and index of performance (IP), also called throughput (TP). Together
these equations are commonly used as the measure of the performance of an input device.
ID evaluates the difficulty of a target selection task in bits, based on the width of the target and its
distance from a known starting point. The formula is as follows, where A is the distance to the target
and W is the width of the target.
!"
=
!"#
!(
!
!
+
1
)
MT evaluates the time to complete a task based on ID and two empirically derived coefficients based
on experimental conditions. The equation is as follows. The constants a (in units of time) and b (time
units/bit) are coefficients that represent the efficiency of the device.
!"
=
!
+
!
!×
!!"
=
!
+
!
×
!"#
!(
!
!
+
1)
IP (or TP) represents human performance capacity and is defined as the quotient of ID and MT.
!"
=
!"
The design implication of Fitts’ Law is that it can be used as a strategy for improving usability of a
user interface (Heim, 2007). A common summary is that ‘Large targets and small distances between
targets are better for usability’. This is because such constraints on targets will reduce the index of
difficulty.
2.2.4 Parhi et al.’s Model
Parhi et al. (Parhi, Karlson, & Bederson, 2006) present models relating target size to performance for
one-handed thumb use on touchscreen devices. For their models, they conducted two experiments.
One was to determine appropriate target sizes for the task of pointing at a single target and the other
was to determine appropriate target sizes for the task of sequential pointing to multiple targets.
By analyzing the accuracy of a touch based on the target size from their experiment, the following
models were presented.
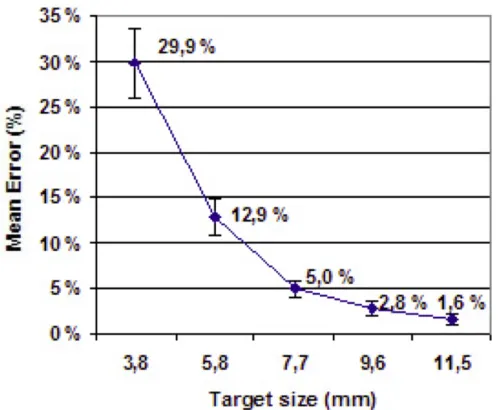
The single-target task represents typical interactions with radio buttons, activation buttons, or
checkboxes. Figure 2.4 shows the result of the study measuring error rate versus different target sizes
(Parhi, Karlson, & Bederson, 2006). From this study, targets smaller than or equal to 7.7 mm resulted
in significantly more errors than targets larger than or equal to 9.6 mm. There was no significant
difference in error rates for the targets larger than 9.6 mm.
Figure 2.5 Mean percentage of erroneous trials to multiple targets for each target size
The multiple-target task represents those similar to numeric or data entry, such as pressing a series of
numbers on a keypad. Figure 2.5 shows the result of the study of measuring the error rate of this task
on multiple targets versus different target sizes. The targets with smaller sizes had a larger error rate,
while there was no significant difference in error rates between targets with size larger than or equal
2.3
Model-based Usability Evaluation Tools
Sears (Sears, 1995) proposed AIDE, a metric-based interface design and evaluation tool that extends
the idea of Layout Appropriateness (Sears, 1993). In his earlier work, Sears presented a metric to
measure how far a proposed layout of widgets is from an optimal layout. This metric is based on
frequency of use and the distance involved in performing the task. The optimal layout is constructed
by considering the interface as a collection of unit-sized objects placed on a rectangular grid and then
finding an optimal solution by searching through possible layouts. AIDE defines the metric presented
in (Sears A. , 1993) as efficiency. In addition, it defines metrics for alignment, balance, and other
constraints. AIDE evaluates these measurements for a given UI interactively. Byrne et al. (Byrne,
1994) presented a UI in a user interface development tool, called USAGE. This tool incorporates a
formal interface analysis technique (GOMS) in a model-based interface design tool (UIDE). A
translator was built to translate the action sequence files of UIDE into a NGOMSL (Natural GOMS
Language) (Kieras, 1988) model, so that USAGE provides execution time estimates based on the
GOMS model of the generated UI. A further application of USAGE is in supporting a designer to run
alternative UIs to quickly compare interfaces.
2.4
Automatic Interface Generation
2.4.1 Model-based Interface Generation
Puerta et al. (Puerta A. R., 1994) present a model-based UI development tool called Mecano. This
tool uses a data model and a high-level dialog specification as a model, and generates a UI using
design templates and layout rules. Szekely et al. (Szekely, Luo, & Neches, 1993) present
HUMANOID, which takes a model as a declarative description of the interface presentation and
2.4.2 Interface Generation with Adaptation
SUPPLE (Gajos, 2004) is a system that generates an interface meeting the device’s constraints and
minimizing user’s effort on using the interface. This system considers the interface generation
problem as an optimization problem. Gajos formally defined device characteristics by a functional
interface specification and device capabilities, then modeled users’ usage patterns from traces of
performance. When rendering an interface, a branch-and-bound constrained search algorithm is
applied to find an optimal solution. A different interface design is rendered adapting the
characteristics of the device as well as the usage pattern.
Figure 2.6 Interfaces for the FTP client application (Gajos, 2004)
Figure 2.6 shows a set of interfaces for the FTP application. Screenshots (a) and (b) are the initial
designs with the following usage pattern: (1) if the information entered in (a) is correct and the Login
button is clicked, the window changes to (b); (2) if the Logout button in (b) is clicked, the window
2.5
Tools for Interface Guidelines
Just as there is a vast number of guidelines in the form of recommendations, platform-specific style
guides, and experience-based usability heuristics, there is a great deal of research on tools for working
with guidelines (Grammenos, 2000). Vanderdonckt’s work on a system to manage those guidelines,
called SIERRAS, is one such tool (Vanderdonckt, 1995). However, this system focuses on managing
guidelines rather than on application to real interface designs. Sherlock (Grammenos, 2000) is a
system that provides an integrated environment for using guidelines. It automatically does a usability
inspection of a preliminary design, based on given rule-based guidelines. The role of my system is
similar to Sherlock in the aspect of analyzing a user interface to improve its usability. However, it is
different in that Sherlock is using UI guidelines whereas my system is using interaction models for
analyzing the interface and giving guidance on how to improve its usability.
2.6
Discussion
Work on model-based user interface development continues today; however, there are fewer
connections between automatic interface design generation (i.e., automatically generating user
interfaces, tools for interface generation) and approaches that incorporate design critics/advisors (i.e.,
interaction design models, model-based usability evaluation tools). Work on interaction models and
model-based usability evaluation tools focuses on models to better represent user performance. Work
on automatic interface design generation focuses on models to better represent interface designs and
to better mange interface guidelines. The model transformation approach connects the research in
these two areas. In my work, interface usability is analyzed using interaction design models or using
model-based usability evaluation tools. I associate results from the models with relevant design
improve the usability of an interface. This can be further used to automatically generate user
3
MODELING TECHNIQUES FOR UI RECOMMENDATIONS
2In this chapter, I present two studies on the use of a modeling tool for making design
recommendations. The results of this study motivate the use of model transformation approach in the
UI development process.
3.1
Background
Extensive research in the field of interaction models for usability evaluation has been done, producing
metrics for re-design decisions or techniques to compare usability between different designs.
However, it is rare to find work dealing with the issue of bridging model information to UI
recommendations.
In 2011, John (John , 2011) reported a study of 100 novice modelers who used CogTool3 to produce
recommendations for improving two Web sites. Modelers showed significant consistency in their
results, and the majority of their recommendations were well supported with quantitative
justifications based on CogTool models. The focus of this paper was showing that CogTool can be
easily learned and applied by those new to modeling and relatively new to interface design, whereas
modeling tools are typically viewed as helpful mainly to expert modelers in understanding user
performance. In addition to this result, this work was closely related to my view on the role of
modeling tool: the scope of the study was analyzing the use of the tool for producing UI
2 This chapter is an edited version of a paper published in the proceedings of the ACM Conference on Human
Factors in Computing Systems, or CHI (Hong & St. Amant, 2014).
recommendations, which normally requires the user to understand the model and to link that
knowledge to both the design and the task.
3.2
Experiment
As the ultimate goal of this dissertation work is to provide a system that helps designers by providing
usability evaluation measures as well as UI recommendations, John’s study is good motivation. We
conducted two follow-on studies. The first was a simple replication of John’s study. The purpose of
the study was to determine whether John’s findings would generalize beyond the sample of novice
modelers at CMU, taught to use CogTool by one of its developers. We investigated whether model
information (i.e., CogTool results) help in producing design recommendations, using a different
population of novice designers/modelers. CogTool shares the goals of other task modeling techniques
for HCI (e.g., the Keystroke Level Model (Card, Moran, & Newell, 1980)), but we are aware of no
empirical comparison between CogTool and these techniques for making design recommendations
previous to my own work.
The second study was a follow-on in which modelers, without knowledge of CogTool but with the
same exposure as in Study 1 to the KLM and other techniques, recommended improvements to the
same user interface. The purpose of the second study was to test whether different modeling
techniques impact performance in producing design recommendations.
3.2.1 Participants
Undergraduate computer science students in an HCI course participated in the studies. The course is a
conventional survey of topics in HCI, using The Resonant Interface (Heim, 2007) as the textbook. At
for HCI in general (three 1.25-hour lectures in all). Students submitted models as part of a homework
assignment, worth 5% of their course grade.
3.2.2 Study 1: Recommendations with CogTool
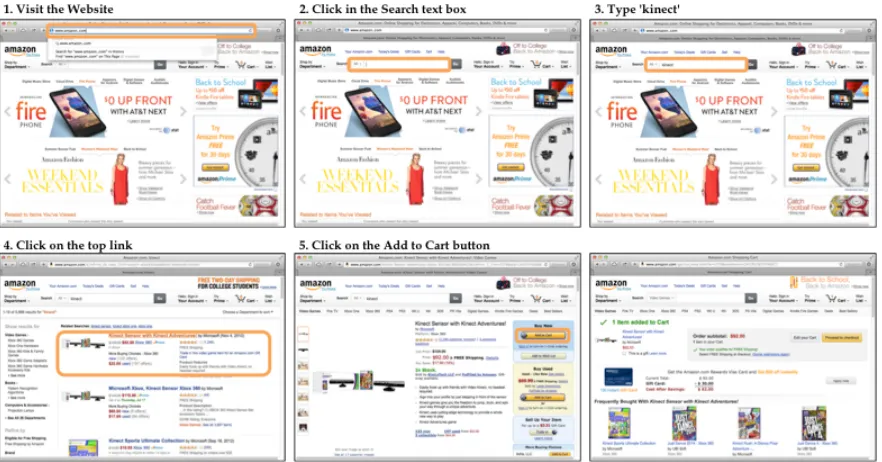
Participants were given an explicit task to perform on a Web site, shown in Figure 3.1. We chose a
simple task comparable to John’s for our findings. Figure 3.2 shows the design sequence mapping to
the task instructions in Figure 3.1, with the area where the task was performed marked in orange
rounded rectangles.
Participants were also given instructions for building a model for the task and making three
recommendations for improving the interface. Additional instructions directed participants to carry
out the task by hand first, to be as specific as possible in their recommendations, and to remember
that (a) the goal was to model expert behavior and (b) not all potential changes, such as reducing
visual clutter or changing the color scheme, would plausibly improve expert behavior, and such
changes were not amenable to analysis using the techniques they were to rely on.
Figure 3.1 Task instructions given to students
1. Visit the Web page http://www.amazon.com. (If you are automatically logged into your Amazon account, log out, then reload the page.)
2. Click in the Search text box.
3. Type “kinect” (without quotation marks) in the Search text box, and press return.
4. Click on the top link that is shown in the search results; for me this is “Kinect Sensor with Kinect Adventures and Gunstringer Token Code.”
Figure 3.2 Screen shot sequence mapping to task instructions
Figure 3.3 Modeling instructions given to students
Determine three potential improvements to the usability of the Web site, for this task, based on the information in the visualization. For each of your improvements, 1. Give a short phrase that identifies the improvement.
2. Optional: If the phrase doesn't entirely specify what the change to the Web site should be, explain it in more detail.
3. Give a screenshot of the visualization, annotated to show how the improvement would change performance (e.g., a circle around some pattern).
4. In words, summarize the pattern you've identified in the visualization.
Figure 3.3 is the set of modeling instructions for Study 1: participants were to build their models in
CogTool and support their recommendations with annotations of a CogTool timeline visualization.
Study 1 replicates John’s as follows: the participants were new to modeling and CogTool, they were
given a step-by-step description of a task, and they completed their modeling and recommendation
activities within one week. The instructions were equivalent to John’s, though more explicit in
describing the required structure for submissions. There were differences. The participants were all
computer science majors rather than HCI majors with a mix of backgrounds, and they were asked to
analyze a different Web site from the ones used by John. The introduction to CogTool, including a
demonstration, took an additional half hour of class time. The introduction was given by someone not
on the CogTool development team, and unlike John’s study no hands-on working session followed
during which questions could be answered. (The instructor answered a few procedural questions
asked by the participants via email.) Otherwise Study 1 was as close to John’s as practicable.
3.2.3 Study 2: Recommendations with Other Modeling Techniques
Study 2 was conducted as one semester later in the same course. The conditions in Study 2 were the
same as in Study 1, except that the modeling task was given to students before the introduction of
CogTool. (They used CogTool later in the course for their project work.) The modeling instructions
for Study 2 gave more generic guidelines, without mention of CogTool: Base your structured
description on the material in Chapter 7 and our discussion in class: the Model Human Processor,
with its visual, motor, and cognitive capabilities; the Keystroke Level Model; various GOMS
techniques. Modelers worked without specialized tools, mostly relying on Fitts’ Law and KLM.
Aside from the use of CogTool, Study 1 and Study 2 are effectively identical, with respect to the task
3.3
Results
3.3.1 Study 1: Recommendations with CogTool
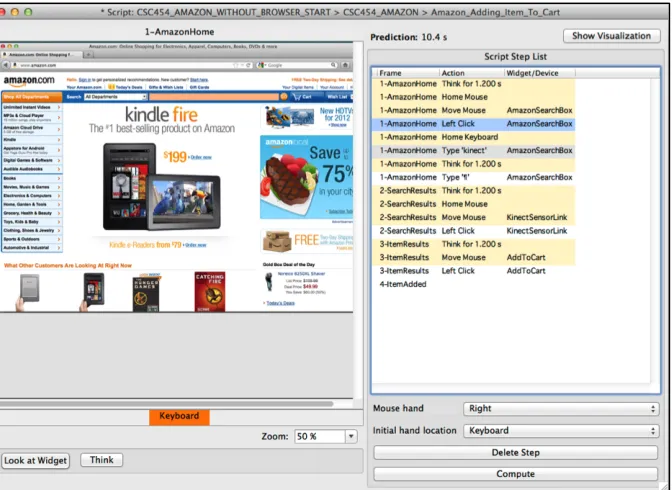
In Study 1, 53 modelers submitted recommendations. Two submissions were produced without using
CogTool and are not included in our analysis. Of the remaining 51, two modelers provided only two
recommendations rather than three, giving 151 recommendations in all. Figure 3.4 shows CogTool
model submitted by one of the student. The right side of the model presents the steps of the task, and
left presents the portion of the design for the selected step of the task. Predicted task execution times
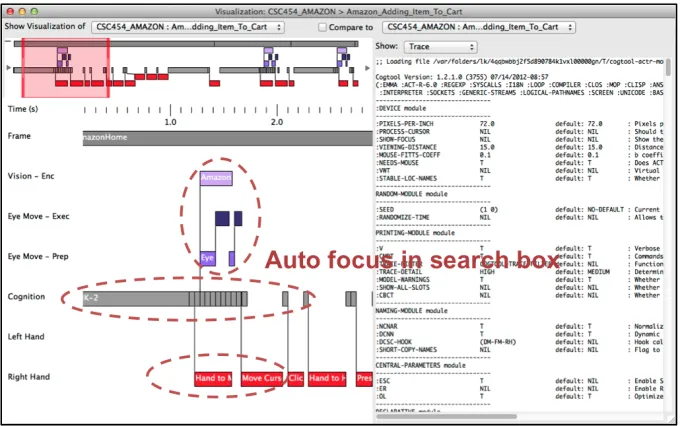
will appear when the Compute button is clicked. Figure 3.5 shows the CogTool timeline visualization
of the model marked with the portion of the model that supports the UI recommendation the student
has made.
Figure 3.5 CogTool timeline visualization with annotation to support recommendations
To analyze results, two evaluators independently created categorizations over the aggregate set of
recommendations.4 The evaluators then worked together to agree on a specific category for each
recommendation. As shown in Table 3.1, the most common recommendations were to place an
additional “Add to cart” button beside each product and to make targets for mouse clicks larger or to
place them closer together.
Following John, the recommendations were judged with respect to being “correct” (whether they
would reduce the predicted duration of the task) and “well supported” (by reference to a visualization
produced by CogTool). The evaluators judged 68.2% of the recommendations correct and well
supported (c+ws), below John’s 75.1%. An additional 19.9% were correct but “vague or inarticulately
argued,” in most cases because the explanation did not refer to the model (cf. John’s 16.6%). The
remainder were incorrect. In total, 88.1% of the recommendations were judged to be correct, if not
necessarily well supported (cf. 91.7%).
Table 3.1 Study 1: Correct and well-supported recommendations
Table 3.1 shows all of the correct and well-supported recommendations given by participants; no
others were identified. All but one modeler (98%; cf. John’s 100%) gave at least one correct
recommendation. 42 of the 51 gave at least one correct and well-supported recommendation (82%; cf.
John’s 96%—possibly due to the abbreviated instructions for CogTool in Study 1). Fourteen
participants gave one or more incorrect recommendations (27%; cf. John’s 21%). These represent
poorer performance than John’s numbers, but most measures are surprisingly close.
Table 3.1 also shows the median duration and interquartile range of the time savings in seconds
calculated by the participants, per category of recommendation. The total time for the task is more
than ten seconds, and most of the recommendations would each save half a second or more. We find
it notable that participants can justify recommendations, while they lacked some information to make
Variability in estimates of time savings (in the IQR column) is inevitable, due to the coarseness of
categorization. For example, changing the size or location of a target icon can reduce duration, but
how much depends on the new size or location; Search autocomplete and Incremental search can
reduce typing time, but the reduction depends on how many keystrokes are saved. Some but not all
participants modified their models for these two design changes; others estimated the savings by
subtracting some number of keystrokes. The latter approach appeared to be common, but it will not
always produce accurate results. Incremental search savings are inflated because most participants
did not include the required shift of visual attention to a dynamically changing set of products. Even
for more straightforward recommendations, such as Autofocus in search box, participants differed in
whether the Think operator should be included in the savings. As long as the recommendation was
correct and the annotation included the relevant cognitive/visual/motor components of the task, it was
considered well supported.
One category of interest not included in Table 3.1 is Remove extraneous content. Many participants
observed that removing clutter could improve performance by allowing for target elements to be
closer together (leading to a Closer/larger targets categorization), but other participants
recommended reducing clutter based on incorrect arguments (e.g., that experts are distracted by a
cluttered visual display, or that thinking time is spent processing screen information not included in a
model). These were considered incorrect.
In general, incorrect recommendations were of two types: within the scope of the task but not likely
to improve an expert user’s performance (e.g., removing ads or changing button colors—8% of all
recommendations); or out of scope, without regard for expertise (e.g., providing more results to scroll
We evaluated the consistency of the recommendations with the Any-Two Agreement (A2A) statistic
(Hertzum & Jacobsen, 2001). A2A is the number of common problems found by two participants,
divided by the total number of problems found by those two participants, averaged over all
participants. John’s A2A value of 34% puts her study above 9 of the 12 studies in Hertzum and
Jacobsen’s survey; our A2A value of 30% is above 8. Study 1 adds evidence to the view that CogTool
may reduce the evaluator effect by providing a model-based grounding for recommendations (John ,
2011).
Two weeks after the completion of the modeling exercise a brief, informal survey was given. 47
students submitted free-form text answers to questions about their use of CogTool. (The survey was
anonymous to allow the question, Did you follow the instructions?; all respondents answered yes.)
The most informative answers were to the question, Describe in a few sentences how CogTool fit into
the process of your making recommendations for design improvements. John has demonstrated that
novice modelers can produce useful results with CogTool; our survey provides initial clues about how
they integrate modeling into their analysis, as well as how CogTool improves the process.
Our informal analysis of the responses showed three categories of interest. The most common answer,
from 26 participants (51%), described using CogTool to identify appropriate areas for design changes.
“I would use CogTool to see which areas of an application take the longest for a user to move
through.” “I looked at the model that CogTool presented and looked for areas where there were
actions canceling each other out, such as moving a hand to the mouse and then back… and tried to
understand how to eliminate some of those steps.” Most then described using CogTool to justify their
recommendations in quantitative terms. Nine participants (18%) also mentioned making comparisons
between models, to evaluate the differences between interface designs. “I then looked at side-by-side
CogTool to validate design decisions they had thought of on their own: “It helped give me proof that
my suggestions would actually help by providing estimated times.”
3.3.2 Study 2: Comparative Analysis
For Study 2, in which participants did not use CogTool, 50 participants submitted 150
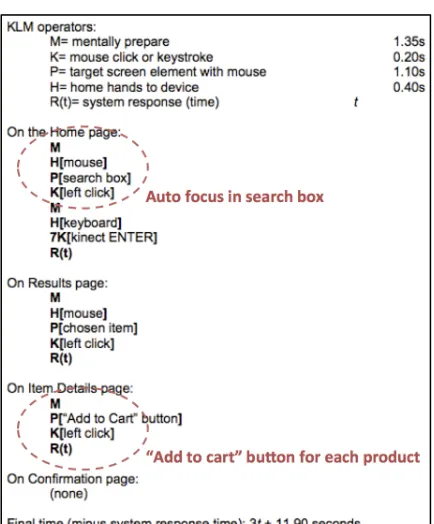
recommendations in total. Figure 3.6 shows a Keystroke Level Model built by one student. We have
marked the portion of the model the student pointed out to support the recommendation. This student
said that suggested recommendations will remove the marked operator sequences, so as to improve
total execution time of the task.
The same evaluators followed the same procedure as in Study 1 to categorize recommendations,
except using references to the modeling techniques above rather than to CogTool in their evaluation.
Table 3.2 Study2: Correct and well-supported recommendations
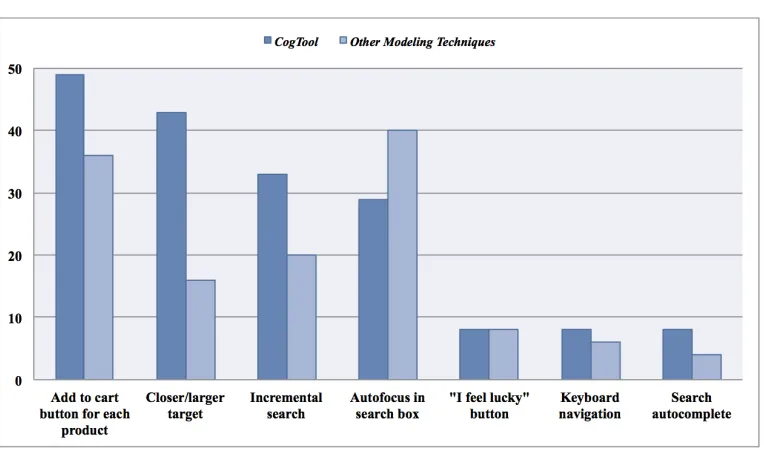
Table 3.2 shows that the correct and well-supported recommendations in Study 2 and Figure 3.7
shows the numerical distribution of categories and estimates of time savings comparable to those of
Study 1. But the totals were considerably lower. In Study 1, 88% of recommendations were correct,
versus 63% in Study 2; for correct and well-supported recommendations the values were 68% and
43%.
Table 3.3 Performance per participant as tail distribution function: % of participants
Table 3.3 shows the tail distributions for the count of correct/well-supported recommendations,
aggregated over modelers; that is, 35/51 or 69% of modelers in Study 1 gave three correct
recommendations, and so forth. A two-sample Kolmogorov-Smirnov exact test shows a significant
difference between Study 1 and Study 2: D = 0.321, p < 0.01. (Treating the counts as continuous data,
we can ask about the difference between the mean number of correct recommendations per modeler,
2.6 in Study 1 versus 1.9 in Study 2: t(99) = 3.97, p < 0.01.) Analysis of correct and well-supported
recommendations shows the same result. In other words, performance in these studies is not
determined purely by the task and the background knowledge of modelers; use of CogTool is a
significant factor. In general, this is evidence that using different modeling techniques may influence
A2A, a measurement about the extent on evaluators agreement for the problems of the system
(Hertzum & Jacobsen, 2001), in Study 2 is 20%. The drop from 30% in Study 1 is not unexpected,
given the greater variation in modeling procedures. No new correct and well-supported
recommendations were identified, but there was a wider range of incorrect recommendations. These
fell into the same general classes as in Study 1: changes affecting performance outside the scope of
the task (e.g., multiple item selection or filtering capabilities—11% of all recommendations), and not
focusing on expert users as specified in the instructions (25% of all recommendations). The latter is
not surprising. In an HCI survey course, the clearest illustrations of usability issues are often based on
the challenges that novice users face in complex interfaces; CogTool currently targets expert users.
The former category of incorrect recommendations is more surprising, though not in retrospect.
CogTool also appears to help novice modelers remain aware of the boundaries of a specific task when
attempting to improve user performance by changing the UI design.
3.4
Discussion
Although these two studies were designed with a focus on whether novice modelers would be able to
make and support their design recommendation using CogTool, and whether CogTool was a decisive
factor, the results also motivate and provide direction for my model transformation approach of using
interaction models for producing better designs.
Study 1, conducted with students (i.e., novice modelers) at a different university, gave an interface
design with task to it, build a model using CogTool, make design recommendations, and support
recommendations using CogTool. The result shows that students can produce and justify design
recommendations for improving a specific user interface with similar accuracy and consistency as in