INVESTIGATION
Integration Pro
fi
ling of Gene Function With Dense
Maps of Transposon Integration
Yabin Guo,*,1Jung Min Park,*,1Bowen Cui,†Elizabeth Humes,* Sunil Gangadharan,‡Stevephen Hung,*
Peter C. FitzGerald,§Kwang-Lae Hoe,** Shiv I. S. Grewal,†Nancy L. Craig,‡and Henry L. Levin*,2 *Section on Eukaryotic Transposable Elements, Program in Cellular Regulation and Metabolism, Eunice Kennedy Shriver National Institute of Child Health and Human Development,†Laboratory of Biochemistry and Molecular Biology, National Cancer Institute, and§Genome Analysis Unit, National Cancer Institute, National Institutes of Health, Bethesda, Maryland 20892,‡Howard Hughes Medical Institute and Department of Molecular Biology and Genetics, The Johns Hopkins University School of Medicine, Baltimore, Maryland 21205, and **Department of New Drug Discovery and Development, Chungnam National University, Yusong, Daejeon 305–764, Republic of Korea
ABSTRACTUnderstanding how complex networks of genes integrate to produce dividing cells is an important goal that is limited by the difficulty in defining the function of individual genes. Current resources for the systematic identification of gene function such as siRNA libraries and collections of deletion strains are costly and organism specific. We describe here integration profiling, a novel approach to identify the function of eukaryotic genes based upon dense maps of transposon integration. As a proof of concept, we used the transposon Hermes to generate a library of 360,513 insertions in the genome ofSchizosaccharomyces pombe. On average, we obtained one insertion for every 29 bp of the genome. Hermes integrated more often into nucleosome free sites and 33% of the insertions occurred in ORFs. We found that ORFs with low integration densities successfully identified the genes that are essential for cell division. Importantly, the nonessential ORFs with intermediate levels of insertion correlated with the nonessential genes that have functions required for colonies to reach full size. This finding indicates that integration profiles can measure the contribution of nonessential genes to cell division. While integration profiling succeeded in identifying genes necessary for propagation, it also has the potential to identify genes important for many other functions such as DNA repair, stress response, and meiosis.
T
HE accelerated rate of gene discovery in an increasing number of species has challenged the existing methods for determining the functions of genes. Traditional ap-proaches for characterizing the function of genes rely on obtaining mutant alleles and testing them in individual ex-periments for phenotypes. Direct and systematic methods for evaluating gene function have been developed. Genome-wide RNAi screens of cultured cells require the synthesis, validation, and refinement of large libraries of double stranded RNAs or vectors that express double stranded RNAs. While RNAi screens have successfully identified manygenes that may contribute to key functions such as the rep-lication of human immunodeficiency virus (Brasset al.2008; Koniget al.2008; Zhouet al.2008), the production of RNAi libraries is resource intensive and substantial complications exist, such as off-target effects and incomplete mRNA knockdown.
An alternate approach for characterizing gene function in haploid cells relies on targeted gene deletions. For Saccha-romyces cerevisiae and Schizosaccharomyces pombe, collec-tions of strains have been created that contain systematic deletions of the predicted coding sequences (Winzeleret al.
1999; Kimet al.2010). These comprehensive collections of strains can be readily screened under a variety of conditions to probe the contributions of individual genes to specific processes. However, considerable effort and resources are required to generate deletion sets and once generated, it is difficult to study the deletions in combination with other mutations. Another limitation with deletion collections is the rate of erroneous deletions associated with generating strains en masse. A significant proportion of strains can
Copyright © 2013 by the Genetics Society of America doi: 10.1534/genetics.113.152744
Manuscript received April 30, 2013; accepted for publication July 20, 2013 Supporting information is available online athttp://www.genetics.org/lookup/suppl/ doi:10.1534/genetics.113.152744/-/DC1.
The raw sequences for thein vitroandin vivoinserts were deposited in the SRA database of GenBank under accession no. SRA043841.1.
1These authors contributed equally to this work.
2Corresponding author: NIH, 18 Library Dr., Room 106, Bethesda, MD 20892.
retain copies of genes that were targeted for deletion (Hughes et al. 2000). Finally, information from deletion collections cannot address the function of the ORFs and noncoding RNAs that have yet to be discovered.
Here we describe integration profiling, a simple trans-poson-based method capable of directly probing the func-tion of single copy sequences throughout the genome of haploid eukaryotes. Integration profiling recently became feasible with the availability of deep sequencing and the discovery of highly efficient DNA transposons that are active in a broad spectrum of eukaryotic organisms. With trans-posons that readily disrupt ORFs, and sequencing techno-logy that can position high numbers of insertions, the analysis of a single culture can measure the contribution of each gene to cell division. As a proof of principle we describe a study with 360,513 independent insertions of the Hermes transposon in the genome ofS. pombe. As a control for the properties of the Hermes transposase, we analyzed 1,362,743 insertions generated in vitro with purified Her-mes transposase and naked S. pombeDNA. Thein vivo in-tegration achieved an average of one insertion for every 29 nucleotides of nonrepetitive genome and these insertions favored nucleosome free regions. However, 33% of the insertions disrupted ORFs and those with lower levels of integration correlated well with the genes reported to be essential while the ORFs with higher integration densities corresponded with the genes reported to be nonessential (Kimet al.2010). Importantly, ORFs with intermediate den-sities of insertion correlated with genes that, while not es-sential, do contribute to growth. In addition, discrepancies between the genes reported to be nonessential by the de-letion consortium and our integration data revealed that
10% of the deletion strains retain a copy of the ORFs targeted for deletion.
Materials and Methods
Yeast strains
The S. pombestrains used for this study are listed inTable S5. TheS. pombestrain YHL912 (h-, leu1-32, ura4-294) was transformed with the donor (pHL2577) and expression plas-mids (pHL2578) separately by lithium acetate method. The donor plasmid was transformed into YHL912first to create the strain YHL9451. This strain was then transformed with the expression plasmid to create YHL9609, which was used for transposition in liquid cultures. An empty expression vector (Rep81x) was introduced in place of the expression plasmid to create YHL9176 as a negative control for transposition.
Heterozygous diploid deletionS. pombestrains were pur-chased from the Bioneer Corporation and Korea Research Institute of Biotechnology and Bioscience (http://pombe. bioneer.co.kr/). Strains carrying a deletion inmmf1,mrpl16,
mrpl19, orSPBC2d10.08cwere transformed with a plasmid copy of the deleted gene (seeTable S6) by lithium acetate
method, followed by a second transformation with a plasmid that allows for sporulation (pHL2806). The haploid deletion strains used in this study were from the Bioneer collection version 2.0.
Plasmid constructs
The donor plasmid (pHL2577) and expression plasmid (pHL2578) have been previously described and are listed inTable S6. TheUra3-marked donor plasmid consists of the
KanMX6gene cloned between the Hermes terminal inverted repeats (TIRs). The Leu-marked expression plasmid contains the Hermes transposase gene driven by the Rep81x nmt1
promoter. A detailed description of plasmids used in this work is included in Supporting Information. The oligonu-cleotides used in this study are listed inTable S7.
Media
Strains were grown in liquid Edinburgh minimal media (EMM) supplemented with 2 g/liter dropout powder (all amino acids in equal weights, leaving out leucine and uracil, plus adenine in 2.5 times more weight) (Forsburg and Rhind 2006). To eliminate the Hermes donor plasmid, the final cultures were diluted in EMM supplemented with uracil, leucine, 5-fluoroorotic acid (FOA), and B1 (at 50 mg/ml, 225mg/ml, 1 mg/ml, and 10mM, respectively). This culture was then diluted in YES media (YE plus complete dropout mix consisting of all the amino acids) supplemented with FOA and G418 (at 1 mg/ml and 500mg/ml, respectively) to isolate cells with insertion events.
Transposition frequency was measured by plating cells on 2% agar plates containing EMM and dropout mix supple-mented with leucine (250mg/ml), uracil (50mg/ml), 5-FOA (1 mg/ml), and 10 mM thiamine, and also plating on YES plates supplemented with FOA and G418 at the concentra-tions noted above.
Pombe Minimal (PM) media used for drop assays is identical to EMM, except with 3.75 g/liter glutamic acid substituted for 5 g/liter NH4Cl.
Generating a library of Hermes insertions
A culture of YHL9609 was grown to OD600 = 5, and was
used to inoculate a series of cultures at OD600= 0.05. The
serial passaged cultures were continued until the percentage of cells with integration reached 13%, or80 generations of cell division. In all, it took a series of 12 sequential cultures for the strain to reach this point.
The final 50-ml culture was grown in FOA to select against the donor plasmid and then in G418 to select cells with Hermes insertions.
The protocols for preparing Hermes insertion libraries for high-throughput Illumina sequencing are extensive and are included in Supporting Information. The process includes the extraction of genomic DNA, the digestion of the DNA with MseI, the ligation of linkers to theMseI fragments, the PCR amplification of insertion sites, the gel purification of the PCR products, and the Illumina sequencing of the amplified
DNA. The raw sequences for the in vitroandin vivo inserts were deposited in the Sequence Read Archive (SRA) database of GenBank with accession no. SRA043841.1.
Mapping Hermes integration sites on the genome of S. pombe
Sequence reads from Illumina were screened for those containing Hermes left end. Then the Hermes sequences were trimmed. The trimmed sequences were aligned to the
S. pombegenome using the National Center for Biotechnol-ogy Information (NCBI) BLAST software (blastall) on a local computer. The BLAST results were filtered to collect matches with genomic sequence that started from thefirst nucleotide after the Hermes end and with identities $95% and expect (e) values#0.05. Then, of the matches that met these criteria, the one with the highest bit score was used to obtain the coordinates for the unique insertion sites (Table S4). Sequences that were found to have the same insertion coordinate and the same orientation were considered to be duplicate reads and were counted as only one independent integration event.
Matched random control
For each Hermes insertion site, the distance between the integration site and the responsibleMseI site (d) was calcu-lated. Then anotherMseI site coordinate (m) was randomly chosen from the S. pombe genome. Then m + d or m 2 d was taken as a matched random control (MRC) site. To
“add” or “subtract” was also randomly determined. Thus, the MRC dataset has the same size as the experimental in-tegration dataset and matches the distances toMseI sites.
General bioinformatic analysis and programming
The scripts for screening the raw sequences, filtering the BLAST outputs, extracting features from .embl files, de-termining the locations of Hermes insertion according to chromosomal features, generating MRC and other analyses were written in Perl or Ruby programming languages.
Nucleosome DNA preparation and sequencing
Nucleosomal DNA was prepared as described previously (Yamaneet al.2011), and DNA samples were sequenced by
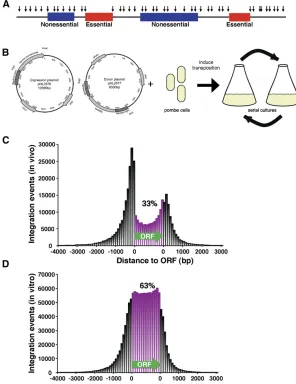
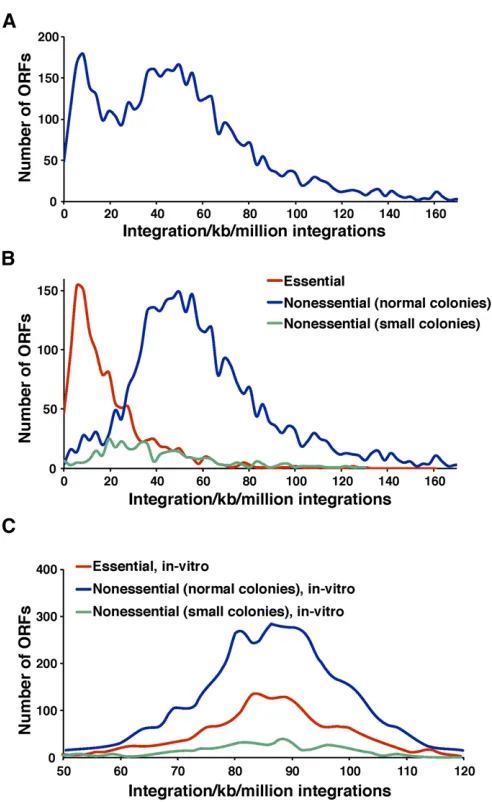
Figure 1Integration profiling of S. pombe resulted in 360,513 independent insertions. (A) With integration
pro-filing, genes required for cell division are predicted to have many fewer insertions than genes that are not required for propagation. (B) Transposition was induced in cells that contained one plasmid expressing the Hermes transposase and a second plasmid that contained the Hermes TIRs
using the Illumina sequencing protocol. Bowtie (Langmead
et al.2009) was used to map the Illumina sequencing reads, trimmed to 25 bp of high quality reads, against the reference genome allowing for two mismatches. The mapped data werefiltered to remove all sequences that mapped to more than a single location. The end positions of the reads were aligned relative to the center of the nucleosome by shifting the plus strand reads by +73 bp and the minus strand reads by 273 bp. The final nucleosome maps were produced by applying gaussian smoothing to the raw data to reduce noise. More detailed methodology will be described in a forthcoming manuscript on the genome-wide mapping of nucleosomes inS. pombe.
Essentiality test
To test the viability of four representative Bioneer strains heterozygous for deletions in nuclear-encoded mitochon-drial genes designated as essential, we performed a plasmid shuffle assay. The details of this process are included in
Supporting Information.
Results
Integration profiling is a method developed to determine which genes are essential for cell division. With this method, populations of cells with transposon insertions are grown for many generations. The culture becomes depleted of cells that have insertions in genes important for division. In-sertion sites in genomic DNA from cells in the culture are amplified by ligation-mediated PCR and the location of the insertions are determined by deep sequencing. The integra-tion profiles of the cultures were expected to contain high densities of insertions throughout the genome except in genes that are required for propagation. Figure 1A illustrates a model of the integration pattern expected in an integration profile.
The Hermes transposon of the housefly,Musca domestica, has high levels of integration activity in S. pombe and as much as 50% of the insertions occur in ORFs (Evertts
et al. 2007; Park et al. 2009). We therefore applied the Hermes system as previously described to create an integra-tion profile of the S. pombe genome. Briefly, the Hermes transposase was expressed from a plasmid in cells that also contained a plasmid copy of the Hermes TIRs flanking a kanMX6 gene, which confers resistance to G418 (Figure 1B) (Everttset al.2007; Parket al.2009). The transposase excises kanMX6 with the TIRs and inserts this DNA into chromosomal sequences of S. pombe. Cells with insertions
are selected using media containing G418 and the majority of G418-resistant cells have a single insertion (Everttset al.
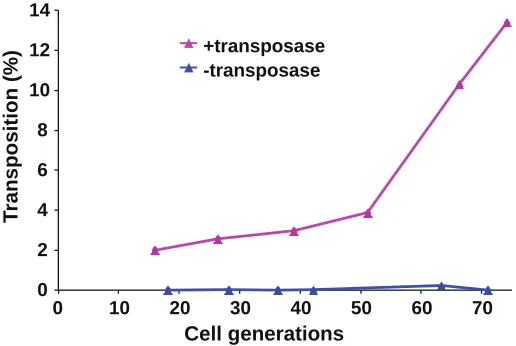
2007). To create sufficient numbers of insertions and to allow for selection of thefittest cells, the cultures expressing the transposase were grown with repeated dilutions for a to-tal of 74 generations (Figure 1B). Quantitative measures of transposition revealed that 13.4% of the cells in the final culture contained an integrated copy of Hermes (Supporting Information, Figure S1). In the absence of transposase, no insertions were detected. The positions of the insertions were determined by ligation-mediate PCR followed by deep sequencing (Guo and Levin 2010) (and Materials and Meth-ods section inFile S1).
The data from sequencing generated 46 million high-quality sequence reads that were 50 nt in length. Thefirst 10 nt of the reads contained the end of Hermes and the remaining 40 nt were derived from the insertion sites in chromosomal DNA. Using the homology algorithm BLAST, 27.5 million reads were matched to a unique sequence in theS. pombegenome. Because PCR amplification or cell di-vision can create multiple copies of the same integration event, duplicate reads were omitted. The remaining data identified 360,513 independent insertions and these are the sites that we analyzed (Table 1). On average, this amount of integration constituted one insertion for every 29 nt of nonrepetitive sequence in the genome.
The insertion sites favor nucleosome-depleted positions
The integration activity of Hermes in S. cerevisiae was re-cently described (Gangadharanet al.2010). InS. cerevisiae, 41% of the insertions were in ORFs and of the 59% that occurred in the intergenic regions, sites upstream of the ORFs were favored. This pattern of integration correlated with nucleosome-free regions and was attributed to greater DNA accessibility at these positions (Gangadharan et al.
2010).
To determine which properties of integration are intrinsic to the Hermes transposon, we compared the distribution of Hermes integration in S. pombe to that reported inS. cere-visiae. A map of the insertions inS. pomberevealed that 33% occurred within ORFs (Table 1 and Figure 1C). The inser-tion levels were higher in the intergenic regions than in the ORFs and the insertions in intergenic regions of S. pombe
exhibited the same preference for sequences upstream of the ORFs that occurred inS. cerevisiae(Table 1).
To test whether the higher levels of integration in the intergenic sequences were caused solely by sequence prefer-ences of the transposase, we generated a library of insertions
Table 1 Distribution of Hermes insertions inSchizosacccharomyces pombe
Total insertions Upstream of ORFs (%) In ORFs (%) Downstream of ORFs (%)
In vivo 360,513 165,402 (45.9) 117,587 (32.6) 77,524 (21.5)
In vitro 1,362,743 313,326 (23.0) 858,763 (63.0) 190,654 (14.0)
Insertions were designated as upstream of an ORF if the insert is closer to the 59end of an ORF than to the 39end. They are designated as downstream of an ORF if the insert is closest to the 39end of an ORF.
in naked DNA using purified Hermes transposase in an
in vitro reaction. Deep sequencing of the in vitro insertions identified 1.36 million independent integration events in S. pombe DNA (Table 1). Sixty-three percent of these inserts occurred in ORFs and the fraction of insertions in the inter-genic sequences upstream of ORFs was similar to the inser-tions downstream (Figure 1D and Table 1). This distribution correlated well with the coding content of theS. pombe ge-nome, which is 60.2% (Woodet al.2002) and suggests in the
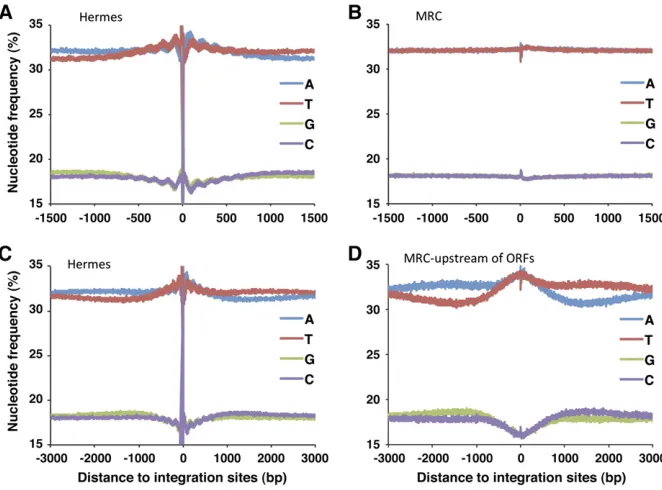
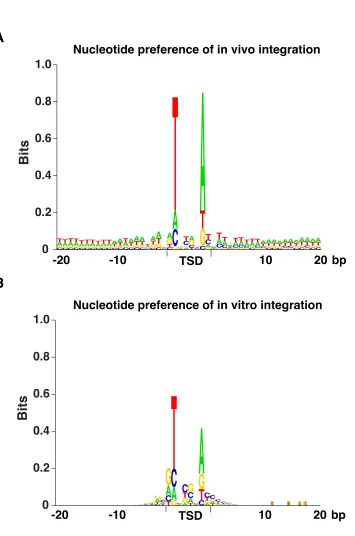
in vivoexperiment the integration preference for sequences upstream of ORFs was due to features of chromatin structure. To characterize the sequence preferences of Hermes integration inS. pombe, we analyzed the nucleotide frequen-cies at the insertion sites. The Hermes transposase recog-nizes the consensus sequence nTnnnnAn (Zhou et al.
2004) and as expected, the vast majority of the insertions in S. pombe had this sequence (Figure S2A). The same nTnnnnAn was found at the sites of Hermes integration generatedin vitro(Figure S2B).
Many transposons and retroviruses exhibit nucleotide preferences in the form of palindromes thought to result from contacts between the integrases and nucleotides that extend as far as 50 nt to 100 nt from the sites of insertion (Holman and Coffin 2005; Wanget al.2007; Gangadharan
et al.2010; Guo and Levin 2010; Maertenset al.2010). The nucleotide frequencies surrounding the insertions we gener-ated possessed an unusual palindromic pattern of nucleotide frequencies that extended .1.5 kb from the insertion sites (Figure 2A). The sequences had a surprising oscillation of nucleotide frequencies with a wavelength of 150 bp that extended500 bp from the insertion sites. These oscillating patterns of nucleotide frequencies were not observed in a set of random insertions called a MRC generated in silico that matches the distances toMseI sites of the authentic insertions
(Figure 2B). Nor were they observed in the in vitro experi-ment (Figure S3). As a result, these oscillating preferences for A’s, T’s, G’s, and C’s reflect the in vivo context of the insertion sites and not a bias generated by the procedure used to cut the genomic DNA or contacts the transposase makes with the target DNA. The 150-bp repeat patterns suggested that the Hermes transposase was influenced by nucleosomes during integration.
Extending our analysis of nucleotide frequencies further from the insertion sites revealed a second bias consisting of a single palindromic depression in A/T content that contin-ued a full 3 kb from the insertion sites (Figure 2C). This pattern was also absent in the MRC (Figure 2B) and in the
in vitrointegration data (Figure S3). Interestingly, the 3-kb nucleotide bias was stronger when just the insertions up-stream of ORFs were analyzed (Figure S4). To test whether the 3-kb depression in A/T frequency resulted from a prop-erty of sequence upstream of ORFs, we analyzed the nucle-otide frequencies of the subset of random insertions (MRC) that occurred upstream of ORFs (Figure 2D). The random insertions upstream of ORFs did possess a strong A/T de-pression that was very similar in magnitude and extent to the upstream insertions of Hermes (Figure S4). Consistent with the finding that the A/T depression was an intrinsic property of sequence upstream of ORFs, we found that the average nucleotide frequencies upstream and downstream of theS. pombeORFs do have a lower frequency of A relative to T (Figure S5, A and B). This is an unusual genome struc-ture that to our knowledge has not been previously reported for S. pombeand is not as extensive inS. cerevisiae(Figure S6, A and B).
The oscillating pattern of A’s, T’s, G’s, and C’s surrounding the Hermes insertions was not observed with the set of ran-dom insertions positioned upstream of ORFs, suggesting
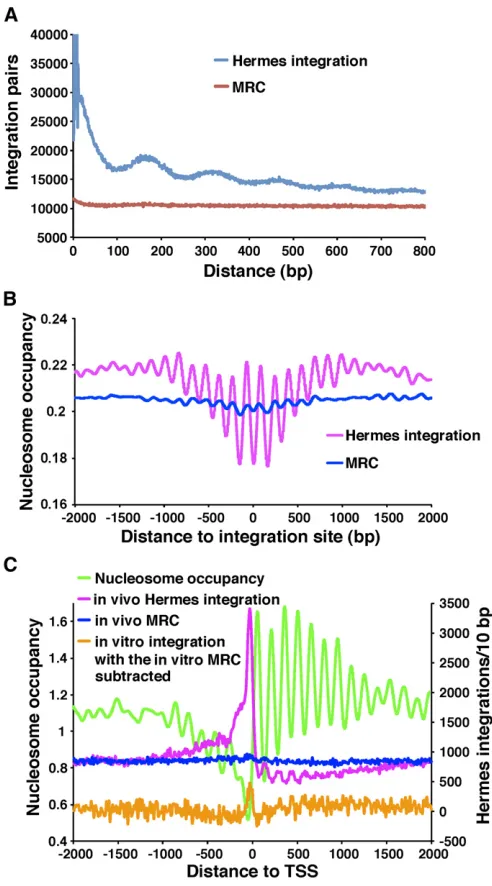
that this 150-nucleotide periodicity was mediated by regu-larly spaced proteins such as nucleosomes. If this insertion bias were due to integration into arrays of phased nucleo-somes then the closest distances between insertions should be multiples of 150 bp. An analysis of all the pairs of
insertions closer than 800 bp revealed that the most com-mon distances were indeed multiples of 150 bp (Figure 3A). Such a pattern was not seen with the random controls. To test directly whether integration was influenced by nucleo-somes, we generated a map of nucleosome occupancy for chromosome 3 (Methods section inFile S1). An analysis of the average nucleosome occupancy extending 2 kb on either side of the insertions createdin vivorevealed a highly reg-ular oscillation with a wavelength of 150 bp (Figure 3B). The insertion sites were located at the lowest nucleosome occupancy, indicating the highest frequencies of integration were between nucleosomes. The MRC sites did exhibit oscil-lations but the amplitudes were substantially smaller than the in vivoinsertions, indicating that the positions of MseI sites did not contribute to the strong integration bias that favored sites between nucleosomes.
The correlation between the positions of integration and oscillating nucleosome occupancy suggested the pattern was due to the position of nucleosomes. To test this possibility we examined the insertion levels at the transcription start sites (TSSs) (annotated in the Sanger Center, February 2011 chromosome contigs based on Dutrow et al. (2008) and Lantermannet al.(2010) (Figure 3C). As expected, nucleo-some occupancy was very low in the regions 150 nt up-stream of TSSs and from the start of ORFs, nucleosomes were positioned in phased arrays. Integration generated
in vivo was very high in the nucleosome-free region up-stream of the TSSs and from the start of ORFs the integra-tion was reduced but oscillated in sync with the spaces between nucleosomes. This analysis supported the correla-tion seen in Figure 3B, that integracorrela-tion generated in vivo
favored nucleosome-free sites (Figure 3C). This oscillating pattern was not observed in the MRC set matched to the
in vivoinsertions nor in thein vitroinserts.
Integration density of ORFs identify essential genes
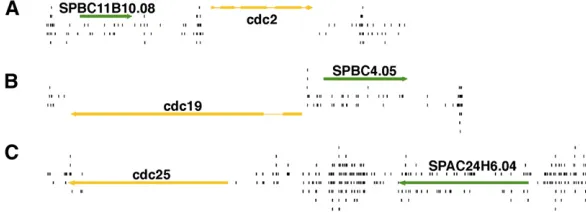
While the nucleosomes within ORFs appeared to inhibit integration, a full 33% of all integrations did occur in coding sequence. To investigate whether the densities of the integration generated in cells could be used to discriminate between essential and nonessential genes, we graphed the insertions surrounding three known essential genes, cdc2,
cdc19, andcdc25(Figure 4, A–C). In each case, little or no integration was detected in these three essential ORFs while high levels of insertions were seen in the adjacent intergenic sequences and nonessential ORFs. This initial evaluation of integration profiling suggested that integration density could be used to identify essential genes.
We next tested whether Hermes integration could identify essential ORFs throughout theS. pombegenome by analyzing the integration densities (inserts per kilobase per million integrations, units normalized to millions of inser-tions per dataset so that densities from the in vitro experi-ment could be compared) for all annotated ORFs (Figure 5A). Two dominant groups of ORFs were observed with peak densities of 8.3 inserts/kb/million and 50 inserts/kb/
Figure 3 Hermes integration occurs at sequences with low nucleosome occupancy. (A) The distances between all pairs of Hermes insertions were calculated and the distribution of these distances was plotted for the pairs that were,800 bp apart. Also shown are the distances between inser-tions for the MRC sites created to match thein vivoinsertions. (B) The insertion sites in chromosome 3 were aligned and the average nucleo-some occupancies were plotted for each position in a window that ex-tended 2 kb on both sides. (C) The pol II transcribed genes on chromosome 3 were aligned at the start sites of transcription. The num-bers ofin vivoinsertions (pink) in 10-bp intervals were plotted for a 4-kb window. The MRC insertions matched to thein vivoinserts are shown in blue. Shown in orange are thein vitroinsertion numbers minus the MRC values calculated for thein vitrodata. The average nucleosome occupan-cies are shown in green.
million. A consortium has systematically deleted individual ORFs inS. pombeto create a set of heterozygous diploids. By sporulating the strains and monitoring the germination of spores carrying the deletions, they designated which ORFs were essential for growth (Kim et al. 2010). Using these designations, we plotted the integration densities for the nonessential and essential ORFs separately (Figure 5B). The integration densities in the essential ORFs were clearly lower than in the nonessential ORFs, indicating that the integration profiles did discriminate between essential and nonessential genes. The integration density at the peak with the maximum ORFs was 5.5 inserts/kb/million for the es-sential ORFs and 50 inserts/kb/million for the noneses-sential ORFs. These two peaks corresponded with the two maxi-mum peaks of integration in the total group of ORFs shown in Figure 5A. We also analyzed the integration densities of a subclass of nonessential genes that, when deleted, resulted in small colonies. Importantly, these nonessential ORFs had intermediate densities of integration (Figure 5B). This indicates that the intermediate levels of integration were detected be-cause these nonessential genes made important contributions to growth. The low levels of integration in the essential ORFs and the intermediate levels of integration in the nonessential ORFs that contribute to colony growth were not due to prop-erties of the sequences or the transposase, since an analysis of thein vitrointegration showed the essential and nonessential ORFs contained equivalent densities of integration (Figure 5C). While the integration densities generally reflected whether an ORF was essential, there was some overlap in the distributions of the two groups (Figure 5B). For exam-ple, there were 50 ORFs designated by the deletion con-sortium as essential that had integration densities of 59.4 insertions/kb/million up to 161 insertions/kb/million, lev-els that suggested the ORFs were nonessential (Table S1). One possible explanation for this discordance is that these genes were actually not required for cell division but instead played a key role in spore formation or germination. Since the deletion consortium relied on lack of spore germination to identify essential genes, proteins required for spore func-tion would be incorrectly designated as essential for growth. Interestingly, over half of these 50 disparate ORFs play an important role in mitochondrial function. In contrast to S. cerevisiae, it is thought thatS. pomberequires mitochondrial DNA and many nuclear-encoded mitochondrial genes for viability even when fermentable carbon sources are
avail-able (Haffter and Fox 1992; Kim et al. 2010). However, the possibility existed that these nuclear-encoded mitochon-drial genes ofS. pombeare required for spore germination, not cell division.
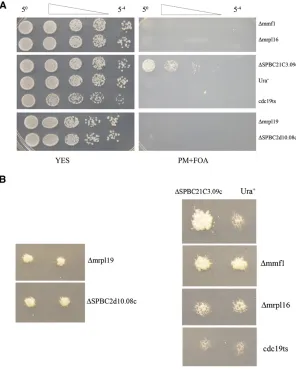
We tested directly whether four representative nuclear-encoded mitochondrial genes from Table S1were required for cell division with a “plasmid shuffle”method that uses a haploid strain containing a plasmid-encoded candidate gene but lacking the chromosomal copy of the same gene. If the strain grows on medium containing 5-FOA, a com-pound that selects for plasmid loss, then the gene is non-essential (Sikorski and Boeke 1991; Ben-Aroyaet al.2008). The genes that we tested encoded mitochondrial ribosomal proteins (mrpl16,mrpl19, andSPBC2D10.08c) and a factor involved in mitochondrial DNA maintenance (mmf1). Each of these four ORFs had high numbers of insertions (79.4 to 128 insertions/kb/million) but were designated as essential by the consortium. In each case, when the strains carrying plasmid copies of the genes were diluted onto medium con-taining 5-FOA, no growth occurred, indicating that these genes were truly essential (Figure 6A, right panel). In com-parison, when a strain lackingSPBC21C3.09c, a nonessential gene, was diluted on the same plate, cells grew readily, indi-cating they did not require a plasmid encodingSPBC21C3.09c. Surprisingly, when patches of the same deletion strains were replica printed from rich medium directly onto medium con-taining 5-FOA, strains lacking the mitochondrial genes showed strong levels of growth while equivalent strains lacking a func-tional Cdc19p, an essential protein, did not grow (Figure 6B). Taken together with the high numbers of insertions in these ORFs, these data indicate that while we found the nuclear-encoded mitochondrial genes are truly essential for division, the pools of the proteins and the number of mitochondria that segregate during mitosis are sufficient to support many cycles of cell division after their genes were disrupted. This result suggests that the 50 ORFs identified in Table S1 represent a baseline of genes that produce pools of protein that were too large to be depleted during the growth of our cultures.
Ten percent of the strains in the deletion collection retain a copy of the genes that were targeted for deletion
Another aspect of the Hermes integration data that is discordant with the designations of the deletion consortium is that among the genes reported by the consortium to be
nonessential, there were 220 ORFs that had integration densities below the average for the essential ORFs (19.7 inserts/kb/million). This low amount of Hermes integration suggests these genes are actually essential for viability (Table S2).
Some of these ORFs encode highly conserved proteins such as eIF2 gamma, eIF6, and Pub1p that are known to be essential in other eukaryotes. One explanation for the low integration in these ORFs is that they are essential for cell division and in the process of deleting the genes or in the subsequent step of sporulating the heterozyogous diploids, chromosomal rearrangements occurred that produced hap-loid strains with the desired deletion and an ectopic copy of
the ORF that had been deleted. Strong selection for these events would exist if the ORFs were essential. Just such a set of processes occurred with the S. cerevisiae deletion set where a full 8% of 300 strains tested were found to retain an intact copy of the deleted ORFs either in aneuploid or rearranged chromosomes (Hugheset al.2000).
To test whether the strains in the S. pombe deletion set retained copies of ORFs thought to be deleted, we assayed for the presence of these ORF sequences with PCR. For these experiments, we chose a representative set of 77 ORFs reported by the consortium to be nonessential and that had increasing integration densities from 0 to 42 inserts/ kb/million (Table S3). We generated two pairs of primers to amplify different segments of each of these nonessential ORFs (Figure 7A). We found that 31 (40%, counting dele-tions producing the same number of PCR bands as wild type, wt) of the haploid strains tested retained ORF sequences reported to be deleted (Table S3). In addition, when the ORFs tested were grouped by the amounts of Hermes in-tegration they had, a clear trend was observed. The ORFs with lower Hermes integration densities were much more likely to be retained in the deletion strains (Figure 7B). Of the 19 representative ORFs tested that had,5.5 inserts/kb/ million integrations, 11 (58%) were still present in their respective deletion strains. The representative ORFs with greater levels of integration were more likely to be absent in their deletion strains. For example, the 10 representative ORFs with 41–42 insertions/kb/million insertions were all deleted successfully. To check whether our PCR reactions might have spuriously detected ORF sequences due to con-taminating DNA, we used DNA blots and tested the presence of a sampling of ORFs. Six ORFs that had varying densities of Hermes integration and that we found by PCR to be present in the deletion strains were probed on DNA blots. All six ORFs were clearly present in the deletion strains in which they had been reported to be deleted (Table S3). Given that DNA contamination was not a significant prob-lem with our PCR assays, we used the data in Figure 7B and the levels of Hermes integration to estimate the number of strains in the deletion collection that have been incorrectly reported to lack the specified ORFs. Based on a linear re-gression of integration densities of ORFs designated to be nonessential with 0–42 inserts/kb/million integrations, we estimate that300 (10%) of the deletion strains designated nonessential are actually essential and contain the ORFs said to be deleted.
Discussion
We described here integration profiling, a transposon-based technique that relies on integration densities to discriminate between the essential and nonessential genes of S. pombe. The 360,513 independent sites ofin vivointegration resulted in an average of one insertion for every 29 nucleotides of non-repetitive genome. Essential genes accumulated many fewer insertions than nonessential genes and importantly, nonessential
Figure 5 Essential ORFs exhibited low integration densities. (A) The in vivointegration densities (inserts/kb/million integrations) for each ORF were determined and the distributions were plotted. (B) The distributions ofin vivointegration densities were plotted for ORFs designated by the deletion consortium as essential (red) and nonessential (blue). The distri-bution of densities was also plotted for ORFs that when deleted, result in small colonies (green). (C) The in vitrointegration densities (inserts/kb/ million integrations) for each ORF were determined and the distributions were plotted as above in B.
genes that contribute to colony growth accumulated intermedi-ated densities of insertions.
A total of 67% of thein vivoinsertions occurred in inter-genic sequences. This fraction represents a high level of enrichment relative to 39.8%, the intergenic proportion of the nonrepetitive genome (Wood et al.2002). In compari-son, 37.0% of the insertions generated in vitrooccurred in intergenic sequence, a fraction close to the intergenic por-tion of the nonrepetitive genome. This indicates the high level of intergenic integration that occurred in vivo was not due to the selection of these sequences by the trans-posase itself. It is formally possible that thein vivoinsertions were detected in the intergenic regions because integration in ORFs was more likely to be detrimental. However, our data indicate that Hermes integrated more often in inter-genic regions because these sequences lack nucleosomes, and sequences with low nucleosome occupancy were fa-vored targets of integration. The nucleotide frequencies of sequencesflanking insertion sites inS. pombe exhibited an unusual oscillation of A/T content with a wavelength of 150 bp (Figure 2A). Insertion numbers peaked in spaces between positioned nucleosomes and in the nucleosome-free regions at the TSSs upstream of ORFs (Figure 3, B and C). We
suggest this pattern arises because nucleosomes occlude Hermes integration. A similar proposal was made for Hermes integration in S. cerevisiaewhere insertions were strongly associated with nucleosome-free regions (Gangadharanet al.2010).
The nucleotide content downstream of the insertions generated in vivoexhibited an unusual bias favoring T that extended as far as 3000 bp (Figure 2C). The same 3000-bp bias was observed when we analyzed the MRC set that oc-curred in regions upstream of ORFs. This caused us to eval-uate the A/T content of sequences upstream of ORFs and led to the surprisingfinding that for.500 bp upstream of ORFs the average nucleotide frequency of T is higher than A (Figure S5A). This appears to be an unusual structure for a genome as it did not exist inS. cerevisiaeor in the genomes of other organisms we examined (Figure S6A and data not shown).
The high activity of Hermes inS. pombeand its ability to disrupt ORFs resulted in integration densities that were
suf-ficient in most cases to distinguish between essential and nonessential ORFs. Recently published experiments with prokaryotic transposons demonstrated that dense integra-tion maps can identify essential genes of bacteria (Gawronski
et al. 2009; Langridge et al.2009; van Opijnenet al. 2009;
Christen et al. 2011). It is our application of the Hermes transposon that now makes this approach possible in a eukaryotic system.
After 80 generations of cell division, the pool ofS. pombe
cells with a Hermes insertion contained few disruptions of essential ORFs. However, there was a set of 50 ORFs with high densities of integration that were designated essential. In a sample of four of these genes, we confirmed their es-sential status (Figure 6A). We noted that many genes in this set were important for mitochondrial function (Table S1). The high amount of mitochondrial protein in cells suggested the possibility that these essential ORFs had many insertions because after these genes were disrupted, cells grew for many generations before their gene product was depleted. This idea was supported by our study of four of these dele-tions where we found that strains grew for many more gen-erations after these essential genes were removed (Figure 6B). While large pools of proteins make it difficult to detect their essential function using integration profiling, the num-ber of genes expressing such large pools is a small percent-age of the entire gene set of S. pombe.
Integration profiling provided a means of determining which genes are essential, independent of the deletion method used by the consortium (Kim et al. 2010). Of the ORFs that had low densities of integration, we found a sur-prising number had been designated nonessential by the
consortium. PCR and/or DNA blot assays of 77 ORFs revealed that at least 40% of these strains retained a copy of the ORF that was targeted for deletion. This result and the finding that many of these genes are known to be es-sential in other organisms led us to conclude that these ORFs with low integration densities are essential. We found that ORFs targeted for deletion were more likely to be retained if the ORF had low amounts of Hermes integration. Using a linear regression of the integration densities we pro-ject that 300 ORFs thought to be nonessential were not successfully deleted in the deletion collection. The consor-tium determined which genes are essential by deleting one copy of an ORF in a diploid and following sporulation, test-ing whether haploids with the deletion are viable. Deletion of an essential ORF creates strong selection for suppressor mutations or chromosomal rearrangements that produce an ectopic copy of the gene. We believe this has happened with many of the deletion strains either in the haploid, the dip-loid, or during meiosis. An analysis of theS. cerevisiae col-lection of deletions revealed that8% of the genes deleted were nevertheless present in aneuploid or rearranged chro-mosomes (Hugheset al.2000). Since these types of genetic alterations led to mistaken predictions of essentiality in both theS. cerevisisaeandS. pombedeletion sets it is clear that there is a need for an independent method for establishing which genes are essential. Integration profiling is such an independent method for reliably identifying essential genes. One significant advantage of integration profiling is that it also can identify which nonessential genes make important contributions to growth. The intermediate integration levels of ORFs that, while not essential, contributed significantly to colony growth indicates that integration densities can be a measure of function even for nonessential genes. As a re-sult, the capacity of integration profiling to document inter-mediate contributions to growth allows for a more accurate estimate of gene function than the designations of essential and nonessential.
Although we have validated this application of integration profiling under ideal growth conditions, it is clear that the method can be readily adapted to measure gene contribution to a wide variety of processes such as responses to environmental stress, repair of DNA damage, or viability during long periods of quiescence. Integration profiling can also be applied to identify gene interactions in a“synthetic lethal”approach by conducting integration in strains that have mutations of interest. As se-quencing technology continues to improve, integration profiling will also have applications in organisms with more complex genomes, in the identification of genes that can be
haploinsuf-ficient or dominant negative. Such approaches in cultured cells will have important applications in the identification of disease pathways and physiological systems.
Acknowledgments
We thank Jacqueline Hayles for kindly sharing data on the colony size of the strains with gene deletions. This research
Figure 7 PCR assays of deletion strains revealed some genes had not been successfully removed. (A) A collection of 77 representative strains each said by the consortium (Kim et al. 2010) to carry a deletion of a nonessential ORF was assayed by PCR with two pairs of primers to determine whether the ORF sequences were present. (B) The ORFs
de-fined by the consortium to be nonessential were divided into six bins based on their densities of integration. The number of ORFs tested in each bin was designated N. To be conservative the deletions were clas-sified as successful if neither of the PCR products produced by the wild-type strain were generated by the deletion strain. The percentage of ORFs in each group that was successfully deleted is shown.
was supported by the Intramural Research Program of the National Institutes of Health (NIH) from the Eunice Kennedy Shriver National Institute of Child Health and Human Development and by the Intramural Program of the National Cancer Institute. The work by S.G. and N.L.C. was supported by NIH grant RO1GM076425.
Literature Cited
Ben-Aroya, S., C. Coombes, T. Kwok, K. A. O’Donnell, J. D. Boeke et al., 2008 Toward a comprehensive temperature-sensitive mutant repository of the essential genes of Saccharomyces cer-evisiae. Mol. Cell 30: 248–258.
Brass, A. L., D. M. Dykxhoorn, Y. Benita, N. Yan, A. Engelmanet al., 2008 Identification of host proteins required for HIV infection through a functional genomic screen. Science 319: 921–926. Christen, B., E. Abeliuk, J. M. Collier, V. S. Kalogeraki, B. Passarelli
et al., 2011 The essential genome of a bacterium. Mol. Syst. Biol. 7: 528.
Dutrow, N., D. A. Nix, D. Holt, B. Milash, B. Dalley et al., 2008 Dynamic transcriptome of Schizosaccharomyces pombe shown by RNA-DNA hybrid mapping. Nat. Genet. 40: 977–986. Evertts, A. G., C. Plymire, N. L. Craig, and H. L. Levin, 2007 The hermes transposon of Musca domestica is an efficient tool for the mutagenesis of Schizosaccharomyces pombe. Genetics 177: 2519–2523.
Forsburg, S. L., and N. Rhind, 2006 Basic methods for fission yeast. Yeast 23: 173–183.
Gangadharan, S., L. Mularoni, J. Fain-Thornton, S. J. Wheelan, and N. L. Craig, 2010 Inaugural Article: DNA transposon Hermes inserts into DNA in nucleosome-free regions in vivo. Proc. Natl. Acad. Sci. USA 107: 21966–21972.
Gawronski, J. D., S. M. Wong, G. Giannoukos, D. V. Ward, and B. J. Akerley, 2009 Tracking insertion mutants within libraries by deep sequencing and a genome-wide screen for Haemophilus genes required in the lung. Proc. Natl. Acad. Sci. USA 106: 16422–16427.
Guo, Y., and H. L. Levin, 2010 High-throughput sequencing of retrotransposon integration provides a saturated profile of tar-get activity in Schizosaccharomyces pombe. Genome Res. 20: 239–248.
Haffter, P., and T. D. Fox, 1992 Nuclear mutations in the petite-negative yeast Schizosaccharomyces pombe allow growth of cells lacking mitochondrial DNA. Genetics 131: 255–260. Holman, A. G., and J. M. Coffin, 2005 Symmetrical base
prefer-ences surrounding HIV-1, avian sarcoma/leukosis virus, and murine leukemia virus integration sites. Proc. Natl. Acad. Sci. USA 102: 6103–6107.
Hughes, T. R., C. J. Roberts, H. Dai, A. R. Jones, M. R. Meyeret al., 2000 Widespread aneuploidy revealed by DNA microarray ex-pression profiling. Nat. Genet. 25: 333–337.
Kim, D. U., J. Hayles, D. Kim, V. Wood, H. O. Park et al., 2010 Analysis of a genome-wide set of gene deletions in the fission yeast Schizosaccharomyces pombe. Nat. Biotechnol. 28: 617–623.
Konig, R., Y. Zhou, D. Elleder, T. L. Diamond, G. M. Bonamyet al., 2008 Global analysis of host-pathogen interactions that regu-late early-stage HIV-1 replication. Cell 135: 49–60.
Langmead, B., C. Trapnell, M. Pop, and S. L. Salzberg, 2009 Ultrafast and memory-efficient alignment of short DNA sequences to the human genome. Genome Biol. 10: R25. Langridge, G. C., M. D. Phan, D. J. Turner, T. T. Perkins, L. Parts
et al., 2009 Simultaneous assay of every Salmonella Typhi gene using one million transposon mutants. Genome Res. 19: 2308–2316.
Lantermann, A. B., T. Straub, A. Stralfors, G. C. Yuan, K. Ekwall et al., 2010 Schizosaccharomyces pombe genome-wide nucle-osome mapping reveals positioning mechanisms distinct from those of Saccharomyces cerevisiae. Nat. Struct. Mol. Biol. 17: 251–257.
Maertens, G. N., S. Hare, and P. Cherepanov, 2010 The mecha-nism of retroviral integration from X-ray structures of its key intermediates. Nature 468: 326–329.
Park, J. M., A. G. Evertts, and H. L. Levin, 2009 The Hermes transposon of Musca domestica and its use as a mutagen of Schizosaccharomyces pombe. Methods 49: 243–247.
Sikorski, R. S., and J. D. Boeke, 1991 In vitro mutagenesis and plasmid shuffling: from cloned gene to mutant yeast. Methods Enzymol. 194: 302–318.
van Opijnen, T., K. L. Bodi, and A. Camilli, 2009 Tn-seq: high-throughput parallel sequencing forfitness and genetic interac-tion studies in microorganisms. Nat. Methods 6: 767–772. Wang, G. P., A. Ciuffi, J. Leipzig, C. C. Berry, and F. D. Bushman,
2007 HIV integration site selection: analysis by massively par-allel pyrosequencing reveals association with epigenetic modifi -cations. Genome Res. 17: 1186–1194.
Winzeler, E. A., D. D. Shoemaker, A. Astromoff, H. Liang, K. Anderson et al., 1999 Functional characterization of the S. cerevisiae ge-nome by gene deletion and parallel analysis. Science 285: 901–906. Wood, V., R. Gwilliam, M. A. Rajandream, M. Lyne, R. Lyneet al., 2002 The genome sequence of Schizosaccharomyces pombe. Nature 415: 871–880.
Yamane, K., T. Mizuguchi, B. Cui, M. Zofall, K. Noma et al., 2011 Asf1/HIRA facilitate global histone deacetylation and associate with HP1 to promote nucleosome occupancy at het-erochromatic loci. Mol. Cell 41: 56–66.
Zhou, H., M. Xu, Q. Huang, A. T. Gates, X. D. Zhang et al., 2008 Genome-scale RNAi screen for host factors required for HIV replication. Cell Host Microbe 4: 495–504.
Zhou, L. Q., R. Mitra, P. W. Atkinson, A. B. Hickman, F. Dydaet al., 2004 Transposition of hAT elements links transposable ele-ments and V(D)J recombination. Nature 432: 995–1001.
GENETICS
Supporting Information http://www.genetics.org/lookup/suppl/doi:10.1534/genetics.113.152744/-/DC1
Integration Pro
fi
ling of Gene Function With Dense
Maps of Transposon Integration
Yabin Guo, Jung Min Park, Bowen Cui, Elizabeth Humes, Sunil Gangadharan, Stevephen Hung, Peter C. FitzGerald, Kwang-Lae Hoe, Shiv I. S. Grewal, Nancy L. Craig, and Henry L. Levin
Figure S1 The percentage of cells with an insertion was measured during prolonged growth in liquid culture. After 74 generations 13.4% of the cells expressing the transposase contained an insertion (Pink). Cells in a control culture did not express the transposase (Blue).
0 2 4 6 8 10 12 14
0 10 20 30 40 50 60 70
T
ra
n
s
p
o
s
it
io
n
(
%
)
Cell generations
+transposase -transposase
Y. Guo et al. 3 SI
Figure S2 The average nucleotide frequencies flanking the insertion sites were determined. All Hermes insertions were aligned and the nucleotide patterns were analyzed by sequence logo created by a program written in Visual Basic based on an existing algorithm (Schneider and Stephens, 1990). The positions of the eight nucleotides at the target sites that are duplicated during integration are indicated by TSD. The nucleotide preferences for the in vivo
integration sites are shown in (A) and the in vitro integration sites are shown in (B).
Figure S3 The average nucleotide frequencies were determined for the positions on either side of the in vitro
insertion sites. The insertion sites were aligned and the nucleotide frequencies were calculated for a window that extended 1.5 kb on both sides.
Frequency of nucleotides surrounding in vitro integrations sites
Y. Guo et al. 5 SI
Figure S4 The average nucleotide frequencies were determined for the positions on either side of the in vivo
Y. Guo et al. 7 SI
File S1
Materials and Methods
Plasmid constructs
The donor plasmid (pHL2577) and expression plasmid (pHL2578) have been previously described and are listed in Table S6. The Ura-marked donor plasmid consists of the KanMX6 gene cloned between the Hermes TIRs. The Leu-marked expression plasmid contains the Hermes transposase gene driven by the Rep81x nmt1 promoter.
The plasmid pHL2806 was created by combining the HindIII fragment of pHL2578 containing LEU2 with the HindIII fragment of pON177 in order to replace the URA3 marker of pON177 with LEU2.
To generate the plasmids for the essentiality test, the DNA fragments encoding mmf1, mrpl16, mrpl19, and SPBC2d10.08c were amplified by PCR using genomic DNA from YHL912 as a template and the primers in Table S7. Each PCR reaction consisted of 5 μL 10X Pfx amplification buffer, 1.5 μL 10 mM dNTPs, 1 μL 50 mM MgSO4, 1.5 μL primer mix (10 μM each), 100 ng template DNA, 0.4 μL Platinum Pfx DNA polymerase (2.5 U/μL), and water to 50 μL. The thermocycling conditions were as follows: 94ºC 2 min, 25-35x [94ºC 15 sec, 55ºC 30 sec, 68ºC for 1 minute per kb], 72ºC 10 min, hold 4ºC. The products were purified on Qiagen PCR purification columns and cloned into pCR 2.1-TOPO (Invitrogen) following manufacturer’s instructions. The constructs were then digested with SalI and XhoI (NEB) (SPBC2d10.08c) or with XhoI and SacI (NEB) (mmf1, mrpl16, and mrpl19) to isolate the PCR gene inserts. The gene inserts were then cloned into pHL2612 to generate the deletion plasmids listed in Table S6.
Generating a library of Hermes insertions
A single colony from YHL9609 was used to inoculate a 5 mL starter culture of EMM-Leu-Ura+B1 that was grown for 16 hours at 32ºC and ~200 rpm. The culture was then pelleted at 3,000 rpm for 5 minutes and washed three times with 50 mL EMM-Leu-Ura-B1 to remove any traces of thiamine. The pellet was resuspended in 2 ml of the same media and the OD600 of the culture was measured. These measurements were used to calculate the volume of cells needed to inoculate 50 ml EMM-Leu-Ura-B1 at OD600=0.05. The absence of thiamine from this culture induced transcription of the Hermes transposase enzyme and initiated transposition. This culture was grown to OD600 =5, and was used to inoculate a new series of cultures at OD600=0.05. The serial passaged cultures were continued until the percent of cells with integration reached 13%, or about 80 generations of cell division. In all, it took a series of 12 sequential cultures for the strain to reach this point.
The final 50 ml culture was used to inoculate 500 ml of EMM+Leu+Ura+B1+FOA at OD600=0.25 to select against the donor plasmid. The cultures were grown for 4 days until an OD600 of 3 was reached. The EMM+FOA culture was pelleted, washed, and used to inoculate 500 mL YES+FOA+G418 at OD600=0.5 to select cells with Hermes insertions. The YES+FOA+G418 culture was grown for 48 hours to an OD600 of 10.
To measure transposition frequencies over the course of serial passaging, cells from cultures that reached OD600=5 were used to make a series of five 10-fold dilutions, starting at 108 cells/ml and ending with 104 cells/ml.
Y. Guo et al. 9 SI To confirm that the majority of the cells lacked the donor plasmid and contained a Hermes integration event following growth in YES+FOA+G418 cultures, cells from the final YES+FOA+G418 cultures were plated as above, but on EMM complete and EMM-Ura. The percentage of cells retaining the donor plasmid was calculated by dividing the number of colonies on EMM -Ura by the number of colonies on EMM complete.
The protocol that follows below describes methods to prepare Hermes insertion libraries for high-throughput Illumina sequencing.
Genomic DNA extraction
The final 500 ml YES+FOA+G418 liquid culture was spun down at 3,000 rpm for 5 minutes. The pellet of cells was resuspended in 35 ml of Sp1 (1.2 M sorbitol, 50 mM citric acid monohydrate, 50 mM Na2HPO4*7H20, and 40 mM EDTA, pH 5.6) containing 105 mg Zymolyase 100T (Seikagaku) previously dissolved. Cells were incubated at 37ºC for 1-2 hours with gentle shaking. The cells were pelleted and resuspended in 105 mL of 5X TE and 1% SDS. Cells were incubated at 25ºC for 1 hour and then at 65ºC for five minutes. After this point, 35 ml of 5M KOAc was added to the mixture, and the cells were incubated on ice for 30 minutes. The cells were centrifuged for 15 min at 4200 rpm in an SS34 rotor, and an equal volume of ice-cold isopropanol was added to the supernatant. The mixture was placed at -20ºC overnight. The mixture was then centrifuged at 8000 rpm in an SS34 rotor for 10 minutes. The DNA pellet was resuspended in 21 ml of 5X TE, and RNaseA (Qiagen) was added to a final concentration of 100 μg/ml. The solution was incubated at 37ºC for 1-2 hours. Three phenol extractions and one phenol/chloroform/isoamyl alcohol extraction were performed to remove proteins. The nucleic acids were precipitated using 1/10 volume of 5 M NaCl and 2.5 volumes of 100% ethanol. The pellet was washed with 14 ml 70% ethanol, air dried, and resuspended in 300 μL 1X TE. The yield was approximately 100 µg.
Restriction endonuclease digestion
Genomic DNA was digested with MseI in a series of 6 duplicate digests. Each digest consisted of 1-2 μg DNA, 10 μl 10X NEB Buffer #2, 1 μL 100X BSA (NEB), 3 μl MseI (10U/μl, NEB), and water to 100 μl. The digests were incubated at 37ºC for 16 hours, followed by purification of each digest on a Qiagen PCR purification column. DNA was serially eluted from each column with a total of 150 μl EB.
Linker ligation
This step ligates MseI compatible ends of digested genomic DNA to linkers containing MseI restriction-site overhangs. Linkers were prepared by mixing equal amounts of HL1870 and HL1871 at a concentration of 10 μM in PCR buffer. For linker annealing, the mixture was denatured for 1 minute at 95ºC in a PCR machine, and the temperature was decreased to 80ºC for 7 minutes, and continued decrease by 10ºC every 7 minutes until 20ºC. The mixture was stored at -20ºC when not in use.
PCR amplification of Hermes insertion sites
This step uses the linker-ligated genomic DNA fragments as templates for PCR amplification of genomic sequences flanking Hermes integration sites. A series of 40 PCR reactions were carried out in a 96-well plate. Each reaction consisted of 8 μl linker ligation template, 5 μl 10X PCR buffer, 1 μl dNTPs (10 mM), 1 μl LTR primer (10 μM, HL2215), 1 μl linker primer (10 μM, HL2216), 1 μl 50X Titanium Taq polymerase (Clontech), and water to 50 μl. Amplification was performed with the following cycling conditions: 94ºC 1 min, 6x [94ºC 15 sec, 65ºC 30 sec, 72ºC 30 sec], 24x [94ºC 15 sec, 60ºC 30 sec, 72ºC 30 sec], 72ºC 10 min, hold 4ºC.
Gel extraction and purification
Following amplification, PCR reactions were pooled and purified on 6 Qiagen PCR purification columns. The DNA was eluted in 400 μl EB and the entire volume of eluate was loaded in 1 lane (tape together multiple wells to create one large lane) of a 2% low melting point agarose, 1X TAE gel and run a few cm at 80V, next to a 100 bp DNA size standard for size reference. The DNA from 150-500 bp was excised with a clean razor blade and extracted using the Qiagen Gel purification kit following manufacturer’s instructions. The DNA was eluted with 500 μL EB and extracted with one phenol extraction, one phenol:chloroform:isoamyl alcohol extraction, and one final chloroform extraction, using a 1:1 volume for each extraction. The products were purified on one Qiagen PCR purification column and eluted in 70 μl TE. DNA was quantified with a Quant-iT PicoGreen Fluorescence kit for dsDNA (Invitrogen).
Illumina sequencing
The DNA samples were sequenced by the Illumina Fast Track Sequencing Service in Hayward, California. The
sequence reads were 50 nt in length. The raw sequences for the in vitro and in vivo inserts were deposited in the SRA database of Genbank with accession number SRA043841.1.
Genomic resources
All genomic resource data of S. pombe used in this study was downloaded from the Wellcome Trust Sanger Institute (ftp://ftp.sanger.ac.uk/pub/yeast/pombe/). The chromosome contigs are the Aug. 2007 version. The CDS coordinates are the Feb. 2009 version. The UTR data was extracted from the .embl files of 20110204 version. Mapping Hermes integration sites on the genome of S. pombe.
Y. Guo et al. 11 SI Matched random control (MRC)
For each Hermes insertion site, the distance between the integration site and the responsible MseI site (d) was calculated. Then another MseI site coordinate (m) was randomly chosen from the S. pombe genome. Then m+d or m-d was taken as an MRC site. To “add” or “subtract” was also randomly determined. Thus, the MRC dataset has the same size as the experimental integration dataset and matches the distances to MseI sites.
General bioinformatic analysis and programming
The scripts for screening the raw sequences, filtering the BLAST outputs, extracting features from .embl files, determining the locations of Hermes insertion according to chromosomal features, generating MRC and other analyses were written in Perl or Ruby programming languages.
Nucleosome DNA preparation and sequencing
Nucleosomal DNA was prepared as described previously (YAMANE et al. 2011), and DNA samples were
sequenced by using the Illumina sequencing protocol. Bowtie (LANGMEAD et al. 2009) was used to map the Illumina sequencing reads, trimmed to 25 bp of high quality reads, against the reference genome allowing for 2 mismatches. The mapped data was filtered to remove all sequences that mapped to more than a single location. The end positions of the reads were aligned relative to the center of the nucleosome by shifting the plus strands reads by +73 bp and the minus strand reads by -73 bp. The final nucleosome maps were produced by applying gaussian smoothing to the raw data in order to reduce noise. More detailed methodology will be described in a forthcoming manuscript on the genome wide mapping of nucleosomes in S. pombe.
Essentiality Test
To test the viability of four representative Bioneer strains heterozygous for deletions in nuclear-encoded mitochondrial genes designated as essential, we performed a plasmid shuffle assay. Following transformation with both the plasmids encoding the deleted genes and pHL2806 (needed to allow sporulation), the diploid strains carrying the plasmid with the deleted genes were sporulated by inoculating them at OD600=0.05 in 200 μl of low nitrogen media, and incubating them for 3 days at 25ºC in a rotating wheel. Low nitrogen media is identical to EMM media, except with 1g/l glutamic acid in place of NH4Cl. The cells were then pelleted and resuspended in water to OD600=0.1, and 20 μl of a 10-fold diluted stock of glusulase (PerkinElmer) was added to the mixture. The mixtures were allowed to incubate overnight at 32ºC in a rotating wheel. The cells were then pelleted, resuspended in 300 μl of 30% ethanol, and incubated for 30 minutes at 25ºC. Subsequently, the cells were pelleted, resuspended in 100 μl of water, plated on YES+G418 to select for haploid cells containing the KanMX6 deletion cassette, and grown for 3 days at 32ºC.
Gene essentiality was tested on solid media by patch assays and drop assays. For each patch assay, 15 cells from the spore germination plates were colony purified on YES+G418 plates and then patched to YES master plates that were grown at 32ºC for 2 days. These master plates were replica printed to YES+FOA plates (to select against the deletion plasmid) and grown at either 32ºC or 37ºC for 46 hours.
Table S1
Gene Gene function integration/kb/million insertions
SPBC21C3.10c 5-amino-6-(5-phosphoribosylamino) uracil reductase 161.5
tim10 SPAC222.03c Tim9-Tim10 complex subunit Tim10 (predicted) 130.2
mrpl16 SPBC1105.03c mitochondrial ribosomal protein subunit L16 128.4
SPBP8B7.05c carbonic anhydrase (predicted) 124.5
SPBC2D10.08c mitochondrial ribosomal protein subunit Yml6 123.5
mrpl31 SPCC16A11.11 mitochondrial ribosomal protein subunit L31 111.6
ste11 aff1 stex SPBC32C12.02 transcription factor Ste11 108.4
SPAC1486.07c mrpl19 mitochondrial ribosomal protein subunit L19 102.0
SPCC1672.01 histidinol-phosphatase (predicted) 100.8
SPCC2H8.04 sequence orphan 99.4
met9 met5 SPAC56F8.10 methylenetetrahydrofolate reductase Met9 94.9
SPAC17H9.07 signal recognition particle subunit Srp21 (predicted) 94.6
tpx1 SPCC576.03c thioredoxin peroxidase Tpx1 86.2
vph2 SPCC757.10 endoplasmic reticulum membrane involved in assembly of the V-ATPase 84.5
ups1 ups SPAC31G5.08 uroporphyrinogen-III synthase Ups1 80.7
mmf1 pmf1 SPBC2G2.04c YjgF family protein Mmf1 79.4
grx4 SPBC26H8.06 glutaredoxin Grx4 79.3
SPAC30C2.03 sequence orphan 78.9
SPBC2A9.10 Bin3 family 78.4
SPAC12B10.02c sequence orphan 78.4
mrp10 SPAC24C9.13c mitochondrial ribosomal protein subunit Mrp10 78.0
SPBC3B9.14c mrpl3 mitochondrial ribosomal protein subunit L3 77.3
SPCC1682.09c guanine nucleotide transporter 74.1
SPAC1002.16c nicotinic acid plasma membrane transporter (predicted) 74.0
SPAC688.09 mitochondrial pyrimidine nucletide transporter (predicted) 70.9
SPBC577.09 ERCC-8 DNA repair homolog (predicted) 70.3
SPAC17G8.02 uridine ribohydrolase (predicted) 69.8
SPAC31G5.06 mitochondrial protein 69.8
dea2 SPBC1198.02 adenine deaminase Dea2 67.8
SPCC63.10c dolichol kinase (predicted) 67.4
SPAC24C9.06c aconitate hydratase 66.5
SPBC354.06 mrps16 mitochondrial ribosomal protein subunit S16 65.5
SPBP4H10.15 aconitate hydratase/mitochondrial ribosomal protein subunit L49, fusion protein 64.9
bet5 SPAC688.15 SPAC3G9.16c TRAPP complex subunit Bet5 (predicted) 64.6
usp103 yhc1 SPBP35G2.09 U1 snRNP-associated protein Usp103 (predicted) 63.6
crk1 mop1 mcs6 SPBC19F8.07 cyclin-dependent kinase activating kinase Crk1 63.3
SPAPB17E12.09 sequence orphan 63.2
mrp20 SPAC31A2.08 mitochondrial ribosomal protein subunit L23 (predicted) 62.8
fta3 SPBP8B7.12c sma3 Sim4 and Mal2 associated (4 and 2 associated) protein 3 62.8
SPBC887.07 mrpl38 mitochondrial ribosomal protein subunit L38 62.7
SPBC2F12.10 mitochondrial ribosomal protein subunit L35 62.3
SPCC4B3.09c mitochondrial ribosomal protein subunit L12 62.1
SPAPB24D3.06c DUF1749 family protein 61.3
SPBC119.18 mitochondrial distribution and morphology protein Mdm35 (predicted) 61.2
SPBC17G9.13c sequence orphan 61.1
SPAC2F7.15 rsm24 mitochondrial ribosomal protein subunit S24 (predicted) 60.9
SPBC16H5.15 conserved fungal protein 60.9
SPCC1393.11 mitochondrial ribosomal protein subunit L20 60.7
sum2 SPBC800.09 G2/M transition checkpoint protein Sum2 60.6
alr2 SPBC359.02 alanine racemase Alr2 59.8
SPAC3A12.19 mitochondrial ribosomal protein subunit L27 59.4
Y. Guo et al. 13 SI
Table S2 The levels of integration for each ORF of the genome