Cholinergic dysfunction in diseases
with Lewy bodies
P. Tiraboschi, MD; L.A. Hansen, MD; M. Alford, BA; M.N. Sabbagh, MD; B. Schoos, DO; E. Masliah, MD;
L.J. Thal, MD; and J. Corey-Bloom, MD, PhD
Article abstract—Objective:To evaluate cholinergic activity in diseases with Lewy bodies (LB; LB variant of AD [LBV], diffuse LB disease [DLBD], and Parkinson’s disease [PD]) to determine if 1) AD changes are requisite to cholinergic dysfunction, 2) cholinergic activity declines to the same extent in neocortical and archicortical areas, and 3) cholinergic loss is influenced by APOE genotype. Background: Like AD, diseases with LB are associated with decreased choline acetyltransferase (ChAT) activity. IncreasedAPOEe4 allele frequency has been reported in LBV. WhetherAPOE geno-type affects cholinergic function in LBV remains unclear. Methods: An autopsy series of 182 AD (National Institute on Aging and Consortium to Establish a Registry for Alzheimer’s Disease criteria), 49 LBV, 11 PD, 6 DLBD, and 16 normal control (NC) subjects. APOE genotype and ChAT activity (nmol/h/100 mg) in the midfrontal and hippocampal cortices were determined.Results:Mean midfrontal ChAT activity was markedly reduced in diseases with LB (LBV: 53.3639.0; PD: 54.8635.7; DLBD: 41.3624.8) compared to NC (255.46134.6;p,0.001) and AD (122.6678.9;p,0.05). Among diseases with LB, midfrontal ChAT activity was decreased to a similar extent in patientswith(LBV) andwithout(DLBD and PD) AD pathology. Although mean ChAT activity for LBV was less than half that for AD in the midfrontal cortex, it was similar to that for AD in the hippocampus (LBV: 243.56189.7; AD: 322.86265.6;p.0.05). However, hippocampal ChAT activity for both AD and LBV was lower than that for NC (666.56360.3;p,0.001). Thee4 allele dosage did not influence midfrontal ChAT activity in LBV.Conclusions:Marked losses in midfrontal ChAT activity occur in diseases with LB, independent of coexistent AD changes. A greater midfrontal, as opposed to hippocampal, cholinergic deficit may differentiate LBV from AD. The lack of a relationship between e4 allele dosage and midfrontal ChAT activity suggests that other factors may play a role in its decline in LBV.Key words:Cholinergic dysfunction—Lewy body disease—APOE—AD. NEUROLOGY 2000;54:407–411
Decrements in choline acetyltransferase (ChAT)
ac-tivity have been found in AD,
1AD with Lewy bodies
(LB; LB variant of AD [LBV]),
2,3and, irrespective of
presence of dementia, Parkinson’s disease (PD).
2,4Marked reductions are also likely to occur in pure
diffuse LB disease (DLBD), but the extent to which
ChAT activity declines in this disorder has been less
clearly defined, primarily owing to heterogeneity of
patient samples.
5,6The primary anatomic
explana-tion for this reduced cholinergic activity has been
reported to be loss of neurons in the basal forebrain,
especially in the nucleus basalis of Meynert (nbM).
7,8Although correlations between ChAT activity and
global measures of cognitive impairment have been
found in both AD
9,10and LBV,
2,6more extensive
neo-cortical cholinergic deficits may differentiate LBV
from AD
2-4,11and possibly contribute to its
character-istic clinical profile.
11In particular, it has been
hy-pothesized that the higher prevalence of psychotic
symptoms (visual hallucinations and delusions) and
severe visuospatial dysfunction reported for LBV
12,13may be related to greater reductions in ChAT
activ-ity in the temporal and parietal cortices,
respective-ly.
11Due to this remarkable cholinergic hypoactivity,
it has also been suggested that LBV may respond
more positively than AD to cholinergic therapy.
2,12Both AD and LBV are associated with an increased
frequency of the
APOE
e
4 allele.
14,15Although it has
been proposed that the number of
e
4 allele copies may
influence cholinergic dysfunction in AD,
16whether this
occurs in LBV has not been carefully examined. In
addition to a possible relationship between midfrontal
(MF) cholinergic losses and
APOE
genotype, we also
investigated whether hippocampal (Hip), in addition to
MF, cholinergic deficit differentiated LBV from AD.
Our principal objective, however, was to evaluate
ChAT activity not only in LBV, but also in other
dis-eases with LB (DLBD, PD) to determine whether
con-comitant AD changes (present in LBV alone) were
requisite to MF cholinergic dysfunction.
See also page 403
From Neurologia Prima (Dr. Tiraboschi), Ospedali Riuniti, Bergamo, Italy; the Department of Neurosciences (Drs. Hansen, Sabbagh, Masliah, Thal, and Corey-Bloom, and M. Alford), University of California, San Diego, La Jolla; and Neurology Service (Drs. Sabbagh, Schoos, Thal, and Corey-Bloom), VA Medical Center, San Diego, CA.
Supported by NIA AG05131.
Received April 1, 1999. Accepted in final form August 21, 1999.
Address correspondence and reprint requests to Dr. Jody Corey-Bloom, Neurology Service (9127), VA Medical Center, 3350 La Jolla Village Dr., San Diego, CA 92161; e-mail: [email protected]
Methods. Subjects. Most of the patients in the current study were followed clinically at the University of Califor-nia, San Diego (UCSD), Alzheimer’s Disease Research Center (ADRC), Senior’s Only Care, or in the private prac-tices of its senior clinicians. They represent all patients who have come to autopsy between 1985 and the present with a neuropathologic diagnosis of AD, LBV, DLBD, or PD, or normal controls (NC) for whom apoE genotype or ChAT activity were available. There were 182 AD, 49 LBV, 11 PD, 6 DLBD, and 16 NC patients. All AD and LBV patients met both National Institute on Aging (NIA)17 cri-teria for a pathologic diagnosis of AD and Consortium to Establish a Registry for Alzheimer’s Disease (CERAD)18 criteria for definite or probable AD. They also met either Diagnostic and Statistical Manual of Mental Disorders, 3rd ed., revised (DSM-III-R)19criteria for a clinical diagno-sis of dementia or National Institute of Neurological and Communicative Disorders and Stroke–Alzheimer’s Disease and Related Disorders Association20criteria for probable or possible AD. In addition, the LBV group had concomitant LB in the brainstem, archicortex, and neocortex. Dementia in these patients preceded the occurrence of extrapyrami-dal signs. Most of these cases would be labeled by other investigators as combined AD and PD,21 AD with PD-related changes,22 or senile dementia of the LB type (SDLT).2
The PD group consisted of patients with clinically diag-nosed idiopathic PD whose brains showed neuronal loss and gliosis in subcortical nuclei—i.e., substantia nigra, lo-cus coeruleus, and nucleus basalis of Meynert—accompa-nied by single or multiple LB in surviving neurons. LB were also present in the archicortex and, although not invariably, in the neocortex. Neuropathologic features of AD were absent. In particular, plaques were not sufficient to meet NIA or CERAD criteria for a diagnosis of AD. Despite the lack of an obvious pathologic basis, all PD subjects also fulfilled DSM-III-R criteria for a clinical diag-nosis of dementia prior to death. Parkinsonism, however, was the presenting complaint.
The DLBD group consisted of patients with a clinical diagnosis of dementia according to DSM-III-R criteria and parkinsonism whose brains showed typical PD pathology accompanied by sparse or plentiful LB in the brainstem, archicortex, and neocortex, in the absence of significant AD changes. These subjects presented with a progressive dementing syndrome.
LBV, PD, and DLBD patients met the Consortium on Dementia with Lewy Bodies (DLB) criteria12 for a patho-logic diagnosis of DLB. No attempt was made to define subtypes on the basis of the relative distribution of LB in the brainstem, allocortical, and neocortical regions.
The NC group consisted of patients whose brains failed to meet NIA and CERAD criteria for AD and were consid-ered neuropathologically normal. Most of the NC had been evaluated on an annual basis through the UCSD ADRC and had been given a clinical diagnosis of NC.
Neuropathologic examination. Pathologic assessment was made by one observer (L.A.H.). Autopsy was per-formed within 8 hours of death using a protocol described by Terry et al.23The left hemibrain was fixed by immersion in 10% formalin for 5 to 7 days, at which time blocks were taken for paraffin embedding from MF, rostral superior temporal, and inferior parietal areas of neocortex, anterior
cingulate gyrus, posterior cingulate gyrus, anterior hip-pocampus, basal ganglia/substantia innominata, mesen-cephalon, and pons. The cortical areas correspond to Brodmann areas 46, 38, and 39. The paraffin blocks of neocortex were cut at 7-mm thickness for hematoxylin and eosin (H-E) staining for oversight purposes. Ten-mm–thick sections were made for thioflavin S stains. Total plaque, neuritic plaque, and neurofibrillary tangle counts were de-termined by the same examiner with the same criteria used consistently. Plaques were assessed with thioflavin S fluorescent microscopy. Each brain was staged for degree of neurofibrillary pathology according to a modification24of Braak and Braak’s criteria.25As recommended by the Con-sortium on DLB,12 subcortical LB were identified with H-E; cortical LB were detected by H-E or antiubiquitin immunostaining.
APOE genotyping. The APOEgenotype was extracted and determined in either peripheral blood samples or in postmortem brain tissue (by homogenizing 500 mg of fro-zen brain tissue over ice, adding lysis buffer and protein-ase K, and rocking overnight at 37 °C, followed by phenol/ chloroform extraction). Genomic DNA was amplified by polymerase chain reaction (PCR) using the primers pre-scribed by Wenham et al.26After amplification, DNA was digested with the Hha restriction enzyme, electrophoresed on 6% nondenaturing polyacrylamide gels, and visualized by ethidium bromide staining.
ChAT activity. Samples were taken from MF and Hip areas of frozen unfixed right hemibrain neocortex and ho-mogenized in 1 mM ethylenediamine tetraacetic acid, pH 7.0, containing 0.1% Triton X-100. Analysis of ChAT activ-ity (nmol/h/100 mg) was performed in triplicate by the modified Fonnum technique.27,28 The coefficient of varia-tion is 3% with an intra-assay variability of 7.9%.
Statistical analysis. Mean values among AD, LBV, PD, DLBD, and NC subjects and the three LBV genotypes (twoe4, onee4, and noe4) were compared using Kruskal-Wallis ANOVA. A nonparametric test was chosen because of small samples or significant differences among standard deviations. When a significant global result (p,0.05) was obtained, Kruskal-Wallis ANOVA was followed by Dunn’s multiple comparison test to compare each pair of means.
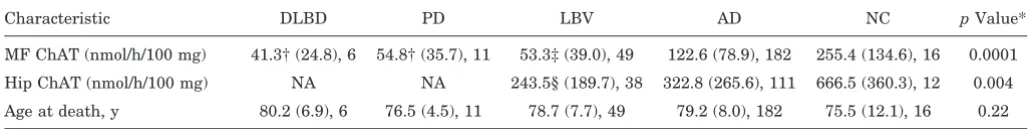
Results. As shown in table 1, mean MF ChAT activity was markedly reduced in diseases with LB (LBV: 53.3 6 39.0; PD: 54.8 6 35.7; DLBD: 41.3 6 24.8 ) compared to NC (255.4 6134.6;p ,0.001) and AD subjects (122.66 78.9; p , 0.05), despite similar ages at death. MF ChAT activity was actually lowest in DLBD; however, there were no statistically significant differences between this group and either PD or LBV.
Mean Hip ChAT activity (not available on PD and DLBD subjects) was reduced in LBV (243.5 6189.7) and AD (322.8 6 265.5) compared to NC (666.5 6 360.3;p5 0.004) subjects. In Hip, as opposed to MF cortex, there were no significant differences in ChAT activity between LBV and AD subjects.
LBV patients. Although ChAT activity was slightly lower in patients with two e4 alleles (e4/e4: 38.6 6 32.2), there were no statistically significant differences compared to those with one (e2/e4: 53.1637.9) or noe4 alleles (e2/e2: 46.9626.2). MF ChAT activity ofe4 carriers (50.9637.8, n532) was nearly identical to that of noncarriers (42.66 26.4, n513,p50.7). Mean age at death for LBV subjects with two e4 (72.8612.3 years), onee4 (79.067.8 years), and no e4 alleles (79.1 6 5.1 years) did not differ signifi-cantly. Neither did the duration of illness (e2/e2: 7.3 6 2.3; e2/e4: 8.3 6 3.6; e4/e4: 6.5 6 3.0) or age at onset (e2/e2: 72.865.7;e2/e4: 72.367.5:e4/e4: 66.0610.4).
Discussion.
The current findings suggest that,
ir-respective of clinical diagnosis, the occurrence of LB
in dementia is associated with a MF cholinergic
def-icit more extensive than that observed in AD. Among
diseases with LB, MF ChAT activity in patients
without
significant AD changes (DLBD and PD) was
similar to that found in those
with
significant AD
changes (LBV). Thus, LB pathology alone,
indepen-dent of coexistent AD, may be sufficient to cause
severe reductions in MF cholinergic levels.
Heterogeneity of patient samples is likely the
main reason for conflicting results previously
re-ported for DLBD, ranging from the observation of
lower ChAT activity in DLBD compared to AD
6to
that of similar levels in both conditions.
5Like
Sam-uel et al.,
6we reserved the designation of DLBD for
brains with subcortical and cortical LB lacking
con-comitant neocortical AD. In contrast, Dickson et al.
5have not made such a distinction, as most of the
“DLBD” cases in their report had variable degrees of
AD pathology, with 4 of 6 patients displaying enough
plaques to meet NIA neuropathologic criteria for AD
and one a substantial number of neocortical tangles.
In our series, designation of DLBD was reserved for
LB pathology alone; however, no distinctions were
made between cases with sparse or plentiful LB, and
some neocortical LB were also found, albeit not
in-variably, in PD. Therefore, DLBD and PD patients,
although different from each other in initial clinical
presentation (dementia in the former; parkinsonism
in the latter), were likely to be neuropathologically
indistinguishable.
All the LBV, PD, and DLBD cases in the current
study met the Consortium criteria for a pathologic
diagnosis of DLB.
12We emphasize that our brain
sampling procedures were consistent with those
rec-ommended by the Consortium on DLB
12; that the
current study stressed a qualitative (presence versus
absence of LB pathology) rather than a quantitative
distinction (frequency of LB), as the main objective
was to investigate if pure LB pathology was
suffi-cient to decrease cholinergic function.
Reduction in frontal ChAT activity was distinctly
greater in LBV than AD, a difference previously
ob-served in other studies,
3,6but not in those by Gibb et
al.
29and Perry et al.,
2,4,11in which frontal ChAT
losses in AD patients with or without LB were found
to be comparable. It is likely that the failure to
de-tect differences in these studies were due in part to
small sample sizes. Additionally, in the study by
Gibb et al.,
29the two cohorts were not matched for
age, which has been reported to influence cholinergic
function in AD markedly.
30The greater frontal ChAT
reduction found in our LBV cohort appears to be
Table 1Ages at death and choline acetyltransferase (ChAT) activities in our patient cohorts
Characteristic DLBD PD LBV AD NC pValue*
MF ChAT (nmol/h/100 mg) 41.3† (24.8), 6 54.8† (35.7), 11 53.3‡ (39.0), 49 122.6 (78.9), 182 255.4 (134.6), 16 0.0001
Hip ChAT (nmol/h/100 mg) NA NA 243.5§ (189.7), 38 322.8 (265.6), 111 666.5 (360.3), 12 0.004
Age at death, y 80.2 (6.9), 6 76.5 (4.5), 11 78.7 (7.7), 49 79.2 (8.0), 182 75.5 (12.1), 16 0.22
Values are mean (SD), n.
* Kruskal-Wallis ANOVA.
†p,0.05 Compared to AD;p,0.001 compared to NC (Dunn’s multiple comparisons test). ‡p,0.001 Compared to AD and NC (Dunn’s multiple comparisons test).
§p,0.001 Compared to NC (Dunn’s multiple comparisons test).
DLBD5diffuse Lewy body (LB) disease; PD5idiopathic PD; LBV5LB variant of AD; NC5normal controls; MF5midfrontal; Hip5hippocampal; NA5not applicable.
Table 2Clinical features and midfrontal (MF) choline acetyltransferase (ChAT) activity acrossAPOE«4 genotypes in Lewy body variant of AD
Characteristic Noε4 alleles Oneε4 allele Twoε4 alleles pValue*
MF ChAT (nmol/h/100 mg), mean (SD), n 46.9 (26.2), 13 53.1 (37.9), 27 38.6 (32.3), 5 0.72
Age at death, y, mean (SD), n 79.1 (5.1), 13 79.0 (7.8), 27 72.8 (12.3), 5 0.49
Age at onset, y, mean (SD), n 72.8 (5.7), 13 72.3 (7.5), 23 66.0 (10.4), 5 0.34
Duration, y, mean (SD), n 7.3 (2.3), 13 8.3 (3.6), 23 6.5 (3.0), 5 0.74
* Kruskal-Wallis ANOVA.
unrelated to the severity of AD pathology, as both
neuritic plaques
31and neurofibrillary tangles in the
neocortex are reduced in LBV compared to AD.
31-33In our series, although mean ChAT activity for
LBV was less than half that for AD in the frontal
cortex, it was similar in the hippocampus. In the
series by Perry et al.,
2,4,11in contrast, Hip ChAT
ac-tivity was significantly higher in LBV (designated as
SDLT) than AD. In addition, although parietal and
temporal ChAT activities in their studies were
greatly reduced in LBV as compared to AD patients,
frontal ChAT activity, as noted above, was similar in
the two cohorts. Despite such discrepancies, our
re-sults remain compatible with the hypothesis of Perry
et al. that neocortical, as opposed to archicortical,
cholinergic deficit differentiates LBV from AD and
may contribute to its characteristic clinical profile. In
this respect, our finding of a more extensive frontal
cholinergic deficit in LBV than AD may be
anatomi-cally consistent with the more “frontosubcortical”
pat-tern of cognitive impairment (prominent deficit in
executive function, attention, and verbal fluency)
re-ported for LBV.
13,34Although the condition of the basal forebrain was
not assessed, our observations support the idea that
LB, more profoundly than AD, pathology may affect
neocortical pathways projecting from the nbM, which
supplies the neocortex with most of its cholinergic
input. However, the extent of cholinergic deficit is
not necessarily predicted by degree of nbM
degener-ation. In fact, correlations between neuronal counts
in this nucleus and ChAT activities have been
re-ported for PD, but not consistently for AD.
8In
addi-tion, a greater decline in neocortical ChAT has been
found in LBV compared to AD patients,
2,4despite
similar numbers of neurons in nbM. It appears
therefore that the presence of LB pathology, in
addi-tion to nbM cell loss, contributes to funcaddi-tional
alter-ations in the cholinergic system in LBV, whereas
other factors, including the presence of neocortical
plaques and tangles, may play a more important role
in AD.
What also emerges from our findings is that, in
diseases with LB, coexistent AD pathology may not
be requisite either to neocortical cholinergic deficit or
to dementia. Although it has been previously
sug-gested that concomitant AD pathology is necessary
for dementia in PD,
35neuropathologic correlates of
cognitive decline in this disorder can be more
vari-able and complex. In the report of Hughes et al.,
36for
example, although a third of PD patients with
de-mentia had concomitant AD at autopsy, a fifth had
widespread neocortical LB, and most, like our cases,
displayed only the typical pathology of PD.
Consistent with other studies,
14,15the
APOE
e
4
allele was overrepresented in patients
with
(LBV
and AD) as opposed to those
without
(DLBD and PD)
AD pathology, in whom its frequency was
compara-ble to that observed in NC. This increased frequency
in LBV (41%) was similar to that measured for our
AD cohort (38%) and slightly higher than that
previ-ously found by Galasko et al.
14(29%) in a smaller
cohort of LBV patients from our institution. Because
the frequency of the
e
4 allele in diseases with LB
was increased only in the presence of concomitant
AD, its prevalence is likely associated with AD
rather than LB pathology.
Although the possible relationship between
APOE
genotype and cholinergic losses in AD has been
in-vestigated in several studies,
16,37,38only Morris et
al.
38have previously examined whether
APOE
geno-type influenced cholinergic function in DLB.
Utiliz-ing parietal cortex from a small sample of patients
(n
5
9) comparable to our LBV, these investigators
did not find a relationship between the presence of
the
e
4 allele and ChAT activity; however, owing to
the unavailability of homozygotes, the possible effect
of
e
4 allele dosage on cholinergic function could not
be evaluated. In the MF cortex of our large cohort of
LBV patients, cholinergic activity was lowest in
those with two
e
4 alleles, highest in those with one
e
4 allele, and intermediate between the two in
pa-tients with no
e
4 alleles; nevertheless, there were no
statistically significant differences across genotypes.
In addition, MF ChAT activity of
e
4 carriers was
nearly identical to that of noncarriers. This pattern
was similar to that found for the AD cohort (data not
presented), suggesting that factors other than
APOE
genotype are operative in MF cholinergic dysfunction
in AD
with
or
without
LB.
Finally, our findings may have therapeutic
impli-cations. It has been postulated that cholinergic
ther-apy can play a substantial role in LBV, as three
patients with combined AD/LB pathology and very
low neocortical ChAT activity were reported to be
positive responders in a tacrine treatment trial.
39There is also some evidence that cholinesterase
in-hibitors may have neuropsychiatric benefits,
40in-cluding reduction of agitation, delusions, and
hallucinations, which are seen in great frequency in
LBV.
12Moreover, increased muscarinic receptor
binding, possibly reflecting sparing of intracortical
neuronal systems, has been reported in LBV and PD,
but not AD.
4These observations raise the possibility
that cholinergic replacement therapy may be
partic-ularly effective in DLB patients, despite possible
worsening of extrapyramidal function. The risk/
benefit of cholinesterase inhibitors in DLB has not
been carefully studied. Ideally, this should be
as-sessed in well-designed pharmacologic trials;
never-theless, the difficulty in clinically differentiating
these disorders may raise major obstacles to their
feasibility. In clinical contexts, however, PD patients
with dementia, irrespective of further distinctions,
may be the best candidates for replacement
ergic therapy, in light of their remarkable
cholin-ergic losses, despite an absence of AD pathology.
Acknowledgment
References
1. Davies P, Maloney AJF. Selective loss of cholinergic neurons in Alzheimer’s disease. Lancet 1976;2:1403.
2. Perry EK, Marshall E, Perry RH, et al. Cholinergic and dopa-minergic activities in senile dementia of Lewy body type. Alz-heimer Dis Assoc Disord 1990;4:87–95.
3. Langlais PJ, Thal L, Hansen L, Galasko D, Alford M, Masliah E. Neurotransmitters in basal ganglia and cortex of Alzhei-mer’s disease with and without Lewy bodies. Neurology 1993; 43:1927–1934.
4. Perry EK, Irving D, Kerwin JM, et al. Cholinergic transmitter and neurotrophic activities in Lewy body dementia: similarity to Parkinson’s and distinction from Alzheimer’s disease. Alz-heimer Dis Assoc Disord 1993;7:69 –79.
5. Dickson DW, Davies P, Mayeux R, et al. Diffuse Lewy body disease: neuropathological and biochemical studies of six pa-tients. Acta Neuropathol 1987;75:8 –15.
6. Samuel W, Alford M, Hofstetter R, Hansen L. Dementia with Lewy bodies versus pure Alzheimer’s disease: differences in cognition, neuropathology, cholinergic dysfunction and syn-apse density. J Neuropathol Exp Neurol 1997;56:499 –508. 7. Whitehouse PJ, Price DL, Clark AW, et al. Evidence for
selec-tive loss of cholinergic neurons in the nucleus basalis. Ann Neurol 1981;10:122–126.
8. Perry EK, Curtis M, Dick DJ, et al. Cholinergic correlates of cognitive impairment in Parkinson’s disease: comparisons with Alzheimer’s disease. J Neurol Neurosurg Psychiatry 1985;48:413– 421.
9. Perry EK, Tomlinson BE, Blessed G, Bergman K, Gibson PH, Perry RH. Correlation of cholinergic abnormalities with senile plaques and mental test scores in senile dementia. Br Med J 1978;2:1457–1459.
10. Wilcock GK, Esiri MM, Bowen DM, Smith CC. Alzheimer’s disease: correlation of cortical choline acetyltransferase activ-ity with the severactiv-ity of dementia and histological abnormali-ties. J Neurol Sci 1983;57:407– 417.
11. Perry R, McKeith I, Perry E. Lewy body dementia— clinical, pathological and neurochemical interconnections. J Neural Transm 1997;51(suppl):95–109.
12. McKeith IG, Galasko D, Kosaka K, et al. Consensus guide-lines for the clinical and pathologic diagnosis of dementia with Lewy bodies (DLB): report of the Consortium on DLB interna-tional workshop. Neurology 1996;47:1113–1124.
13. Salmon DP, Galasko D. Neuropsychological aspects of Lewy body dementia. In: Perry EK, Perry RH, McKeith I, eds. Lewy body dementia. New York: Cambridge University Press, 1996: 99 –113.
14. Galasko D, Saitoh T, Xia Y, et al. The apolipoprotein E allele e4 is overrepresented in patients with the Lewy body variant of Alzheimer’s disease. Neurology 1994;44:1950 –1951. 15. Harrington CR, Louwagie J, Rossau R, et al. Influence of
apolipoprotein E genotype on senile dementia of the Alzhei-mer and Lewy body types. Am J Pathol 1994;145:1472–1484. 16. Poirier J, Delisle MC, Quirion R, et al. Apolipoproteine4 allele
as a predictor of cholinergic deficits and treatment outcome in Alzheimer disease. Proc Natl Acad Sci USA 1995;92:12260 – 12264.
17. Khachaturian ZS. Diagnosis of Alzheimer’s disease. Arch Neu-rol 1985;42:1097–1105.
18. Mirra SS, Heyman A, McKeel D, et al. The Consortium to Establish a Registry for Alzheimer’s Disease (CERAD). Part II. Standardization of the neuropathologic assessment of Alz-heimer’s disease. Neurology 1991;41:479 – 486.
19. American Psychiatric Association. Diagnostic and statistical manual of mental disorders, 3rd edition, revised. Washington, DC: American Psychiatric Association, 1987.
20. McKhann G, Drachman D, Folstein M, Katzman R, Price D, Stadlan EM. Clinical diagnosis of Alzheimer’s disease: report of the NINCDS-ADRDA Work Group under the auspices of Department of Health and Human Services Task Force on Alzheimer’s Disease. Neurology 1984;34:939 –944.
21. Ditter SM, Mirra SS. Neuropathologic and clinical features of Parkinson’s disease in Alzheimer’s disease patients. Neurol-ogy 1987;37:754 –760.
22. Mirra SS, Hart MN, Terry RD. Making the diagnosis of Alz-heimer’s disease. Arch Pathol Lab Med 1993;117:132–144. 23. Terry RD, Peck A, DeTeresa R, Schecter R, Horoupian DS.
Some morphometric aspects of the brain in senile dementia of the Alzheimer type. Ann Neurol 1981;10:184 –192.
24. Samuel W, Galasko D, Masliah E, Hansen LA. Neocortical Lewy body counts correlate with dementia in the Lewy body variant of Alzheimer’s disease. J Neuropathol Exp Neurol 1996;55:44 –52.
25. Braak H, Braak E. Neuropathological stageing of Alzheimer-related changes. Acta Neuropathol 1991;82:239 –259. 26. Wenham PR, Price WM, Blundell G. Apolipoprotein E
geno-typing by one-stage PCR. Lancet 1991;337:1158 –1159. 27. Fonnum F. A rapid radiochemical method of determination of
choline acetyltransferase. J Neurochem 1975;24:407– 409. 28. Hansen LA, DeTeresa R, Tobias H, Alford M, Terry RD.
Neo-cortical morphometry and cholinergic neurochemistry in Pick’s disease. Am J Pathol 1988;131:507–518.
29. Gibb WRG, Mountjoy CQ, Mann DMA, Lees AJ. A pathologi-cal study of the association between Lewy body disease and Alzheimer’s disease. J Neurol Neurosurg Psychiatry 1989;52: 701–708.
30. Rossor MN, Iversen LL, Reynolds GP, Mountjoy CQ, Roth M. Neurochemical characteristics of early and late onset types of Alzheimer’s disease. Br Med J 1984;288:961–964.
31. Hansen LA. The Lewy body variant of Alzheimer disease. J Neural Transm 1997;51(suppl):83–93.
32. Gearing M, Lynn M, Mirra S. Neurofibrillary pathology in Alzheimer disease with Lewy bodies. Arch Neurol 1999;56: 203–208.
33. Heyman A, Fillenbaum GG, Gearing M. Comparison of Lewy body variant of Alzheimer’s disease with pure Alzheimer’s disease. Consortium to Establish a Registry for Alzheimer’s Disease, Part XIX. Neurology 1999;52:1839 –1844.
34. Connor DJ, Salmon DP, Sandy TJ, Galasko D, Hansen LA, Thal LJ. Cognitive profile of autopsy-confirmed Lewy body variant vs pure Alzheimer disease. Arch Neurol 1998;55:994 – 1000.
35. Paulus W, Jellinger K. The neuropathologic basis of different types of Parkinson’s disease. J Neuropathol Exp Neurol 1991; 50:743–755.
36. Hughes AJ, Daniel SE, Blankson S, Lees AJ. A clinicopatho-logical study of 100 cases of Parkinson’s disease. Arch Neurol 1993;50:140 –148.
37. Allen SJ, MacGowan SH, Tyler S, et al. Reduced cholinergic function in normal and Alzheimer’s disease brain is associated with apolipoproteine4 genotype. Neurosci Lett 1997;239:33– 36.
38. Morris CM, Massey HM, Benjamin R, et al. Molecular biology ofAPOE alleles in Alzheimer’s and non Alzheimer’s demen-tias. J Neural Transm 1996;47(suppl):205–218.
39. Levy R, Eagger SA, Griffiths M, et al. Lewy bodies and re-sponse to tacrine in AD. Lancet 1994;343:176.
40. Cummings JL. Changes in neuropsychiatric symptoms as out-come measures in clinical trials with cholinergic therapies for Alzheimer’s disease. Alzheimer Dis Assoc Disord 1997; 11(suppl 4):S1–9.
APOE
e
4 does not predict mortality,
cognitive decline, or dementia
in the oldest old
K. Juva, MD, PhD; A. Verkkoniemi, MD; P. Viramo, MD, PhD; T. Polvikoski, MD;
K. Kainulainen, MD, PhD; K. Kontula, MD, PhD; and R. Sulkava, MD, PhD
Article abstract—Objective:To examine the effect of the e4 allele on cognitive decline in the oldest old. Methods: We studied all 601 citizens of the city of Vantaa age 85 years and older in 1991. A total of 553 subjects (92%) took part in the study, which used the Mini-Mental State Examination (MMSE) and assessment of dementia according to the Diagnostic and Statistical Manual of Mental Disorders, third ed., revised (DSM-III-R) criteria. The survivors were re-examined 3 years later. APOE genotype was determined in 510 subjects, representing 83.2% of the original population. Results: Approximately one-half of the subjects (n5250) died before the follow-up, and 253 subjects (97.3% of the survivors) were re-examined. The occurrence of theAPOEe4 allele did not have any significant effect on survival. Of the 187 previously nondemented subjects, 58 (31%) had developed dementia. The OR for the e4 carriers to develop dementia was not significant: OR51.78; 95% CI50.88 to 3.60. In individuals with a follow-up MMSE score (n5222), the mean decline in the score was 3.1 points.APOEe4 carrier status did not have a significant effect on the mean MMSE change except in the previously demented subjects, among whom the drop was larger in the APOE e4 carriers. Conclusions: The lack of association betweenAPOEe4 carrier status and mortality, or development of dementia, or cognitive decline in these very elderly people, whether analyzed in the whole population or among the nondemented subjects only, suggests that the APOE e4 effect in younger subjects is age-dependent, and that it is no longer present in very old age. Key words: APOE—Dementia—Mortality.
NEUROLOGY 2000;54:412–415
The
APOE
e
4 allele has been associated with
in-creased risk of AD.
1-6It also has been reported to
impair the cognitive capacity in people without
dementia,
7-10and to increase the risk for cognitive
decline on follow-up.
11-13Some studies have
sug-gested that the effect associated with the
APOE
e
4
allele is strongest in people in their 60s and 70s and
diminishes with increasing age.
6,14We examined the effect of the
APOE
e
4 allele on
the risk of developing dementia and cognitive decline
in a population of people age 85 years and older,
taking advantage of a population-based sample and
a prospective follow-up setting.
Subjects and methods. The basic population of the Vantaa 851study consisted of all the people living in the city of Vantaa (a city of 170,000 inhabitants just beside the city of Helsinki) born before April 1, 1906 (n 5 610). Of these persons, 36 (6%) died before the examination, 11 (2%) refused to participate, and 1 could not be contacted. Therefore, it was possible to examine 553 persons, repre-senting 92% of these very old people.
The basic study included an interview and examination
by a trained public health nurse and a neurologist. The Mini-Mental State Examination (MMSE)15and an assess-ment of deassess-mentia according to the Diagnostic and Statisti-cal Manual of Mental Disorders, third ed., revised (DSM-III-R)16 were carried out. A clinical diagnosis of AD also was assessed but not used in analyses because completion of some autopsies on the study subjects during the follow-up indicated that the accuracy of the clinical diagno-sis of AD, compared with neuropathologic findings, was not reliable enough to justify its systematic use. The inter-views and examinations were conducted in the spring and fall of 1991.
The 260 subjects who survived were re-examined in the spring of 1994. The same interviews, tests, and examina-tions were carried out by the persons who performed them 3 years earlier. The cognitive change was measured by the difference in MMSE score between the basic and follow-up examinations. APOE genotyping was carried out by the minisequencing technique.17
Statistics were carried out by SPSS software using t-test, x2, Fisher’s exact test, nonparametric Kruskal-Wallis test, and Wilcoxon survival function when appropri-ate. Odds ratios (OR) were calculated against the reference population with APOEe3/e3 genotype. The study was
ap-From the Departments of Clinical Neurosciences (Drs. Juva and Verkkoniemi), Pathology (Dr. Polvikoski), and Medicine (Drs. Kainulainen and Kontula), Helsinki University Central Hospital, University of Helsinki; the Department of Public Health Science and General Practice (Dr. Viramo), University of Oulu, and Unit of General Practice, Oulu University Hospital; and the Department of Public Health and General Practice and Department of Medicine (Dr. Sulkava), University of Kuopio, Finland.
Supported by grants from Sigrid Juselius Foundation, the Finnish Heart Foundation, the Alzheimer Foundation of Finland, the Medical Council of the Finnish Academy, and the 100th Anniversary Foundation of Helsingin Sanomat.
Received December 15, 1998. Accepted in final form August 17, 1999.
proved by the Ethical Review Committee of the Health Center of the city of Vantaa.
Results. TheAPOEgenotype could be determined in 510 (92.2%) of the 553 persons originally taking part in the study. There was no difference in mean age or sex distribu-tion between those who were analyzed for their APOE genotypes and those who were not.
Before the follow-up examination, 250 persons (49%) had died, and 7 persons (1.4%) refused to take part in the reexamination or had moved into another district. The re-maining 253 persons (97.3% of the survivors) were reexam-ined. At the time of the basic study 3 years earlier, 187 of these persons had not been demented.
When the deceased and those re-examined were com-pared, no gender difference was found, but the deceased subjects had been somewhat older at the time of the base-line study (88.2 years versus 87.7 years, respectively; Kruskal-Wallis,p50.03). Dementia was significantly as-sociated with mortality. Before the re-examination, 66.5% of the demented and 38% of the nondemented persons had died (x2,p50.000).
The proportion of APOE e4 carriers was 29.2% at the baseline study (n 5 510). It was 27.7% among the re-examined and 31.2% among those deceased. This differ-ence is not statistically significant (x2, p 5 0.34). The difference remained insignificant in the subgroups of de-mented and nondede-mented subjects (table 1), and in all these groups divided by gender (data not shown;pvalues for x2test ranged from 0.24 to 0.99). We also made a life table analysis (Wilcoxon statistic) on survival ofAPOEe4 carriers and noncarriers. No differences in survival were found between these groups, neither in the whole popula-tion (p50.30) nor among women (p50.29) or men (p5 0.73), nor among the demented (p50.53) or nondemented subjects (p50.23).
At the 3-year follow-up examination, 124 persons were assessed as demented, corresponding to 49% of those reex-amined. Among these, there were 58 new cases of demen-tia, with 18 persons carrying at least onee4 allele. For the initially nondementedAPOEe4 carriers, the OR for
devel-oping dementia during the follow-up was 1.78 (95% CI 5 0.88 to 3.60), and thus statistically insignificant.
At the baseline examination, MMSE score was assessed in 500 subjects with a knownAPOEgenotype. There were noAPOEgenotype-related differences in the mean MMSE score in the separate groups of demented subjects (8 points for APOE e4 carriers and 9.2 for the noncarriers; t-test, p50.24) and nondemented subjects (23.7 points for carri-ers and 23.3 noncarricarri-ers;t-test,p 50.57) at the baseline study.
The follow-up MMSE score was known in 222 subjects (87.7% of those re-examined). The mean follow-up MMSE score for the re-examined population was 19.6 6 7.2 points: 21.465.9 for those not demented at the time of the baseline study (n 5 183) and 10.3 6 5.4 for those de-mented then (n5 39). There were no differences in mean MMSE scores between those with and those without thee4 allele in the whole re-examined population, nor among the initially demented or nondemented subjects (table 2). Analysis of all these groups divided by gender did not alter this, except that previously demented women with the APOEe4 allele had a lower MMSE score (7.1) than those without this allele (11; p5 0.05). Other differences were insignificant (x2pvalues ranged from 0.11 to 0.65).
Cognitive decline was measured by change in MMSE score. The mean decline in the MMSE scores in the whole population was 3.1 points: 3.2 for women and 2.5 for men (Kruskal-Wallis,p50.26).
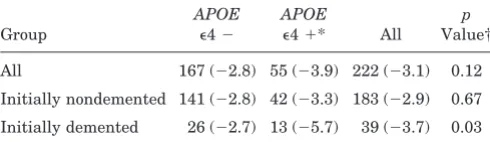
Among the initially nondemented subjects, the drop in the mean MMSE score was 2.9 points. No differences in the mean MMSE change between thee4 carriers and non-carriers were found, whether analyzed in the whole popu-lation or among the initially nondemented subjects, or in men and women separately. In contrast, there was an e 4-associated difference in the MMSE change among the ini-tially demented subjects: the decline in the mean MMSE score was 5.7 points ine4 carriers and 2.7 points in noncar-riers (Kruskal-Wallis,p50.03; table 3).
Discussion.
The Vantaa 85
1
study is a
population-based study in which 510 (83.2%) of the 601 citizens in
the city of Vantaa age 85 years or older were examined
and had their
APOE
genotypes determined. During the
3 years of follow-up, 49% of the population had died,
whereas 97.3% of the surviving persons (n
5
253) were
re-examined. This population can be regarded as
repre-sentative for people of this very old age.
The
APOE
e
4 allele was not associated with
mor-Table 1Mortality ofAPOEe4 carriers and noncarriers at the 3 years’ follow-up investigation in the whole population and among the initially nondemented and initially demented subjects
Group/ follow-up
e4 Carriers
e4
Noncarriers All pValue*
All
Alive 71 (27.3) 189 (72.7) 260 (100)
Dead 78 (31.2) 172 (68.8) 250 (100) 0.34
Nondemented
Alive 45 (23.2) 149 (76.8) 194 (100)
Dead 23 (19.3) 96 (80.7) 119 (100) 0.42
Demented
Alive 26 (39.4) 40 (60.6) 66 (100)
Dead 55 (42.0) 76 (58.0) 131 (100) 0.72
Values are n (%).
* Pearson chi-square.
Table 2Mean Mini-Mental State Examination (MMSE) scores at follow-up in the whole population and in the initially
nondemented and demented subjects byAPOEe4 carrier status
Group
APOE
e42
APOE
e41* All
p
Value†
All 167 (20.1) 55 (17.9) 222 (19.6) 0.08
Initially nondemented 141 (21.6) 42 (20.9) 183 (21.4) 0.40
Initially demented 26 (11.3) 13 (8.4) 39 (10.3) 0.10
Values are n (mean MMSE).
* At least oneAPOEe4 allele. † Kruskal-Wallis test.
tality of these very elderly people. At first glance,
this lack of association may appear unexpected
be-cause this allele has been strongly associated with
both coronary heart disease
18,19and AD,
1-4and also
with crude mortality.
20The explanation for the
lack-ing association may be inherent for the extremely old
age of this population. Therefore, the negative
influ-ence of the
e
4 allele on longevity is likely to become
apparent earlier in life, and may have worn out by
very old age. This hypothesis accords with earlier
findings showing that the effect of
APOE
e
4 allele
on the risk of AD is strongest in people in their 60s
and 70s.
6,14In contrast, in an elderly Swedish population, the
APOE
e
4 allele increased mortality of cognitively
un-impaired people older than 85 years, whereas it had
no effect on the mortality of people ages 75 to 79
years, or on that of cognitively impaired persons of
any age.
21The impact of
APOE
genotypes on the risk
of coronary heart disease has not been studied in
very old populations.
Among the nondemented persons in the current
study, the
APOE
e
4 allele did not increase the risk of
developing dementia during the follow-up, nor did it
increase the risk for cognitive decline. This
consti-tutes an additional support for the hypothesis that
the risk-increasing effect of the
e
4 allele on the risk
of AD and dementia has mainly disappeared by this
age, whatever its underlying mechanism.
A correlation between the
APOE
e
4 allele and the
prevalence of AD has been found in this same
popu-lation older than 85 years.
22However, there was no
e
4 allele–related association in the mean MMSE
score at the follow-up examination or in the change
in MMSE score during the follow-up among the
ini-tially nondemented persons nor among the whole
re-examined population. Among the demented subjects
the cognitive decline was greater in
APOE
e
4 carriers.
As reported in several previous studies, the
presence of the
APOE
e
4 allele was associated with
impaired cognitive capacity of people without
dementia
7-10and increased risk of cognitive decline
among unaffected people during follow-up.
11-13Only
in one study was an
APOE
-related difference in the
MMSE score noticed.
9In other studies, the
differ-ences were revealed only by neuropsychological
tests. A study of cognitive decline assessed by MMSE
found no differences between
APOE
e
4 carriers and
noncarriers.
23The lack of association between the
e
4
allele and MMSE score as well as MMSE change in
the nondemented population therefore could result
from robustness of the MMSE test.
The lack of evidence for significant association
be-tween the
APOE
e
4 allele and cognitive decline
seems to support the hypothesis that the harmful
effect of this allele on cognitive functions is
age-dependent and has worn out before this very old age.
Acknowledgment
The authors thank Ms. Tuula Soppela-Loponen for technical assis-tance and M.Sc. Pirjo Halonen for statistical advice.
References
1. Poirier J, Davignon J, Bouthillier D, Kogan S, Bertrand P, Gauthier S. Apolipoprotein E polymorphism and Alzheimer’s disease. Lancet 1993;342:697– 699.
2. Saunders AM, Strittmatter WJ, Schmechel D, et al. Associa-tion of apolipoprotein E allelee4 with late-onset familial and sporadic Alzheimer’s disease. Neurology 1993;43:1467–1472. 3. Saunders AM, Schmader K, Breitner JCS, et al.
Apolipopro-tein Ee4 allele distribution in late-onset Alzheimer’s disease and in other amyloid-forming diseases. Lancet 1993;342: 710 –711.
4. Kuusisto J, Koivisto K, Kervinen K, et al. Association of apo-lipoprotein E phenotypes in late onset Alzheimer’s disease: population-based study. BMJ 1994;309:636 – 638.
5. van Duijn C, Kniff P, Cruts M, et al. Apolipoprotein E4 allele in a population-based study of early-onset Alzheimer’s dis-ease. Nat Genet 1994;7:74 –78.
6. Blacker D, Haines JL, Rodes L, et al.APOE4 and age at onset of Alzheimer’s disease: the NIMH genetic initiative. Neurology 1997;48:139 –147.
7. Reed T, Carmelli D, Swan G, et al. Lower cognitive perfor-mance in normal older adult male twins carrying the apoli-poprotein Ee4 allele. Arch Neurol 1994;51:1189 –1192. 8. Bondi MW, Salmon DP, Monsch AU, et al. Episodic memory
changes are associated with the APOE-e4 allele in nonde-mented older adults. Neurology 1995;45:2203–2206.
9. Berr C, Dufoil C, Brousseau T, et al. Early effect ofAPOE-e4 allele on cognitive results in a group of highly performing subjects: the EVA study. Neurosci Lett 1996;218:9 –12. 10. Soininen H, Riekkinen P. Apolipoprotein E, memory,
Alzhei-mer’s disease. Trends Neurosci 1996;19:224 –228.
11. Hyman BT, Gomez-Isla T, Briggs M, et al. Apolipoprotein E and cognitive change in an elderly population. Ann Neurol 1996;40:55– 66.
12. Helkala E-L, Koivisto K, Ha¨nninen T, et al. Memory functions in human subjects with different apolipoprotein E phenotypes during a 3-year population-based follow-up study. Neurosci Lett 1996;240:17–180.
13. Kalmijn S, Feskens, EJM, Launer LJ, Kromhout D. Cerebro-vascular disease, the apolipoproteine4 allele, cognitive decline in a community-based study of elderly men. Stroke 1996;27: 2230 –2235.
14. Rebeck GW, Perls TT, West HL, Sodhi P, Lipsitz LA, Hyman BT. Reduced apolipoprotein e4 allele frequency in the oldest old Alzheimer’s patients and cognitively normal individuals. Neurology 1994;44:1513–1516.
15. Folstein MF, Folstein SE, McHugh PR. “Mini-mental state”: a practical method for grading the cognitive state of patients for the clinician. J Psychiatr Res 1975;12:189 –198.
16. American Psychiatric Association. Diagnostic and statistical manual of mental disorders, third ed., revised (DSM-III-R). Washington, DC: APA, 1987.
17. Syva¨nen A-C, Aalto-Seta¨la¨ K, Harju L, Kontula K, So¨derlund H. A primer-guided nucleotide incorporation assay in genotyp-ing of apolipoprotein E. Genomics 1990;8:684 – 692.
Table 3Mean Mini-Mental State Examination (MMSE) change (difference in individual MMSE scores at the baseline study and at the follow-up) in the whole population and in the initially nondemented and demented subjects byAPOEe4 carrier status
Group
APOE
e42
APOE
e41* All
p
Value†
All 167 (22.8) 55 (23.9) 222 (23.1) 0.12
Initially nondemented 141 (22.8) 42 (23.3) 183 (22.9) 0.67
Initially demented 26 (22.7) 13 (25.7) 39 (23.7) 0.03
Values are n (MMSE change).
18. Davignon J, Gregg RE, Sung CF. Apolipoprotein E polymor-phism and atherosclerosis. Arteriosclerosis 1988;8:1–21. 19. van Bockxmeer FM, Mamotte CD. Apolipoprotein epsilon 4
homozygosity in young men with coronary heart disease. Lan-cet 1992;340:879 – 880.
20. Tilvis R, Strandberg T, Juva K. Apolipoprotein E phenotypes, dementia, and mortality in a prospective population sample. J Am Geriatr Soc 1998;46:712–715.
21. Corder EH, Lannfelt L, Viitanen M, et al. Apolipoprotein E
genotype determines survival in the oldest old (85 years or older) who have good cognition. Arch Neurol 1996;53: 418 – 422.
22. Sulkava R, Kainulainen K, Verkkoniemi A, et al. APOE al-leles in Alzheimer’s disease and vascular dementia in a popu-lation aged 851. Neurobiol Aging 1996;17:373–376.
23. Henderson AS, Easteal S, Jorm AF, et al. Apolipoprotein E allelee4, dementia and cognitive decline in a population sam-ple. Lancet 1995;345:1387–1390.
Early-life risk factors and the
development of Alzheimer’s disease
V.M. Moceri, PhD; W.A. Kukull, PhD; I. Emanuel, MD, MSPM; G. van Belle, PhD; and E.B. Larson, MD, MPH
Article abstract—Objective: To investigate the association of early-life factors with AD. Background: The early-life environment and its effect on growth and maturation of children and adolescents are linked to many adult chronic diseases (heart disease, stroke, hypertension, and diabetes mellitus), and these effects are also linked to maternal reproduction. AD may have an early-life link. The areas of the brain that show the earliest signs of AD are the same areas of the brain that take the longest to mature during childhood and adolescence. A poor-quality childhood or adolescent environment could prevent the brain from reaching complete levels of maturation. Lower levels of brain maturation may put people at higher risk for AD. Methods: In a community-based case-control study (393 cases, 377 controls), we investigated the association of early-life factors and AD. Early-life variables include mother’s age at patient’s birth, birth order, number of siblings, and area of residence before age 18 years. Patient education level and apolipoprotein E (APOE) genotypes were also included in the analysis. Results:Area of residence before age 18 years and number of siblings are associated with subsequent development of AD. For each additional child in the family the risk of AD increases by 8% (OR51.08, 95% CI51.01 to 1.15). More controls compared with cases grew up in the suburbs (OR50.45, 95% CI50.25 to 0.82).APOEe4 and the patient’s education level did not confound or modify the associations.Conclusions:The early-life childhood and adolescent environment is associated with the risk of AD. Key words: Early life—Childhood— Adolescence—AD—Chronic disease.
NEUROLOGY 2000;54:415–420
The early-life environment and its effect on growth
and maturation in children and adolescents are
linked to many adult chronic diseases (heart disease,
stroke, hypertension, diabetes mellitus, and chronic
obstructive lung disease)
1and to female reproductive
outcomes.
2AD may also have an early-life link.
3-5Understanding growth, maturation, and aging of the
brain may be the key to this link. The brain grows
most in size during the prenatal period and in
childhood
6-8but continues to complete its maturation
during adolescence.
6-9Brain maturation refers to the
development of connectivity patterns, synapses,
branching of dendrites, and myelination.
7-9The areas
of the brain that take longest to mature during
child-hood and adolescence (e.g., hippocampal formation,
intracortical association areas, reticular formation)
7,9are the same areas of the brain that show the
earli-est signs of AD.
10-13An association between early-life
growth and development and later-life cognitive
de-cline was first suggested by Conel
14in 1939.
Environmental factors can affect brain
matura-tion. Studies on rats
15-19show that brain maturation
can be retarded with only mild malnutrition and
that catch-up growth is not always attainable. Mild
malnutrition has a slowing effect on development
and myelination patterns and interferes with normal
development by decreasing dendritic growth.
In-creasing nutrition later in the rats improves brain
maturation (as measured by amount of myelin) but
not to the level of those who were never
malnour-ished. This finding parallels studies on human
chil-dren
20,21showing that children who were marginally
malnourished are shorter, lighter, and score lower
on cognitive ability than their larger, heavier, and
better nourished peers. Improved nutrition and
en-vironment later in childhood modified, but did not
From the Departments of Epidemiology (Drs. Moceri, Kukull, and Emanuel), Environmental Health and Biostatistics (Dr. van Belle), and Medicine (Dr. Larson), University of Washington, Seattle.
Supported in part by grants R03 AG 15179, R01 AG 07584, and U01 AG 06781-06 from the National Institute on Aging, US Public Health Service. Received February 22, 1999. Accepted in final form August 27, 1999.
Address correspondence and reprint requests to Dr. V.M. Moceri, Department of Epidemiology, Box 357236, University of Washington, Seattle, WA 98195-7236; e-mail: [email protected]
eliminate, the difference between marginally
un-dernourished and well-nourished children,
al-though both groups of children scored within the
normal intelligence range. Therefore, poor growth
early in life could increase the risk of AD. The
effects of impaired development could produce a
brain that is normal but functions less efficiently
because of less myelin, less branching of dendrites,
and less developed connectivity patterns. This
im-paired development affects speed and specificity of
nerve transmissions and requires increased energy
to function properly.
22,23The negative effects of this
less efficient brain would likely be marginal until
aggravated by the aging process.
We investigated the association of AD and
early-life factors: mother’s age at subject’s birth, birth
or-der, sibship size, and area of residence before the age
of 18 years. Babies born to mothers who are younger
than 20 or older than 35 years of age tend to have
lower birth weights.
24Although there is an increase
in birth weight with each successive birth, in
cross-sectional studies babies born to mothers over 35
years of age also tend to be smaller because mothers
who continue having babies later in life usually are
in lower socioeconomic levels.
25The number of
chil-dren in a family is related to socioeconomic level.
26-29During the early 1900s when the subjects in this
study were children, the optimal/preferred family
size was three or four children.
27,29Families with five
or more children were more likely to be from the
lower socioeconomic levels
27,28and therefore were
more likely to have poor growth rates.
25,30-32If
defi-cient maturation is associated with a less developed
brain, then these measures that influence early
growth could be associated with AD. We also
investi-gated whether the potential association of these
early-life factors and AD changed after adjusting for
education level and apolipoprotein E genotype
(
APOE
), or whether the potential associations are
modified by
APOE
(i.e., whether the strength of the
association differs between those with and those
without one or more
APOE
e
4 alleles).
Methods. Study population and design. Patients for this case-control study were drawn from the Group Health Cooperative (GHC), a large health maintenance organiza-tion in Seattle, WA. GHC was established in 1949; the Seattle area membership of people aged 60 years or over included about 23,000 people. The attrition rate, excluding deaths, is about 1% per year. Most of the GHC population are longtime members who originally enrolled through their employers and remain after retirement. GHC mem-bers are representative of the surrounding community with respect to age distribution, gender, and ethnicity, but have a slightly higher education level in this age group.
The AD cases for this study were obtained from patients enrolled in the University of Washington/GHC AD Patient Registry (ADPR) (U01 AG 06781) from 1987 to 1996. Spe-cifically, they were probable AD cases also enrolled in the Genetic Differences Case-Control Study (R01 AG 07584). Cases were patients in whom dementia had been diag-nosed according to the Diagnostic and statistical manual of
mental disorders, 3rd ed., revised,33and who had a diagno-sis of probable AD as defined by the National Institute of Neurological and Communicative Disorders and Stroke– Alzheimer’s Disease and Related Disorders Association34 working group criteria, or definite AD if they died after ADPR enrollment and had a neuropathologic diagnosis of AD. Controls were patients selected at random from GHC enrollment lists during approximately the same period as the cases (case selection started 6 months earlier than control selection) and frequency matched on gender and age within 2 years. Potential controls were excluded if they had dementia or other neurologic disease causing demen-tia. To verify that the potential control subjects did not have dementia, they were required to achieve a score of 28 of 30 on the Mini-Mental State Examination35(27 if over age 80 years) and to have no other indications of demen-tia based on other test results, medical record review, or ob-servations of the research nurse-interviewer. For more details on the ADPR case surveillance, enrollment, and di-agnostic protocol, see Larson et al.36; for description of the Genetic Differences Case-Control Study see Kukull et al.37
Collection of early-life variables. Early-life information and other types of epidemiologic information were ob-tained by in-person interviews between research nurses and proxy informants for both case and control subjects. The variables used for this study include mother’s, pa-tient’s, and siblings’ birth dates, patient’s education level, and patient’s area of residence before age 18 years. If a patient lived in more than one type of area prior to age 18, he or she was asked to choose the area in which he or she lived in the longest. The primary source of birth date infor-mation was a family history questionnaire. This question-naire was completed by the proxy with consultation with other family members.
A greater proportion of case, compared with control, proxies answered fewer of the family history questions or did not complete the family history questionnaire. Missing information is unlikely to have biased reporting of moth-er’s age and other early-life variables because the reasons for not completing the questionnaire were not related to mother’s age or the early-life environment. If the exact birth date of the mother was unknown or missing from the family history questionnaire, approximate information from the in-person epidemiologic interview was used. At the epidemiologic data interview, the proxy was asked whether the mother’s age at patient’s birth was less than 20, 20 to 24, 25 to 29, 30 to 34, or greater than 35 years, rather than the date of birth as on the family history questionnaire.
APOE genotypes had been determined as part of the Genetic Differences Case-Control Study by the restriction enzyme digestion method of Hixson and Vernier,38 using DNA prepared from blood and brain tissue samples. Labo-ratory personnel were blinded to case/control status.APOE genotypes were unavailable for 74 of the case subjects and for 11 of the control subjects because either the family (n5 36) or the patient (n523) refused to give a blood sample, they discontinued participation (n 511), the study ended before a blood sample was taken (n57), or samples were degraded or failed the PCR (n59).
were calculated in the conventional manner from fre-quency tables, and Mantel-Haenzsel adjusted ORs were calculated for stratified data.39,40For continuous variables, unconditional logistic regression was used to estimate the crude and adjusted ORs and 95% CIs.39,40Multiple logistic regression (unconditional) was also used to obtain adjusted effect estimates.39,40For crude and adjusted ORs the vari-ables are coded in the following ways: number of siblings was analyzed as a continuous variable, as a single dummy variable (,5 versus.5), and as three dummy variables (5 to 6 siblings, 7 to 9 siblings, and.10 siblings), using less than five siblings as the reference category. This value was chosen because families with five or more children were more likely to be from the lower socioeconomic levels26-29 and therefore were more likely to have poor growth rates.25,30-32 Education was coded as high school graduate or less versus more than high school.APOEgenotype was coded as one or moree4 alleles versus none.
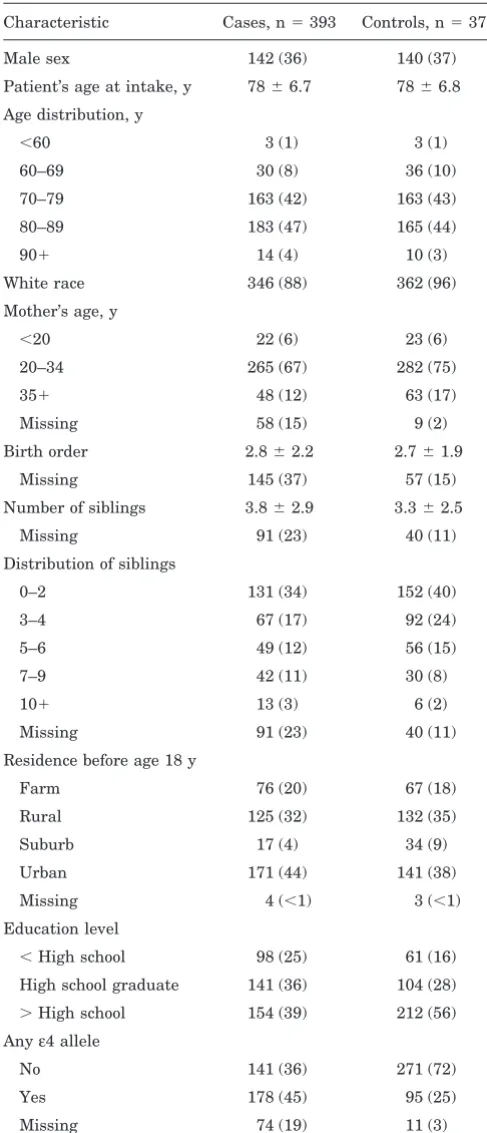
Results. Characteristics of the study population are shown in table 1. The mean birth order is similar in case and control subjects. The mean number of siblings is higher in case than in control subjects (3.8 versus 3.3). The area of residence the patient lived in prior to age 18 years is similar for farm, rural, and urban residence; however, more control compared with case subjects reported grow-ing up in the suburbs. Cases had a higher frequency of APOEe4 – containing genotypes and an overall lower edu-cation level. The difference in level of eduedu-cation between case and control subjects is primarily due to response bias among controls. A substudy conducted as part of the Ge-netic Differences Case-Control Study showed that persons selected as potential controls who refused to participate in the study were more similar to the enrolled AD cases in their level of education, whereas control subjects who agreed to enter the study were more highly educated. Therefore, the appearance of an association between lower education and AD in this data is thought to be spurious.
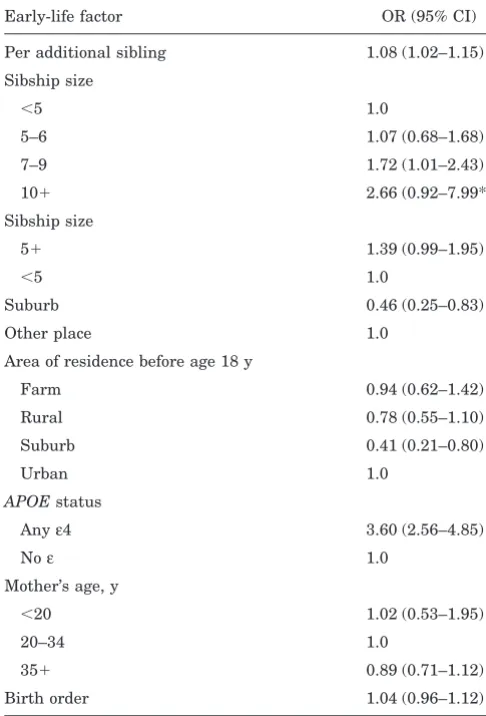
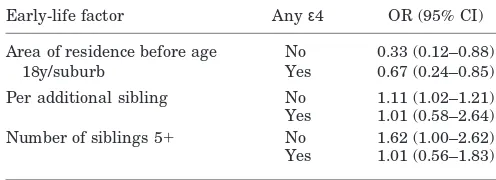
Increased number of siblings is associated with an in-creased risk of AD (table 2). The risk of AD increases by 8% for each additional sibling in the family (OR 5 1.08, 95% CI51.02 to 1.15). Growing up in a family with five or more siblings increases the risk of developing AD by 39% (OR51.39, 95% CI50.99 to 1.95). There is a linear trend of increasing risk with increasing sibship size. Compared with families with less than five siblings, having seven to nine siblings is associated with an almost twofold risk (OR51.72, 95% CI51.01 to 2.43), and in extremely large families with 10 or more siblings the risk is greater than twofold (OR 5 2.66, 95% CI 5 0.92 to 7.99). The area of residence prior to age 18 years is associated with AD. Specifically, more control compared with case subjects grew up in the suburbs (OR50.46, 95% CI50.25 to 0.83). The presence of at least one APOEe4 allele is associated with a 3.6-fold increased risk of AD. We found no associa-tion between mother’s age at patient’s birth and subse-quent onset of AD.
Having more than a high school education is inversely correlated with number of siblings (Spearman’sr5 20.17, p50.0014). The presence/absence ofAPOEe4 allele shows no correlation to growing up in the suburbs, level of educa-tion, or number of siblings. Table 3 shows the results of six different multiple logistic regression models used to obtain adjusted ORs and 95% CIs for the risk of AD. The ORs of
the variables of interest are quite similar for each model and to the crude ORs shown in table 2. Model 1 shows the association of growing up in the suburbs while adjusting for patient’s education. Only a few patients are missing area of residence information and are not in this model. Model 2 shows the association of more than five siblings while controlling for presence of the APOEe4 allele. The
Table 1Characteristics of case and control subjects in a study of early-life factors and the development of AD
Characteristic Cases, n5393 Controls, n5377
Male sex 142 (36) 140 (37)
Patient’s age at intake, y 7866.7 7866.8
Age distribution, y
,60 3 (1) 3 (1)
60–69 30 (8) 36 (10)
70–79 163 (42) 163 (43)
80–89 183 (47) 165 (44)
901 14 (4) 10 (3)
White race 346 (88) 362 (96)
Mother’s age, y
,20 22 (6) 23 (6)
20–34 265 (67) 282 (75)
351 48 (12) 63 (17)
Missing 58 (15) 9 (2)
Birth order 2.862.2 2.761.9
Missing 145 (37) 57 (15)
Number of siblings 3.862.9 3.362.5
Missing 91 (23) 40 (11)
Distribution of siblings
0–2 131 (34) 152 (40)
3–4 67 (17) 92 (24)
5–6 49 (12) 56 (15)
7–9 42 (11) 30 (8)
101 13 (3) 6 (2)
Missing 91 (23) 40 (11)
Residence before age 18 y
Farm 76 (20) 67 (18)
Rural 125 (32) 132 (35)
Suburb 17 (4) 34 (9)
Urban 171 (44) 141 (38)
Missing 4 (,1) 3 (,1)
Education level
,High school 98 (25) 61 (16)
High school graduate 141 (36) 104 (28)
.High school 154 (39) 212 (56)
Anyε4 allele
No 141 (36) 271 (72)
Yes 178 (45) 95 (25)
Missing 74 (19) 11 (3)
Values are n (%) or mean6SD.
large amount of missing information is from sibling size andAPOE; even so, the adjusted associations of models 1 and 2 shown in table 3 are very similar to the crude asso-ciations shown in table 2. Model 3 shows the assoasso-ciations of both area of residence and number of siblings adjusting for education, and model 4 shows the associations of area
of residence and more than five siblings adjusting for both potential confounders (APOE and education). These four models individually and together show that the associa-tions are stable for area of residence and sibship size when investigating individual associations or combined associa-tions while adjusting for one or both of the potential con-founders and across variations in the sample size. As can be seen in the variation in number of case and control subjects across the six models, there is notable but not complete overlap in the amount of missing information on each patient. Models 5 and 6 show the linear trend of sibship size in the presence of one or both confounders. Again the amount of variation between the associations of sibship size is minimal and the increasing risk with in-creasing sibship size is stable. Thus, the large amount of missing data on level of education orAPOEe4 allele does not appear to confound the association between AD, sib-ship size, or growing up in the suburbs.
Stratifying by the presence/absence of APOE e4 allele (table 4) revealed no significant variation in the strength of association between the variables of interest and AD. Increasing sibship size was not associated with AD in the presence of APOEe4; however, the large percent of miss-ing information for the number of siblmiss-ings in the case subjects combined with the lower frequency ofAPOEe4 in the control subjects may have compromised the ability to evaluate this association. The Breslow-Day test for homo-geneity of ORs across strata was not significant (p.0.1), indicating no statistical evidence for effect modification by APOEgenotype.
Discussion.
The relationship of the process of
growth and development of the brain and the
pathol-ogy of AD describes a biologic connection. We as well
as others
3-5have concluded that the early-life
envi-ronment may be associated with the development of
AD. Each of these studies used different measures of
early life (head circumference,
3adult height,
5and
early-adult linguistic ability
4) to investigate an
early-life association with AD. We used information
col-lected by interview to retrospectively collect factors
in the early-life environment that influence growth
Table 2Crude associations of early-life factors and AD
Early-life factor OR (95% CI)
Per additional sibling 1.08 (1.02–1.15)
Sibship size
,5 1.0
5–6 1.07 (0.68–1.68)
7–9 1.72 (1.01–2.43)
101 2.66 (0.92–7.99*)
Sibship size
51 1.39 (0.99–1.95)
,5 1.0
Suburb 0.46 (0.25–0.83)
Other place 1.0
Area of residence before age 18 y
Farm 0.94 (0.62–1.42)
Rural 0.78 (0.55–1.10)
Suburb 0.41 (0.21–0.80)
Urban 1.0
APOEstatus
Anyε4 3.60 (2.56–4.85)
Noε 1.0
Mother’s age, y
,20 1.02 (0.53–1.95)
20–34 1.0
351 0.89 (0.71–1.12)
Birth order 1.04 (0.96–1.12)
Chi-square for linear trend: 6.94;pvalue: 0.008.
Table 3ORs (95% CIs) relating various combinations of risk factors to AD
Variable
Models
1 2 3 4 5 6
Cases/controls, n 389/374 248/328 298/334 246/326 248/328 248/328
Other variables
Area of residence suburb 0.46 (0.3–0.8) – 0.36 (0.2–0.7) 0.37 (0.2–0.8) – –
Per additional sibling – – 1.06 (1.0–1.12) – – –
51Sibling – 1.39 (0.9–2.0) – 1.25 (0.9–1.9) – –
5–6 Siblings – – – – 1.04 (0.6–1.7) 1.0 (0.6–1.6)
7–9 Siblings – – – – 1.64 (0.9–2.9) 1.43 (0.8–2.5)
101Siblings – – – – 2.43 (0.8–7.1) 2.10 (0.7–6.3)
APOEε4 allele – 3.50 (2.5–5.0) – 3.96 (2.7–5.7) 3.47 (2.4–4.9) 3.80 (2.6–5.5)
.High school education 0.49 (0.4–0.7) – 0.49 (0.4–0.7) 0.42 (0.3–0.6) – 0.44 (0.3–0.6)