A Machine Learning Approach for Prediction
of Diseases Using Unstructured Datasets
Mayedaarshi1, Dr.Rekhapatil2
PG Scholar, Dept. of Computer Science and Engineering, P.D.A College of Engineering, Gulbarga, Karnataka, India1
Professor, Dept. of Computer Science and Engineering, P.D.A College of Engineering, Gulbarga,
Karnataka, India2
ABSTRACT:The growth of big data in biomedical and healthcare communities has been rapidly increasing, early disease detection accurate analysis of medical data benefits, community services and patient care. Moreover, the analysis accuracy is reduced when the quality of medical data is incomplete. However, different regions exhibit unique characteristics of certain regional diseases that may weaken the prediction of disease outbreaks. Here, by streamlining the machine learning algorithms for effective prediction of chronic disease outbreak in disease-frequent communities. The modified prediction models over real life hospital data is collected and experimented. The difficulty of incomplete data, a latent factor model is used to reconstruct the missing data. A regional chronic disease is experimented. By proposing a new convolutional neural network based multimodal disease risk prediction (CNN-MDRP) algorithm using structured and unstructured data from hospital.
KEYWORDS:Disease Prediction, Chronic Disease , Machine Learning, Hospital Data, Big Data.
I.INTRODUCTION
As the living standards are improving, the chronic disease is increasing. So, it is essential to perform risk assessments for chronic diseases. The growth in medical data [2], collection of electronic health records (EHR) is increasingly convenient. Among the applications, one of them is to identify high-risk patients which can be utilized to reduce medical cost since high risk patients require expensive treatment. Using traditional disease risk models involves a machine learning algorithm and a supervised learning algorithm by the use of training data with labels to train the model [13]. The test set, patients can be classified into groups of high-risk or low-risk.As the development in big data analytics technology, more attention has been paid to disease prediction of the perspective of big data analysis, researches has been conducted by selecting the characteristics automatically [18][19] .The unstructured data uses convolutional neural network(CNN) for extracting text characteristics. First, the latent factor model is used to reconstruct the missing data from medical records collected from hospital. Secondly,by determining the major chronic diseases in the region. Thirdly, by handling structured data, the hospital experts are said to be consulted to extract useful features. Theunstructured text data, the features are automatically selected using CNN algorithm .Therefore, by proposing a CNN-based multimodal disease risk prediction algorithm for structured and unstructured data.
II.RELATED WORK
progression modeling, personalized medication, integrating genetics, Predictive modeling . The first 24 hours of patient information are often the most predictive of hospital mortality. In [4] the author discusses an overlapping and hierarchical social clustering model (OHSC) is designed to classify the vehicles into different social clusters by exploring the social relationship between them is measured by whether the vehicles are driven or parked in the small area simultaneously by the result of OHSC, an SBL algorithm is used to provide the global location information for the vehicular networks based on the prediction of vehicles location even without the GPS devices.
In [5] the author focuses on the novel localization approaches that utilizes the neighbour relative received signal strength to build the finger print database and adopts a Markov-chain prediction model to assist positioning.
The author proposes a technique that provides robust and stable localization accuracy against device heterogeneity and environmental dynamics, which ensures the efficiency of localization.In [6] author focuses on risk factors and risk assessment tools for falls in hospital inpatients. The nature and prevalence of risk factors for falls in hospital inpatients and to identify high-risk patients in designing future falls prevention.In [7] the author discusses the symptom-based heart score that identifies very low-risk patients. The thrombolysis in myocardial infraction (TIMI) risk score can risk stratify ED patients with potential ACS but cannot identify patients safe for EDdischarge. In [8] the author discusses a machine learning approach based on Bayesian network trained on EHD to predict the probability of having a CV event for 5 years. Since many traditional data mining methods are not well-suited for such data.
III.SYSTEM DESIGN AND METHODOLOGY
Figure 1: System Architecture
Data set used in the hospital contains real-life hospital data and the data is stored in the data center. Inpatient department data is mainly composed of structured and unstructured text data. The structured data has the patient’s laboratory data and the patient’s basic information such as the patient’s age, gender and life habit’s, etc. The unstructured text data includes the patient’s narration of his/her illness, the doctor’s interrogation records and diagnosis, etc.
To give the result of the main disease which affects this region, a statistics is given on the number of patients, sex ratio of patients and the major disease in the region.
The three datasets are used to reach a conclusion.
Structured data(S-data): use the patient’s structured data to predict whether the patient is at high-risk of chronic disease.
Text data (T-data): use the patient’s unstructured text data to predict whether the patient is at high-risk. Structured and text data(S&T-data): use the S-data and T-data the structured data and unstructured text data to
predict whether the patient is at high-risk.
The S-data, three conventional machine learning algorithms, i.e., Naïve Bayesian (NB), K-nearest neighbour (KNN), and decision tree(DT) algorithm to predict the risk of the disease. The T-data has a CNN- based unimodal disease risk prediction (CNN-UDRP) algorithm and is used to predict the disease. In the (S&T-data) the prediction of the disease is done by using CNN-MDRP (S&T-data).
A) Data imputation: In examining of the patient’s data, there is a large number of missing data due to human error.The structured data need to be filled.First identify uncertain or incomplete medical data and then modifying them to improve the data quality.The data integration is used for data pre-processing.
B) CNN-based Unimodal Disease Risk Prediction (CNN-UDRP) Algorithm: The processing of medical text data, CNN-based unimodal disease risk prediction (CNN-UDRP) algorithm is utilized and is divided into the following steps:
1) Representation of text data: the text is represented in the form of vector.
2) Convolution layer of the text CNN: two words are choosed from front and back of each vector.
3)Pool layer of text CNN: The role of every word in the text is not completely equal, by maximum pooling the elements are choosed which play a key role in the text.
4)Full connection layer of text CNN: The pooling layer connected with a fully connected neural network. 5)CNN classifier: The connection layer links to a classifier, a softmax classifier is choosed.
6)CNN-based Multimodal Disease Risk Prediction (CNN-MDRP)Algorithm: The CNN-UDRP only uses the text data to predict whether the patient is at high-risk of the chronic disease. For structured and unstructured text data, a CNN-MDRP algorithm is designed. The CNN-CNN-MDRP algorithm, the training process is divided into two parts:
1)Training word embedding: the text data of all patients is extracted in the hospital.
2) Training parameters of CNN-MDRP : In CNN-MDRP algorithm, the specific training parameters are set and finally risk assessment of whether the patient suffers from the disease.
IV. RESULT ANALYSIS
The overall results include S-data and S&T-data.
A. Structured Data(S-data): using traditional machine learning algorithm, i.e., NB, KNN and DT algorithm to predict the risk of the disease. The classification of NB is a simple probabilistic classifier. Conditional probability formula is used to estimate discrete feature attributes and Gaussian distribution to estimate the continous feature attributes. KNN classification is given a training data set. Here the data is normalized first. Choosing classification and regression tree algorithm s among several decision tree (DT) algorithms.
B.Structured and Text Data(S&T-data): the accuracy of CNN-UDRP(T-Data) and CNN-MDRP(S&T-data) algorithms have little difference but the CNN-MDRP(S&T-data) algorithm is higher and its convergence speed is faster.
The accuracy of risk prediction depends on the feature of the hospital data i.e., the better the feature description of the disease,the higher the accuracy will be. The structured data also the text data of patients based on the proposed CNN-MDRP algorithm.
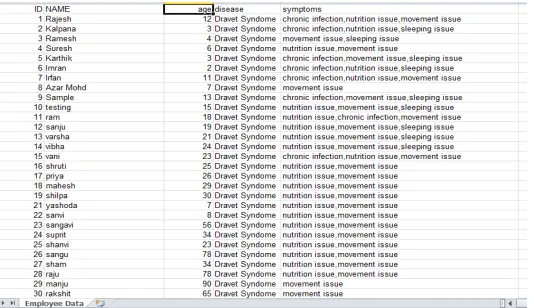
The above figure is the sample data set, where the sample data sheet shows the patient identification number, patient name, age, disease, and the different symptoms for the disease. The disease considered is dravet syndrome.The patient data is stored in the data set. And the file is selected by selecting the file name and the patient file is extracted. Then the content is displayed which shows the complete data set of the patient. Then a particular percentage is entered which is never < 20. The patients data is divided into training dataset and remaining dataset based upon the percentage. Finally the support graph is displayed and the result is collected and predicted based on the sample.
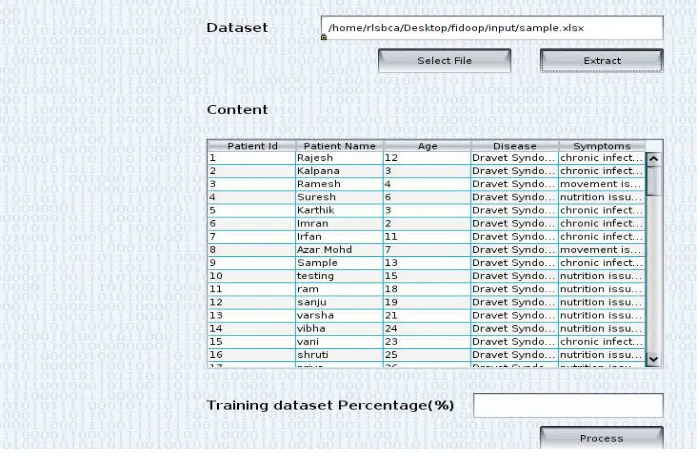
Figure 3: File Extraction
In the figure 3 , the file needs to be selected where the data file of the patients is stored and the file is selected and then the file is extracted . The content contains the patient id ,name, age , disease, and symptoms. The training dataset percentage should be entered and then .The dataset is divided into training set and test set.
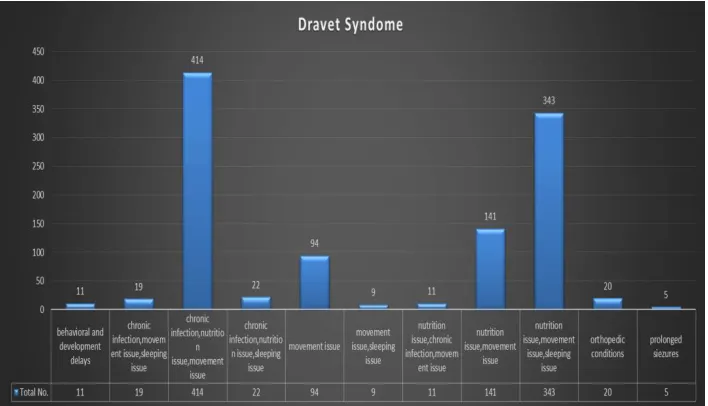
In the figure the support level graph is shown where the the disease is predicted and number of symptoms along with the number of patients is given in the support graph. The support graph displays the symptoms that are shown in the dataset. And gives the percentage for the patients that are suffering from the disease by analysing the no of patients.
Table 1: Disease Symptoms With Number Of Patients
Sl.
no Disease Symptoms
No Of Patients
1 Behavioral And Development Delays 11 2 Chronic Infection, Movement Issue, Sleeping
Issue 19
3 Chronic Infection, Nutrition Issue, Movement
Issue 414
4 Chronic Infection, Nutrition Issue, Sleeping
Issue 22
5 Movement Issue 94 6 Movement Issue, Sleeping Issue 9 7 Nutrition Issue ,Chronic Infection, Movement
Issue 11
8 Nutrition Issue, Movement Issue 141 9 Nutrition Issue, Movement Issue, Sleeping
Issue 343
10 Orthopedic Conditions 20 11 Prolonged Siezures 5
Table 1 illustrates the disease symptoms with number of patients , the number of symptoms for dravet syndrome are given which is a chronic disease along with the number of patients for each symptom.
Figure 5 gives the graphical representation of patients for dravet syndrome it is clear that the total no of patients suffering from chronic infection, nutrition issue and movement issue are the highest and the prolonged siezures is the lowest among all. They are represented graphically.
V. CONCLUSION AND FUTURE SCOPE
By proposing a new convolutional neural network based multimodal disease risk prediction (CNN-MDRP) algorithm is used using structured and unstructured data from hospital. The result is analyzedand theprediction of the disease is done and as per knowledge CNN-MDRP is better. The result can be predicted in real-time application in future.
REFERENCES
1. P. Groves, B. Kayyali, D. Knott, S. van Kuiken, The ‘BigData’ Revolution in Healthcare: Accelerating Value and Innovation, 2016. 2. M. Chen, S. Mao, Y. Liu, "Big data: A survey", Mobile Netw. Appl., vol. 19, pp. 171-209, Apr. 2014.
3. P. B. Jensen, L. J. Jensen, S. Brunak, "Mining electronic health records: Towards better research applications and clinical care", Nature Rev. Genet., vol. 13, no. 6, pp. 395-405, 2012.
4. K. Lin, J. Luo, L. Hu, M. S. Hossain, A. Ghoneim, "Localization based on social big data analysis in the vehicular networks", IEEE Trans. Ind. Informat..
5. .K. Lin, M. Chen, J. Deng, M. M. Hassan, G. Fortino, "Enhanced fingerprinting and trajectory prediction for iot localization in smart buildings", IEEE Trans. Autom. Sci. Eng., vol. 13, no. 3, pp. 1294-1307, Jul. 2016
6. D. Oliver, F. Daly, F. C. Martin, M. E. McMurdo, "Risk factors and risk assessment tools for falls in hospital in-patients: A systematic review", Age Ageing, vol. 33, no. 2, pp. 122-130, 2004.
7. S. Marcoon, A. M. Chang, B. Lee, R. Salhi, J. E. Hollander, "Heart score to further risk stratify patients with low TIMI scores", Critical Pathways Cardiol., vol. 12, no. 1, pp. 1-5, 2013.
8. S. Bandyopadhyay et al., "Data mining for censored time-to-event data: A Bayesian network model for predicting cardiovascular risk from electronic health record data", Data Mining Knowl. Discovery, vol. 29, no. 4, pp. 1033-1069, 2015.
9. J. C. Ho, C. H. Lee, J. Ghosh, "Septic shock prediction for patients with missing data", ACM Trans. Manage. Inf. Syst., vol. 5, no. 1, pp. 1, 2014.
10. Y. Zhang, M. Qiu, C.-W. Tsai, M. M. Hassan, A. Alamri, "Health-CPS: Healthcare cyber-physical system assisted by cloud and big data", IEEE Syst. J., vol. 11, no. 1, pp. 88-95, Mar. 2017.
11. A. Singh, G. Nadkarni, O. Gottesman, S. B. Ellis, E. P. Bottinger, J. V. Guttag, "Incorporating temporal EHR data in predictive models for risk stratification of renal function deterioration", J. Biomed. Inform., vol. 53, pp. 220-228, Feb. 2015.
12. N. Nori, H. Kashima, K. Yamashita, H. Ikai, Y. Imanaka, "Simultaneous modeling of multiple diseases for mortality prediction in acute hospital care", Proc. 21th ACM SIGKDD Int. Conf. Knowl. Discovery Data Mining, pp. 855-864, 2015.
13. S. S. Basu Roy et al., "Dynamic hierarchical classification for patient risk-of-readmission", Proc. 21th ACM SIGKDD Int. Conf. Knowl. Discovery Data Mining, pp. 1691-1700, 2015.
14. Y.-D. Zhang et al., "Fractal dimension estimation for developing pathological brain detection system based on minkowski-bouligand method", IEEE Access, vol. 4, pp. 5937-5947, 2016.