University of Windsor University of Windsor
Scholarship at UWindsor
Scholarship at UWindsor
Electronic Theses and Dissertations Theses, Dissertations, and Major Papers
2015
Shock Interaction with Substrate in a Shock Induced Spray
Shock Interaction with Substrate in a Shock Induced Spray
Process
Process
Kevin Mrozinski University of Windsor
Follow this and additional works at: https://scholar.uwindsor.ca/etd
Recommended Citation Recommended Citation
Mrozinski, Kevin, "Shock Interaction with Substrate in a Shock Induced Spray Process" (2015). Electronic Theses and Dissertations. 5273.
https://scholar.uwindsor.ca/etd/5273
This online database contains the full-text of PhD dissertations and Masters’ theses of University of Windsor students from 1954 forward. These documents are made available for personal study and research purposes only, in accordance with the Canadian Copyright Act and the Creative Commons license—CC BY-NC-ND (Attribution, Non-Commercial, No Derivative Works). Under this license, works must always be attributed to the copyright holder (original author), cannot be used for any commercial purposes, and may not be altered. Any other use would require the permission of the copyright holder. Students may inquire about withdrawing their dissertation and/or thesis from this database. For additional inquiries, please contact the repository administrator via email
Shock Interaction with Substrate in a Shock Induced Spray Process
By
Kevin Mrozinski
A Thesis
Submitted to the Faculty of Graduate Studies through the Department of
Mechanical, Automotive and Materials Engineering in Partial Fulfillment of the Requirements for
the Degree of Master of Applied Science at the University of Windsor
Windsor, Ontario, Canada
2015
SHOCK INTERACTIONS WITH SUBSTRATE IN A SHOCK INDUCED SPRAY PROCESS
By: Kevin Mrozinski
APPROVED BY:
______________________________________________ Dr. R. Carriveau
Department of Civil and Environmental Engineering University of Windsor
______________________________________________ Dr. D. Ting
Department of Mechanical, Automotive and Materials Engineering University of Windsor
______________________________________________ Dr. J. Villafuerte
Industrial Advisor CenterLine (Windsor) Limited
______________________________________________ Dr. G. Rankin, Co-Advisor
Department of Mechanical, Automotive and Materials Engineering University of Windsor
______________________________________________ Dr. B. Jodoin, Co-Advisor
Department of Mechanical Engineering University of Ottawa
iii
Declaration of Co-Authorship / Previous Publication
I. Co-Authorship Declaration
I hereby declare that this thesis incorporates material thatis the result of joint
research through the University of Windsor under the co-supervision of Dr. Gary Rankin,
the University of Ottawa under the co-supervision of Dr. Bertrand Jodoin, and Windsor
Centerline Limited with Dr. Julio Villafuerte acting as an Industry Advisor. Darryl
Beneteau also aided the initial stages of this research, primarily in design of the apparatus
and acquisition of equipment through Centerline Limited. In all cases, the key ideas,
primary contributions, data analysis and interpretation, were performed by the author.
I am aware of the University of Windsor Senate Policy on Authorship and I
certify that I have properly acknowledged the contribution of other researchers to my
thesis, and have obtained written permission from each of the co-author(s) to include the
above material(s) in my thesis. A copy of these letters/emails are provided in Appendix F.
I certify that, with the above qualification, this thesis, and the research to which it
iv
II. Declaration of Previous Publication
This thesis includes one original paper that has been previously published/submitted for
publication in peer reviewed conference proceedings, as follows:
Thesis Chapter Publication title/full citation Publication status*
Chapter 2,3,4 D. Beneteau, K. Mrozinski, G.W. Rankin and
B. Jodoin, Shock Induced Spray Process: Flow
Visualization of The Substrate Impact Region, Proceedings of The Canadian Society for Mechanical Engineering International Congress 2014. Toronto, ON, June 1 – 4, 2014.
Published.
I certify that I have obtained a written permission from the copyright owner(s) to
include the above published material(s) in my thesis. I certify that the above material
describes work completed during my registration as graduate student at the University of
Windsor.
I declare that, to the best of my knowledge, my thesis does not infringe upon
anyone’s copyright nor violate any proprietary rights and that any ideas, techniques,
quotations, or any other material from the work of other people included in my thesis,
published or otherwise, are fully acknowledged in accordance with the standard
referencing practices. Furthermore, to the extent that I have included copyrighted
material that surpasses the bounds of fair dealing within the meaning of the Canada
Copyright Act, I certify that I have obtained a written permission from the copyright
v
I declare that this is a true copy of my thesis, including any final revisions, as
approved by my thesis committee and the Graduate Studies office, and that this thesis has
vi
ABSTRACT
To further the knowledge of the Shock Induced Spray Process (SISP), an
experimental apparatus which simulates Centerline’s Waverider thermal spray gun was
created which uses an unsteady flow to propel solid particles onto a substrate by the use
of a shock wave to produce a coating. Experiments were conducted at a variety of
operating supply pressures, firing frequencies, and stand off distances. A qualitative
analysis was done using a custom Schlieren system along with a high speed camera.
Insight into the flow behaviour in the SISP was established with the definition of six
distinct phases. The formation of a bow shock, which is known to be detrimental to the
SISP operation, is shown to be more prominent in the cases with higher supply pressure
and close proximity of the apparatus exit to the substrate than with changes in firing
vii
DEDICATION
If I Have Seen Further It Is By Standing On The Shoulder Of Giants.
– Sir Isaac Newton
Discoveries are not always instant or planned.
This is for anyone furthering any area of research
viii
ACKNOWLEDGEMENTS
I would like to fully thank both of my thesis supervisors, Dr. Gary Rankin and Dr.
Bertrand Jodoin, for their continued guidance and encouragement during my time as a
graduate student. Their knowledge and patience was key to allow me to fully enjoy my
time at the University of Windsor.
I would also like to thank Darryl Beneteau who first began work on this project
and accepted me to come aboard to aid in the research of this thermal spray technology. I
would further like to thank Dr. Julio Villafuerte for his direction and Centerline
(Windsor) Limited for their industrial contributions to the project. They, along with
NSERC and the Ontario Centres of Excellence, provided the funding and in kind
contributions, without which this work would have been impossible.
Of course I would like to thank my parents, Margaret and Marek Mrozinski for
their continued support and encouragement to pursue a post graduate education which I
now know will pay off in the long run. Finally I would like to heart fully thank my
long-time girlfriend Caitlin Towsley for all her support, patience, encouragement, love and
resilience through these years.
ix
TABLE OF CONTENTS
DECLARATION OF CO-AUTHORSHIP / PREVIOUS PUBLICATION ... iii
ABSTRACT ... vii
DEDICATION ... vii
ACKNOWLEDGEMENTS ... viii
LIST OF TABLES ... xi
LIST OF FIGURES ... xviii
NOMENCLATURE ... xxvii
CHAPTER 1 Introduction...1
1.1 Thermal Spray Process ...1
1.2 Shock Induced Spray Process ...6
CHAPTER 2 Literature Review and Objectives ...9
2.1 Schlieren Method...9
2.2 Fundamental Steady Compressible Flow Concepts ...11
2.2.1 Steady Supersonic Jets ...12
2.2.2 Steady Supersonic Jet Impacting Substrate (The Bow Shock) ...18
2.3 Traveling Shock Waves and the SISP ...20
2.3.1 The Shock Tube and Physiscs Behind the SISP ...20
2.3.2 Experimental Research Involving Shock Induced Flow ...24
2.4 Objectives ...27
CHAPTER 3 Experiment Apparatus and Procedure ...29
3.1 Experimental Flow Facility ...29
3.2 Centerline Custom Rotary Motor/Valve Assembly...30
3.3 SISP Thermal Spray Apparatus ...31
3.4 Schlieren Apparatus ...33
3.5 Substrate, Viewing Area and Camera ...35
x
CHAPTER 4 Results and Discussion ...39
4.1 Cycle Events ...39
4.1.1 Appearance of Initial Shock Wave ...39
4.1.2 Initial Shock Wave Impacts Substrate and Reflects ...40
4.1.3 Reflected Shock Impacts Exit Nozzle ...41
4.1.4 Vortex Ring Formation Leaves Nozzle ...41
4.1.5 Vortex Ring Formation Impacts Substrate ...42
4.1.6 Vortex Ring Formation Dissipates ...43
4.1.7 Initial Indication of Accelerated Flow ...44
4.1.8 First Appearance of Shock Diamonds in Flow ...45
4.1.9 Formation of Lasting Bow Shock ...46
4.1.10 Last Appearance of Bow Shock ...47
4.1.11 Last Appearance of Shock Diamonds ...48
4.1.12 Completion of the Cycle ...49
4.2 Single Cycle Analysis of Substrate Pressure ...50
4.3 Phases of Flow ...54
4.4 Analysis of the Phases ...56
4.5 Substrate Pressure...66
CHAPTER 5 Conclusions...67
CHAPTER 6 Recommendation for Future Work ...70
REFERENCES/BIBLIOGRAPHY...71
APPENDICES ...74
Appendix A LabVIEW Program ...74
Appendix B Single Cycle Pressure Graphs ...75
Appendix C Frame Tables...91
Appendix D Phase Tables ...111
Appendix E Substrate Pressure Graphs ...123
Appendix F Written Permissions from Copyright Holders ...141
Appendix G Uncertainty Analysis ...153
xi
List of Tables
Table 1 Experimental Variables……….………....…38
Table 2 Frame Table for a Supply Pressure of 3.45 MPa Firing at 5 Hz
at 10mm SOD……….………...56
Table 3 Phase Table for a Supply Pressure of 3.45 MPa Firing at 5 Hz
at 10mm SOD………....56
Table C1 Frame Table for a Supply Pressure of 2 MPa Firing at 5 Hz
at 10mm SOD……….………..…...93
Table C2 Frame Table for a Supply Pressure of 2 MPa Firing at 5 Hz
at 20mm SOD……….………...93
Table C3 Frame Table for a Supply Pressure of 2 MPa Firing at 5 Hz
at 30mm SOD……….………..…...94
Table C4 Frame Table for a Supply Pressure of 2 MPa Firing at 10 Hz
at 10mm SOD……….………...94
Table C5 Frame Table for a Supply Pressure of 2 MPa Firing at 10 Hz
at 20mm SOD……….………..…...95
Table C6 Frame Table for a Supply Pressure of 2MPa Firing at 10 Hz
at 30mm SOD……….………...95
Table C7 Frame Table for a Supply Pressure of 2 MPa Firing at 20 Hz
at 10mm SOD……….………...96
Table C8 Frame Table for a Supply Pressure of 2 MPa Firing at 20 Hz
at 20mm SOD……….………...96
Table C9 Frame Table for a Supply Pressure of 2 MPa Firing at 20 Hz
xii
Table C10 Frame Table for a Supply Pressure of 2 MPa Firing at 30 Hz
at 10mm SOD……….………..…...97
Table C11 Frame Table for a Supply Pressure of 2 MPa Firing at 30 Hz
at 20mm SOD……….………...98
Table C12 Frame Table for a Supply Pressure of 2 MPa Firing at 30 Hz
at 30mm SOD……….………...98
Table C13 Frame Table for a Supply Pressure of 3.45 MPa Firing at 5 Hz
at 10mm SOD……….………..…...99
Table C14 Frame Table for a Supply Pressure of 3.45 MPa Firing at 5 Hz
at 20mm SOD……….………..…...99
Table C15 Frame Table for a Supply Pressure of 3.45 MPa Firing at 10 Hz
at 30mm SOD……….………...100
Table C16 Frame Table for a Supply Pressure of 3.45 MPa Firing at 10 Hz
at 10mm SOD……….………...100
Table C17 Frame Table for a Supply Pressure of 3.45 MPa Firing at 10 Hz
at 20mm SOD……….………...101
Table C18 Frame Table for a Supply Pressure of 3.45 MPa Firing at 10 Hz
at 30mm SOD……….………...101
Table C19 Frame Table for a Supply Pressure of 3.45 MPa Firing at 20 Hz
at 10mm SOD……….………...102
Table C20 Frame Table for a Supply Pressure of 3.45 MPa Firing at 20 Hz
xiii
Table C21 Frame Table for a Supply Pressure of 3.45 MPa Firing at 20 Hz
at 30mm SOD……….………...103
Table C22 Frame Table for a Supply Pressure of 3.45 MPa Firing at 30 Hz
at 20mm SOD……….………...103
Table C23 Frame Table for a Supply Pressure of 3.45 MPa Firing at 30 Hz
at .0mm SOD……….………...104
Table C24 Frame Table for a Supply Pressure of 4.8 MPa Firing at 30 Hz
at 10mm SOD……….………...104
Table C25 Frame Table for a Supply Pressure of 4.8 MPa Firing at 5 Hz
at 20mm SOD……….………...105
Table C26 Frame Table for a Supply Pressure of 4.8MPa Firing at 5 Hz
at 30mm SOD……….………...105
Table C27 Frame Table for a Supply Pressure of 4.8MPa Firing at 10 Hz
at 10mm SOD……….………...106
Table C28 Frame Table for a Supply Pressure of 4.8 MPa Firing at 10 Hz
at 20mm SOD……….………...106
Table C29 Frame Table for a Supply Pressure of 4.8 MPa Firing at 10 Hz
at 30mm SOD……….………...107
Table C30 Frame Table for a Supply Pressure of 4.8 MPa Firing at 20 Hz
at 10mm SOD……….………...107
Table C31 Frame Table for a Supply Pressure of 4.8 MPa Firing at 20 Hz
xiv
Table C32 Frame Table for a Supply Pressure of 4.8 MPa Firing at 20 Hz
at 30mm SOD……….………...108
Table C33 Frame Table for a Supply Pressure of 4.8 MPa Firing at 30 Hz
at 10mm SOD……….………...109
Table C34 Frame Table for a Supply Pressure of 4.8 MPa Firing at 30 Hz
at 20mm SOD……….………...109
Table C35 Frame Table for a Supply Pressure of 4.8 MPa Firing at 30 Hz
at 30mm SOD……….………...110
Table D1 Frame Table for a Supply Pressure of 2 MPa Firing at 5 Hz
at 10mm SOD……….………...111
Table D2 Frame Table for a Supply Pressure of 2 MPa Firing at 5 Hz
at 20mm SOD……….………...111
Table D3 Frame Table for a Supply Pressure of 2 MPa Firing at 5 Hz
at 30mm SOD……….………...111
Table D4 Frame Table for a Supply Pressure of 2MPa Firing at 10 Hz
at 10mm SOD……….………...112
Table D5 Frame Table for a Supply Pressure of 2 MPa Firing at 10 Hz
at 20mm SOD……….………...112
Table D6 Frame Table for a Supply Pressure of 2 MPa Firing at 10 Hz
at 30mm SOD……….………...112
Table D7 Frame Table for a Supply Pressure of 2 MPa Firing at 20 Hz
xv
Table D8 Frame Table for a Supply Pressure of 2 MPa Firing at 20 Hz
at 20mm SOD……….………...113
Table D9 Frame Table for a Supply Pressure of 2 MPa Firing at 20 Hz
at 30mm SOD……….………...113
Table D10 Frame Table for a Supply Pressure of 2 MPa Firing at 30 Hz
at 10mm SOD……….………...114
Table D11 Frame Table for a Supply Pressure of 2 MPa Firing at 30 Hz
at 20mm SOD……….………...114
Table C12 Frame Table for a Supply Pressure of 2 MPa Firing at 30 Hz
at 30mm SOD……….………...114
Table D13 Frame Table for a Supply Pressure of 3.45 MPa Firing at 5 Hz
at 20mm SOD……….………...115
Table D14 Frame Table for a Supply Pressure of 3.45 MPa Firing at 5 Hz
at 30mm SOD……….………...115
Table D15 Frame Table for a Supply Pressure of 3.45 MPa Firing at 10 Hz
at 10mm SOD……….………...115
Table D16 Frame Table for a Supply Pressure of 3.45 MPa Firing at 10 Hz
at 20mm SOD……….………...116
Table D17 Frame Table for a Supply Pressure of 3.45 MPa Firing at 10 Hz
at 30mm SOD……….………...116
Table D18 Frame Table for a Supply Pressure of 3.45 MPa Firing at 20 Hz
xvi
Table D19 Frame Table for a Supply Pressure of 3.45 MPa Firing at 20 Hz
at 20mm SOD……….………...117
Table D20 Frame Table for a Supply Pressure of 3.45 MPa Firing at 20 Hz
at 30mm SOD……….………...117
Table D21 Frame Table for a Supply Pressure of 3.45 MPa Firing at 30 Hz
at 10mm SOD……….………...117
Table D22 Frame Table for a Supply Pressure of 3.45 MPa Firing at 30 Hz
at 20mm SOD……….………...118
Table D23 Frame Table for a Supply Pressure of 3.45 MPa Firing at 30 Hz
at 30mm SOD……….………...118
Table D24 Frame Table for a Supply Pressure of 4.8 MPa Firing at 5 Hz
at 10mm SOD……….………...118
Table D25 Frame Table for a Supply Pressure of 4.8 MPa Firing at 5 Hz
at 20mm SOD……….………...119
Table D26 Frame Table for a Supply Pressure of 4.8 MPa Firing at 5 Hz
at 30mm SOD……….………...119
Table D27 Frame Table for a Supply Pressure of 4.8 MPa Firing at 10 Hz
at 10mm SOD……….………...119
Table D28 Frame Table for a Supply Pressure of 4.8 MPa Firing at 10 Hz
at 20mm SOD……….………...120
Table D29 Frame Table for a Supply Pressure of 4.8 MPa Firing at 10 Hz
xvii
Table D30 Frame Table for a Supply Pressure of 4.8 MPa Firing at 20 Hz
at 10mm SOD……….………...120
Table D31 Frame Table for a Supply Pressure of 4.8 MPa Firing at 20 Hz
at 20mm SOD……….………...121
Table D32 Frame Table for a Supply Pressure of 4.8 MPa Firing at 20 Hz
at 30mm SOD……….………...121
Table D33 Frame Table for a Supply Pressure of 4.8 MPa Firing at 30 Hz
at 10mm SOD……….………...121
Table D34 Frame Table for a Supply Pressure of 4.8 MPa Firing at 30 Hz
at 20mm SOD……….………...122
Table D35 Frame Table for a Supply Pressure of 4.8 MPa Firing at 30 Hz
xviii
List of Figures
Figure 1 Schematic of the Flame Spray Process………..2
Figure 2 Schematic of a Detonation Gun Spray Process……….4
Figure 3 Schematic of a Cold Gas Dynamic Spray……….…...….6
Figure 4 Schematic of a Shock Induced Spray Process……….……..…7
Figure 5 Comparison of Exit Flows from CGDS and SISP………..…….…...…..8
Figure 6 The Schlieren Method………..…...11
Figure 7 Schlieren Images of the Plume of a Candle………..…..11
Figure 8 Underexpanded Supersonic Flow Exiting a Nozzle………..…..14
Figure 9 Perfectly Expanded Jet Exiting a Nozzle……….……..….14
Figure 10 Overexpanded Supersonic Flow Exiting a Nozzle………..…..15
Figure 11 Shock Diamonds in Supersonic Flow Exiting a Straight Nozzle…………..…16
Figure 12 Shock Diamond Structure`s Wavelength at M=1.166………...17
Figure 13 Shock Diamond Structure`s Wavelength at M=2.24……….,.…..17
Figure 14 Schematic of a Bow Shock Created by a Supersonic Flow……….…..…19
Figure 15 A Diagram of a Shock Tube……….…….…20
Figure 16 Diagram of the Physics of the SISP………...22
Figure 17 Temperature Graph of SISP Zones………...23
Figure 18 Elder and Hass’ Shockwave and Vortex Rings………..…..…...25
Figure 19 Ishii’s Initial Shock, Secondary Shock and Mach………...26
Figure 20 Endo’s Schlieren with Initial Shockwave and Vortices……….….…..27
Figure 21 Experimental Set up……….…….30
Figure 22 Rotary Motor/Valve Assembly a) Schematic Drawing………..….31
xix
c) Photograph of Assembly………..31
Figure 23 SISP Thermal Spray Apparatus Design………....32
Figure 24 Actual SISP Thermal Spray Apparatus……….…33
Figure 25 Diagram of Schlieren Apparatus……….…..34
Figure 26 Photo of Actual Schlieren Apparatus………....34
Figure 27 Viewing Area……….36
Figure 28 Image with Initial Shock Wave Front…….……….….40
Figure 29 Image with No Shock Wave………..……….….…...40
Figure 30 Reflected Shock Wave……….….41
Figure 31 Reflected Shock Wave and Vortex Ring Leaving Exit Nozzle………….…...42
Figure 32 Vortex Ring Travelling Across Gap a) Near Nozzle Exit………..…..43
b) Near Middle of Gap……….…...43
c) As it Impacts the Substrate………...43
Figure 33 Vortex Impacting and Dissipating on Substrate a) Impacting……….44
b) Dissipating………...…....44
Figure 34 Accelerated Flow Leaving Nozzle……….…...…45
Figure 35 Stages in the formation of shock diamonds a) Initial Formation……….…..46
b) Increasing Intensity………...….46
c) Fully Developed Diamonds………...….46
xx
b) Conditions: 4.8 MPa, 10 Hz, 10mm SOD………47
Figure 37 Bow Shock Subsides………...48
Figure 38 Last Appearance of Shock Diamonds………...49
Figure 39 Next Cycle’s Initial Shock Wave………..50
Figure 40 Pressure vs Time of a Single Cycle with a Double Peak………...52
Figure 41 Pressure vs Time of a Single Cycle with a Single Peak……….………...53
Figure 42 Noise in Pressure Transducer Readings………...……….54
Figure 43 Average Times for Phase 1: Duration of Cycle Period……….58
Figure 44 Average Times for Phase 2: The Initial Shock Wave and Its Reflection..……59
Figure 45 Average Times for Phase 3: Existence of the Vortex Ring ……….60
Figure 46 Average Times for Phase 4: The Calmness of the Flow………...…61
Figure 47 Average Times for Phase 5: The Supersonic Jet………...62
Figure 48 Average Times for Phase 6: Presence of Lasting Bow Shock………..63
Figure 49 Substrate Pressure Graph………...64
Figure 50 Average Peak Pressures………...66
Figure B1 Single Cycle Pressure for a Supply Pressure of 2 MPa Firing at 5 Hz at 10mm SOD……….………...75
Figure B2 Single Cycle Pressure for a Supply Pressure of 2 MPa Firing at 5 Hz at 20mm SOD……….………...75
Figure B3 Single Cycle Pressure for a Supply Pressure of 2 MPa Firing at 5 Hz at 30mm SOD……….………..…...76
xxi
Figure B5 Single Cycle Pressure for a Supply Pressure of 2 MPa Firing at 10 Hz
at 20mm SOD……….………...77
Figure B6 Single Cycle Pressure for a Supply Pressure of 2 MPa Firing at 10 Hz
at 30mm SOD……….………...77
Figure B7 Single Cycle Pressure for a Supply Pressure of 2 MPa Firing at 20 Hz
at 10mm SOD……….………...78
Figure B8 Single Cycle Pressure for a Supply Pressure of 2 MPa Firing at 20 Hz
at 20mm SOD……….………...78
Figure B9 Single Cycle Pressure for a Supply Pressure of 2 MPa Firing at 20 Hz
at 30mm SOD……….………...79
Figure B10 Single Cycle Pressure for a Supply Pressure of 2 MPa Firing at 30 Hz
at 10mm SOD……….………...79
Figure B11 Single Cycle Pressure for a Supply Pressure of 2 MPa Firing at 30 Hz
at 20mm SOD……….………...80
Figure B12 Single Cycle Pressure for a Supply Pressure of 2 MPa Firing at 30 Hz
at 30mm SOD……….………...80
Figure B13 Single Cycle Pressure for a Supply Pressure of 3.45 MPa Firing at 5 Hz
at 20mm SOD……….………...81
Figure B14 Single Cycle Pressure for a Supply Pressure of 3.45 MPa Firing at 5 Hz
at 30mm SOD……….………..…...81
Figure B15 Single Cycle Pressure for a Supply Pressure of 3.45 MPa Firing at 10 Hz
xxii
Figure B16 Single Cycle Pressure for a Supply Pressure of 3.45 MPa Firing at 10 Hz
at 20mm SOD……….………...82
Figure B17 Single Cycle Pressure for a Supply Pressure of 3.45 MPa Firing at 10 Hz
at 30mm SOD……….………...83
Figure B18 Single Cycle Pressure for a Supply Pressure of 3.45 MPa Firing at 20 Hz
at 10mm SOD……….………...83
Figure B19 Single Cycle Pressure for a Supply Pressure of 3.45 MPa Firing at 20 Hz
at 20mm SOD……….………...84
Figure B20 Single Cycle Pressure for a Supply Pressure of 3.45 MPa Firing at 20 Hz
at 30mm SOD……….………...84
Figure B21 Single Cycle Pressure for a Supply Pressure of 3.45 MPa Firing at 30 Hz
at 10mm SOD……….………..……...85
Figure B22 Single Cycle Pressure for a Supply Pressure of 3.45 MPa Firing at 30 Hz
at 20mm SOD……….………...85
Figure B23 Single Cycle Pressure for a Supply Pressure of 3.45 MPa Firing at 30 Hz
at 30mm SOD……….………...86
Figure B24 Single Cycle Pressure for a Supply Pressure of 4.8 MPa Firing at 5 Hz
at 10mm SOD……….………...86
Figure B25 Single Cycle Pressure for a Supply Pressure of 4.8 MPa Firing at 5 Hz
at 20mm SOD……….………..…...87
Figure B26 Single Cycle Pressure for a Supply Pressure of 4.8 MPa Firing at 5 Hz
xxiii
Figure B27 Single Cycle Pressure for a Supply Pressure of 4.8 MPa Firing at 10 Hz
at 10mm SOD……….………...88
Figure B28 Single Cycle Pressure for a Supply Pressure of 4.8 MPa Firing at 10 Hz
at 20mm SOD……….………...88
Figure B29 Single Cycle Pressure for a Supply Pressure of 4.8 MPa Firing at 10 Hz
at 30mm SOD……….………...89
Figure B30 Single Cycle Pressure for a Supply Pressure of 4.8 MPa Firing at 20 Hz
at 10mm SOD……….………...89
Figure B31 Single Cycle Pressure for a Supply Pressure of 4.8 MPa Firing at 20 Hz
at 20mm SOD……….………...90
Figure B32 Single Cycle Pressure for a Supply Pressure of 4.8 MPa Firing at 20 Hz
at 30mm SOD……….………...90
Figure B33 Single Cycle Pressure for a Supply Pressure of 4.8 MPa Firing at 30 Hz
at 10mm SOD……….………...91
Figure B34 Single Cycle Pressure for a Supply Pressure of 4.8 MPa Firing at 30 Hz
at 20mm SOD……….………...91
Figure B35 Single Cycle Pressure for a Supply Pressure of 4.8 MPa Firing at 30 Hz
at 30mm SOD……….………...92
Figure E1 Single Cycle Pressure for a Supply Pressure of 2 MPa Firing at 5 Hz
at 10mm SOD……….………...123
Figure E2 Single Cycle Pressure for a Supply Pressure of 2 MPa Firing at 5 Hz
xxiv
Figure E3 Single Cycle Pressure for a Supply Pressure of 2 MPa Firing at 5 Hz
at 30mm SOD……….………...124
Figure E4 Single Cycle Pressure for a Supply Pressure of 2MPa Firing at 10 Hz
at 10mm SOD……….………...124
Figure E5 Single Cycle Pressure for a Supply Pressure of 2 MPa Firing at 10 Hz
at 20mm SOD……….………...125
Figure E6 Single Cycle Pressure for a Supply Pressure of 2 MPa Firing at 10 Hz
at 30mm SOD……….………...125
Figure E7 Single Cycle Pressure for a Supply Pressure of 2 MPa Firing at 20 Hz
at 10mm SOD……….………...126
Figure E8 Single Cycle Pressure for a Supply Pressure of 2 MPa Firing at 20 Hz
at 20mm SOD……….………...126
Figure E9 Single Cycle Pressure for a Supply Pressure of 2 MPa Firing at 20 Hz
at 30mm SOD……….………...127
Figure E10 Single Cycle Pressure for a Supply Pressure of 2 MPa Firing at 30 Hz
at 10mm SOD……….………...127
Figure E11 Single Cycle Pressure for a Supply Pressure of 2 MPa Firing at 30 Hz
at 20mm SOD……….………...128
Figure E12 Single Cycle Pressure for a Supply Pressure of 2 MPa Firing at 30 Hz
at 30mm SOD……….………...128
Figure E13 Single Cycle Pressure for a Supply Pressure of 3.45 MPa Firing at 5 Hz
xxv
Figure E14 Single Cycle Pressure for a Supply Pressure of 3.45 MPa Firing at 5 Hz
at 30mm SOD……….………...129
Figure E15 Single Cycle Pressure for a Supply Pressure of 3.45 MPa Firing at 10 Hz
at 10mm SOD……….………...130
Figure E16 Single Cycle Pressure for a Supply Pressure of 3.45 MPa Firing at 10 Hz
at 20mm SOD……….………...130
Figure E17 Single Cycle Pressure for a Supply Pressure of 3.45 MPa Firing at 10 Hz
at 30mm SOD……….………...131
Figure E18 Single Cycle Pressure for a Supply Pressure of 3.45 MPa Firing at 20 Hz
at 10mm SOD……….………...131
Figure E19 Single Cycle Pressure for a Supply Pressure of 3.45 MPa Firing at 20 Hz
at 20mm SOD……….………...132
Figure E20 Single Cycle Pressure for a Supply Pressure of 3.45 MPa Firing at 20 Hz
at 30mm SOD……….………...132
Figure E21 Single Cycle Pressure for a Supply Pressure of 3.45 MPa Firing at 30 Hz
at 10mm SOD……….………...133
Figure E22 Single Cycle Pressure for a Supply Pressure of 3.45 MPa Firing at 30 Hz
at 20mm SOD……….………...133
Figure E23 Single Cycle Pressure for a Supply Pressure of 3.45 MPa Firing at 30 Hz
at 30mm SOD……….………...134
Figure E24 Single Cycle Pressure for a Supply Pressure of 4.8 MPa Firing at 5 Hz
xxvi
Figure E25 Single Cycle Pressure for a Supply Pressure of 4.8 MPa Firing at 5 Hz
at 20mm SOD……….………...135
Figure E26 Single Cycle Pressure for a Supply Pressure of 4.8 MPa Firing at 5 Hz
at 30mm SOD……….………...135
Figure E27 Single Cycle Pressure for a Supply Pressure of 4.8 MPa Firing at 10 Hz
at 10mm SOD……….………...136
Figure E28 Single Cycle Pressure for a Supply Pressure of 4.8 MPa Firing at 10 Hz
at 20mm SOD……….………...136
Figure E29 Single Cycle Pressure for a Supply Pressure of 4.8 MPa Firing at 10 Hz
at 30mm SOD……….………...137
Figure E30 Single Cycle Pressure for a Supply Pressure of 4.8 MPa Firing at 20 Hz
at 10mm SOD……….………...137
Figure E31 Single Cycle Pressure for a Supply Pressure of 4.8 MPa Firing at 20 Hz
at 20mm SOD……….………...138
Figure E32 Single Cycle Pressure for a Supply Pressure of 4.8 MPa Firing at 20 Hz
at 30mm SOD……….………...138
Figure E33 Single Cycle Pressure for a Supply Pressure of 4.8 MPa Firing at 30 Hz
at 10mm SOD……….………...139
Figure E34Single Cycle Pressure for a Supply Pressure of 4.8 MPa Firing at 30 Hz
at 20mm SOD……….………...139
Figure E35 Single Cycle Pressure for a Supply Pressure of 4.8 MPa Firing at 30 Hz
at 30mm SOD……….………...140
xxvii
Nomenclature
Symbols
a Area
c Speed of Sound
BPP Uncertainty in Instrument
D Diameter
Fps Frames per Second
M Mach Number
PPeaki Peak Pressure Value
∅ Phase Duration
p Pressure
SOD Stand off Distance
T Temperature
V Velocity
x Axial Position
γ Gas Constant
FR Frame Rate
S Sensitivity
R Resolution
CD Cycle Duration
W𝐶𝐷 Uncertainty in Cycle Duration
PMR Pressure Transducer Maximum Range Value
xxviii
WCW Uncertainty in Width of Channel
WCH Uncertainty in Height of Channel
WAC Uncertainty in Area of Channel
WPP Uncertainty in Peak Pressure
W∅ Uncertainty in Phase Duration
WTP Uncertainty in Image Capture
WSP Uncertainty in Supply Pressure
PPeakavg Average Peak Pressure Value
tv,95 Student t Distribution Value
TCS Temperature Coefficient of Sensitivity
Emin Pressure Transducer Minimum Voltage
PPP Uncertainty in Average Peak Pressure
tLF Time of Last Frame in Phase
tFF Time of First Frame in Phase
I Interval of Pressure Gauge
Wf Uncertainty in Frequency
Bf Uncertainty in Oscilloscope
Pf Uncertainty in Cycle Duration
fi Inverse of Cycle Duration Value
xxix
Subscripts
1 Relating to Zone 1 2 Relating to Zone 2
3 Relating to Zone 3 4 Relating to Zone 4
1
Chapter 1 Introduction
In this chapter, a background of thermal spray processes is given focusing on
certain types; Flame, Detonation Gun, High Velocity Oxy Fuel (HVOF) and Cold Gas
Dynamic Spraying (CGDS), to show the variations of techniques available. This will also
include a description of a newer variation of CGDS called the Shock Induced Spray
Process (SISP) which is the main object of this thesis.
1.1Thermal Spray Process
Thermal spray processes are an effective way to increase both the performance and
longevity of a material by improving its surface properties. Though there are many
different thermal spray processes, the common feature for most of them is that molten or
semi-molten particles are deposited onto the desired substrate to be coated. Depending on
the specific spray process, the particles use either more thermal energy or more kinetic
energy to cause them to adhere to the substrate upon impact. These particles deform
plastically due to shear straining forces and embed themselves onto the substrate. How
these particles increase performance of the base layer relies on the type of particles in the
feedstock and their density. Current technologies allow spray of a wide range of materials
such as metals, ceramics and cermets, however continued research is being conducted to
maximize deposition efficiency and coating properties. Depending on the material used,
thermal spray processes are able to increase the corrosion, wear and oxidation resistance,
electrical insulation and many other important qualities [1].
The first thermal spray device was Schoop’s flame spray gun, patented in the
2
automation as it was realized that application of many thin layers of coating provided a
higher quality, typically spraying at 2-4 ft/s (0.6-1.2 m/s) [3]. There are two types of
flame sprayers, powder fed or wire fed. In a powder fed flame gun, Figure 1, an oxygen
fuel flame is produced near the end of the nozzle and the particles are accelerated through
this area and heated through contact with the exiting combustion gases. The thermal
energy of the flame melts, or partially melts, these particles prior to their impact and
adherence to the substrate. The wire fed flame gun works in a similar fashion however,
instead of particles being injected into the flow, a wire is melted at the exit and the
resulting droplets propelled by a dispersing gas such as compressed air. The flame fuel
temperature will vary from 2700 K to 3170 K, the lower value obtained with methane and
the higher value with acetylene [2,4]. Particle velocities are in the range of 80-100 m/s at
a stand off distance of 120-250 mm [3]. Though flame spraying is the oldest method it is
still used today, mostly for wear protection coating production in a variety of industries
such as steel, chemical, glass producing and mining.
3
The detonation gun, or D-gun, spray process was developed more than 50 years after
the flame spray process by Union Carbide Industrial Gases (now Praxair, Inc.) [2]. As
one can deduce from the name, the detonation gun uses a combustion method to
accelerate particles onto a substrate. As seen in Figure 2, the apparatus resembles an
engine block with a combustion chamber, three valves, a spark plug and a powder inlet.
The process begins with acetylene and oxygen being released through their respective
valves while the spray powder is fed from the back of the gun. The chamber is ignited by
the spark plug resulting in a detonation wave that travels down the barrel taking the
powder particles with it. The particles use the kinetic and thermal energy from the
explosion to obtain a speed upwards of 1000 m/s and a temperature of 4500 K with a
typical stand off distance of 100 mm. Since the detonation gun is capable of operating at
a repetition rate of anywhere between 1 to 15 Hz the chamber must be clear of all
remnants of the previous cycle so after the gas is ignited the third valve opens to purge
the chamber with an inert gas such as nitrogen. Referring back to the engine analogy, the
chamber experiences high temperatures and must be cooled which is typically done with
liquid water [2,5]. It is important to note that, unlike the flame spray technology, this is
4
Figure 2 Schematic of a Detonation Gun Spray Process Reproduced with Permission [4]
Similar to the detonation gun spray technology, High Velocity Oxy Fuel spraying
also uses a combustion chamber within its gun. The main difference is that the burning is
constant due to continually fed paths of the oxygen and fuel into the combustion
chamber. This is similar to the flame spraying technique except that the gases are
pressurized up to 1 MPa. The flame reaches a temperature of around 3000 K but the
particles have a higher kinetic energy than thermal energy in this process with the flow
reaching speeds up to 2000 m/s due to the use of a de Laval nozzle [6]. The result, due to
the high velocity, is a coating of high density, bond strength and toughness [7]. The stand
off distance is typically in the 150 mm to 300 mm range. There is also research being
conducted on a method called suspension spraying that feeds the particles with a carrier
liquid instead of gas. Although nano-structured coatings can be sprayed the method is not
yet well developed [8].
One of the newest spray methods is the Cold Gas Spray coating process which
was invented by accident [9]. In the 1980’s a Russian research team was designing
atmospheric re-entry vehicles and used a supersonic wind tunnel with metallic particles
5
formed a coating similar to a thermal spray process. This technique was soon patented
and is being investigated by researchers all over the world and some manufacturers now
offer commercial cold spray systems. Figure 3 shows a diagram of the basic
configuration of this process. The gas enters the apparatus under high pressure, up to 5
MPa, where some of the gas travels directly to the powder feeder and the rest runs
through a heating coil that warms the gas up to 1100˚C. The two gases then meet within
the barrel of the gun where they travel through a converging diverging de Laval nozzle
that forms a supersonic jet. The particles enter this jet and are ejected from the barrel at a
speed between 600 to 1000 m/s. As the name would suggest, the temperature of most of
the impacting particles is only in the range of 400 K to 500 K, below the melting
temperature of most sprayed metals and ceramics however, some particles experience a
molten impact [9,10]. This is a steady flow process with a nozzle area that is 10 to 15
mm2 and a stand off distance of 5 to 25 mm. The important advantage of this technique is
that since the majority of particles are not molten during their flight they experience less
oxidation than in other spray processes which creates a higher quality coating for
6
Figure 3 Schematic of a Cold Gas Dynamic Spray Reproduced with Permission [5]
1.2Shock Induced Spray Process
The Shock Induced Spray Process (SISP), Figure 4, was invented by Dr. Bertrand
Jodoin from the University of Ottawa and co-advisor to this project. Similar to CGDS,
the SISP propels particles well below their melting temperatures onto a substrate,
however in a periodic rather than continuous manner. Unlike the CGDS case in which
the particles experience a large cooling rate as they travel through the nozzle, they
maintain most of their thermal energy as they leave the SISP nozzle. This is achieved
through the use of compression waves, generated by the opening of a valve which
coalesce to form a shockwave that travels down the barrel and out the exit of the nozzle.
The strength of the shockwave depends on the pressure difference on the two sides of the
valve; typically the barrel section will be at atmospheric conditions as it is open to
atmosphere at the exit. The particles are dispensed into the barrel through a powder
7
gas to the particles. Since the flow is pulsed, the gas volume is limited therefore the gas
can potentially lose too much thermal energy to the particles which would decrease the
effectiveness of the coating obtained with this technique. This implies there is a
maximum number of particles that each flow can effectively spray. After the shockwave
passes the powder in the barrel it creates a high speed intermediate temperature flow of
gas that heats and accelerates the particles. Traveling within this zone the particles are
heated thus lowering the required critical velocity, which is the required velocity that the
particle must reach in order to adhere to the substrate. This is an advantage compared to
the CGDS process in which passage through the diverging portion of the nozzle cools the
particles [11,12].
Figure 4 Schematic of a Shock Induced Spray Process Reproduced with Permission [13]
Since the flow fluctuation occurs at a certain frequency controlled by the valve, it
exits the nozzle as pulses that contain clusters or lumps of the feedstock material as
shown in Figure 5. This has been shown to be capable of depositing very hard particle
8
found on the substrate when injected in a 60% feedstock powder where the SISP saw a
42% deposition percentage [14]. It is thought that the cluster of particles do not bounce
off the substrate as much as in the CGDS case due to the fact that the initial impact
creates a softer area on which the rest of the cloud of particles can adhere [14].
9
Chapter 2 Literature Review
This chapter will first take a look at the Schlieren technique and then the
fundamentals behind normal shock waves and their formation in compressible flows.
Next, the three conditions for supersonic flow exiting a nozzle are explained with a more
detailed analysis on shock diamonds and their variation with exit Mach Number. This
will lead to a discussion of the interaction of the flow and the substrate, more specifically
the formation of the Bow shockwave and its influence on the flow. The shock tube and
this experiment’s SISP are then described with references to previous research conducted
in this field. Finally, the objectives of this project are presented.
2.1 Schlieren Method
Schlieren photography has been in existence for over a century and is closely
related to a simpler technique called the shadowgraph [15]. Whenever there is an
in-homogeneity of density within the medium being observed, the density variations deflect
the light in such a way that some regions become brighter and some darker (shadows)
which can be captured on an image called a shadowgraph. The shadowgraph produces
images in which darkness or greyscale level is proportional to the second spatial
derivative of the density variation within the field of view [15]. To provide a higher
quality image the Schlieren technique incorporates a series of lenses to capture even the
slightest deflection of light through the variable density body. The result is the ability to
capture very small changes in density due to pressure and temperature allowing the visual
capture of interactions of gas and particles on a macroscopic level [16]. This can be seen
10
(A) then is concentrated by a converging lens (B) onto a spatial filter (C) results in light
beams of uniform intensity which travel through a collimating lens (D) through the area
of interest then into a de-collimating lens (F) where they are directed onto a filter or in
most cases a razor blade edge (G) and finally into a viewing plane or camera (H). If there
is no density change present in the area of interest the light travels path 1 and displays a
simple uniform light image in the viewing plane. When a different density field exists
within the area of interest (D) then the light which travels path 2 when no density field
exists will travel path 3. The light in path 3 is slightly deflected due to the different
refractive index which can be due to a local change in temperature, pressure. Since it is
deflected when it passes the second lens it is not focused onto the knife’s edge as path 2
is but is blocked by the knife and therefore it appears as a dark section on the viewing
plane. The knife edge is the key component of the Schlieren system and must be correctly
adjusted in order to obtain an image with a greyscale level proportional to the first spatial
derivative of the density variation in the area of interest [16]. The ideal position for the
knife edge is on the optical axis at a location where the diameter of the beam leaving the
de-collimating lens matches that of the spatial filter applied to the initial light source.
This will create an equal distribution of light intensity on the viewing plane allowing for
a crisp contrast to capture regions with low density gradients [15,17,18]. The result is an
image far superior to the shadowgraph as shown in Figure 7 where the plumes of a candle
can be clearly seen. Though visually appealing, the Schlieren photography method is only
a qualitative tool and must be used in conjunction with other methods to obtain
11
Figure 6 The Schlieren Method
Figure 7 Schlieren Images of the Plume of a Candle
2.2 Fundamental Steady Compressible Flow Concepts
When a supersonic flow encounters a certain condition of high downstream
pressure the pressure increase can occur through an abrupt change in the fluid properties
12
as a normal shock wave which is a wave form acting normal to the flow direction.
Standing or stationary shocks usually occur in one plane and can be found in nozzles and
ducts. These can be formed when a series of weak compression waves coalesce to form a
finite compression shockwave [18]. In addition to stationary shockwaves, shockwaves
can also be travelling or moving normal shocks, which can occur whenever there is a
rapid change in pressure of a certain magnitude due to an explosion, when an object
re-enters the Earth’s atmosphere or downstream of a rapidly opened high pressure gas valve.
A more detailed explanation of moving shocks is presented later in the shock tube
section. When a shockwave is inclined to the flow at an angle it is called an oblique
shockwave. A typical example is supersonic flow over a jet aircraft’s airfoil.
2.2.1 Steady Supersonic Jets
In a typical cold spray process flow travels through a de Laval nozzle which
accelerates the particles to high speeds. Before they impact the substrate, however, they
lose a portion of their thermal and kinetic energy [12]. Under certain conditions a normal
shock wave will occur in the diverging portion. The position of the standing shockwave
is determined by the back pressure, which is the pressure downstream of the nozzle exit.
As the back pressure is reduced below the upstream total pressure a point is reached
where the nozzle throat becomes choked and the mass flow rate remains constant.
Continuing to drop the back pressure leads to the flow becoming supersonic after the
throat and decelerated through a normal shock wave to subsonic. If the back pressure is
further reduced, this shockwave will be at a position further downstream of the nozzle
13
is low enough the shock wave will actually bend out of the exit nozzle causing supersonic
flow to leave the nozzle. Supersonic flow exiting a nozzle can either be underexpanded,
overexpanded or perfectly expanded depending on the relationship between exit pressure
and the outside back pressure [19].
When the back pressure is less than the exit pressure then an underexpanded jet
forms as shown in Figure 8. First the flow leaves the nozzle in Section 1 at a higher
pressure than the back pressure, resulting in the need for an expansion process to occur
with the flow directed away from the jet axis in Section 2 and the expansion fan
extending towards the centerline. Since the flow must be parallel to the jet axis at the
centerline a second, reflected, expansion process must occur to turn the flow back inward
so that it is parallel to the axis in Section 3. However the second expansion results in a
pressure in this section which is below the back pressure and therefore, the flow must be
compressed again to get back to the back pressure. These compression waves combine at
the jet axis to form oblique shocks just before Section 4 in which the flow is inward
toward the centerline. The oblique shock wave reflects from the jet axis and redirects the
flow along the jet centerline in Section 5. The flow in Section 5 is at a higher pressure
than the back pressure as was the case in Section 1 so the process restarts itself. This
process would continue to repeat forever if not for viscous and turbulent mixing loses
which eventually decay the flow [19]. Steady flow in a converging nozzle will result in a
decrease of pressure but if the back pressure is low enough the exit flow will be choked
and the back pressure could be less than the nozzle exit pressure thus requiring an
expansion process. Therefore it is only possible to produce an underexpanded jet with a
14
Figure 8 Underexpanded Supersonic Flow Exiting a Nozzle
A perfectly expanded jet can occur when the exit pressure actually matches the
outside back pressure which is why it is also called a matched jet flow. In this case no
compression or expansion processes occur as shown in Figure 9.
Figure 9 Perfectly Expanded Jet Exiting a Nozzle
For an overexpanded jet to form the back pressure must be greater than the exit
pressure of the nozzle. As one would expect the overexpanded process acts as the reverse
of the underexpanded process. In Figure 10 the flow leaves the nozzle in Section 1 at a
lower pressure than the outside pressure, therefore compression must take place to raise
the exiting pressure to the back pressure in Section 2 through the formation of oblique
15
hence a reflected oblique shock wave redirects the flow so that it is parallel to the jet axis
in Section 3. The pressure in this section is larger than the back pressure and must expand
to drop the pressure back down to the back pressure in Section 4. The reflection of the
expansion wave from the jet centerline causes the flow to again be lower than the back
pressure in Section 5 and the process repeats once again [19].
Figure 10 Overexpanded Supersonic Flow Exiting a Nozzle
Shock diamonds are a result of a series of compression waves that create regions
of high density and pressure [19]. They are seen in both underexpanded and
overexpanded supersonic flows and are evident in the flow exiting a rocket engine. A
Schlieren image of the shock diamonds can also be seen in more basic flows, such as
high pressure air leaving a straight nozzle shown in Figure 11. 2
3
16
Figure 11 Shock Diamonds in Supersonic Flow Exiting a Straight Nozzle
The easily discernible diamonds also have a unique pressure characteristic. At the
midpoint of a diamond where there is a top and bottom vertex, the pressure along the
centerline is lower than at the end of a diamond where those vertices come together into
one. Figures 12 and 13 show a shock diamond structure`s wavelength along its centerline
and the axial pressure ratio for a Mach Number of 1.166 and 2.24 respectively [20].
Clearly a higher Mach Number leads to a longer structure wavelength but also a greater
static pressure amplitude along the centerline. Therefore if the jet structure is continually
shifting Mach numbers as in an unsteady jet process, a point located on the jet centerline
would experience a high pressure region at one time but then a low pressure at another
17
Figure 12 Shock Diamond Structure`s Wavelength at M=1.166 Reproduced with Permission [20]
18
2.2.2 Steady Supersonic Jet Impacting Substrate (The Bow Shock Wave)
When a supersonic flow in a process such as the CGDS exits a nozzle and impacts the
substrate a stagnation zone or bubble forms. This is responsible for the formation of a
bow shock as seen in Figure 14. A bow shock forms when the gas particles impact the
surface of the substrate which creates a change in both momentum and energy. Newton
theorized that when a particle hits a surface it will lose all its momentum normal to the
surface but maintain its momentum parallel to the surface [5]. This rapid shift in energy
creates microscopic pressure waves which coalesce to form a normal shock near the
surface. The oncoming flow intercepts this shock and a radial deflection occurs. If the
substrate is positioned normal to the exit nozzle the deflection that occurs is above the
maximum deflection angle allowed by oblique shock waves. This creates a curved and
detached shockwave also known as a bow shock. This shock has a significant impact on
the oncoming flow as it is an unwanted barrier to the substrate that both slows and
deflects the particles creating lower deposition efficiency. In one experiment some
particle streams with lower velocity could not even penetrate the shock zone and were
deflected enough to not impact the surface. The main factor that determines the creation
19
Figure 14 Schematic of a Bow Shock Created by a Supersonic Flow Reproduced with Permission [21]
It is a fact that the bow shock is detrimental to the thermal spray process and
specifically the cold spray process where there is constant flow and particle injection
[23,24]. Researchers from the University of Cambridge experimented with Helium at 2
MPa and Nitrogen at 3 MPa to investigate the effects of stand off distance on particle
velocity, the formation of a bow shock and deposition efficiency [21]. They mapped out
three distinct regions and described their effects. First, at a small stand off distance the
impact velocity of the particles was decreased by the presence of a bow shock which in
turn decreased the deposition rate. The second region at around 60 mm was found to be
optimal due to the fact that no discernible bow shock formed and also that the distance to
the substrate allowed the particles to stay above the critical velocity threshold. Finally, in
20
particles decreasing their velocities before reaching the substrate. They concluded that
staying in region two increased deposition efficiency by up to 40 percent for that
particular nozzle regardless of what type of gas was used [21].
2.3 Traveling Shock Waves and the SISP
This section deals with the concept of the shock tube and how this relates to the
physics behind the SISP. It also includes a review of experimental studies of shock
induced flows.
2.3.1 The Shock Tube and Physics Behind the SISP
A shock tube, Figure 15, is a device that contains a high pressure gas at one end
called the driver section and a low pressure gas at the other end called the driven, section
which are separated by a diaphragm. When the diaphragm bursts this instantaneous
change in pressure creates a shockwave that travels downstream and coinciding
expansion fan that flows upstream. A contact surface can also be defined which is the
physical location or delimitation of the fluid that was on the high side and the fluid that
was in the low pressure side prior to diaphragm being burst.
Figure 15 A Diagram of a Shock Tube
High Pressure Side
p4, T4
Low Pressure Side
p, T1
Diaphragm
21
The SISP begins much like the shock tube in Figure 15 with Zone 4 being the
driver region and Zone 1 the driven region which is being separated by a valve which acts
like the diaphragm discussed above, Figure 16a [11]. Once the valve is opened, a series
of compression waves is generated, with subsequent waves having a higher pressure,
temperature and velocity than the previous, coalescing together as they propagate down
the barrel to form a shock wave, Figure 16b. At the same time, a series of expansion or
rarefaction waves move backwards into Zone 4 reducing the driver section’s pressure
until it would reach equilibrium with Zone 1 if the valve is not closed [25]. In Figure
16b, the incident front of the shock wave passes the particles and creates an increase in
the pressure and temperature in its wake, Zone 2, which propels the particles toward the
exit of the gun exit. [11]. A contact surface, Zone 3, would also exist when Zone 1 and 2
meet, and follow the higher pressure region created by the shockwave but at a slower
velocity [25]. This zone is what separated the accelerated gas from the now expanding
gas in the driver section. If this was a shock tube the shock wave would reflect off the
end boundary and intercept first the contact surface and then the reflected expansion fan
22
Figure 16 Diagram of the Physics of the SISP Reproduced with Permission [11]
A one-dimensional model of the process, based on shock wave analysis is
presented by Jodoin et al [11]. Given the initial pressures and temperatures before and
after the closed valve, the pressure in Zone 2 can be found by solving Equation 1
iteratively. The mass density ratio can then be found from Equation 2; the temperature
ratio from Equation 3 and the speed of the shock wave from Equation 4. This shows that
the temperature in Zone 2 will have a higher value as seen in Figure 17 [11]. This is the
region that propels the particles. The theory assumes that there will be little to no loss of
23
𝑝4
𝑝1 =
𝑝2
𝑝1
[
1 − (𝛾4− 1) (
𝑎1
𝑎4) (𝑝𝑝21− 1)
√(2𝛾1)√(2𝛾1+ (𝛾1+ 1) (𝑝𝑝2
1− 1))
] −[(𝛾2𝛾4
4−1)]
(1)
𝜌2
𝜌1 =
1 +𝛾 + 1𝛾 − 1 (𝑝2
𝑝1)
𝛾 + 1
𝛾 − 1 +𝑝𝑝21
(2)
𝑇2
𝑇1 =
𝑝2
𝑝1(
𝛾 + 1
𝛾 − 1 +𝑝𝑝12
1 +𝛾 + 1𝛾 − 1 (𝑝2
𝑝1)
) (3)
𝑉𝑠 = 𝑐1√
𝛾 + 1
2𝛾 (
𝑝2
𝑝1− 1) + 1 (4)
24
An initial numerical study of the SISP was completed by Karimi et al., [28], using
the two dimensional computational fluid dynamic model of an actual geometrical
representation of the Waverider thermal spray gun. The results showed that an increase in
supply pressure and thus the pressure ratio across the diaphragm, would increase the
shock speed as well as the duration of the supersonic flow. Another important element of
information discovered was that varying the time in the cycle when particles are injected
into the flow has a significant impact on the overall deposition rate onto the substrate
based on the particle critical velocity ratio. Other factors that affected the deposition rate
are the firing frequency of the valve and the formation of a bow shock. Little information
regarding the formation of a bow shock wave in a periodic flow field led to the present
experimental study [28].
2.3.2 Experimental Research Involving Shock Induced Flow
There has been minimal research done in the area of pulsating supersonic flow
visualization however there is significant research available regarding shock tubes. It is
therefore, instructive to make a comparison between one cycle of the pulsating flow with
the characteristics seen in a shock tube. Usually these studies are conducted in a circular
tube but the flow in this experiment’s rectangular cross section is expected to
demonstrate many of the same features.
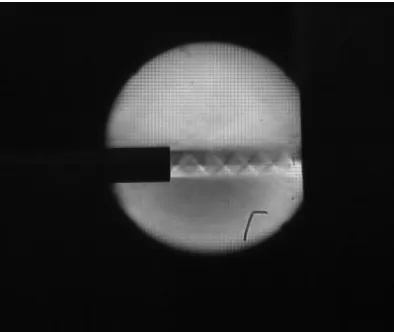
In 1952 Elder and Hass [29] used a Schlieren technique to investigate supersonic
flow exiting a nozzle in order to capture the vortex rings created at the shock tube exit as
25
boundary layer in the tube which decreases the velocity of the flow [30]. This interaction
causes eddies that separate at the nozzle edge to create the vortex rings [31]. Elder and
Hass used an electronic delay circuit synchronized with a camera and spark source and
were able to capture the initial shock wave leaving the tube as well as the vortex ring that
followed but only through repeating the experiment at different time delays to compile a
sequence of images.
Figure 18 Elder and Hass’ Shockwave and Vortex Rings Reproduced with Permission [29]
As imaging technology has progressed, the ability to capture at extremely high
frame rates has enabled us to view and analyze super high speed objects and their
interactions with the environment such as a bullet leaving the muzzle of a gun [32].
26
the different aspects of a shock wave leaving a nozzle. Ishii described the initial shock
wave as the first shock, and then observed a secondary shock and Mach disk that
developed into vortices, Figure 19 [33]. This secondary shock was the leading front of the
supersonic flow noted by the shock diamonds described earlier. Other researchers also
found the flow exiting a nozzle in three distinct stages; initial shock, vortex rings and
supersonic flow [34,35,36,37].
Figure 19 Ishii’s Initial Shock, Secondary Shock and Mach Disk Reproduced with Permission [33]
A pulsating flow can also be found in the exhaust pipe of any type of
reciprocating engine. As the exhaust valve of the engine opens and closes it acts much
like a shock tube diaphragm with the high pressure gases in the cylinder being released
into the exhaust pipe. Both Endo [38] and Kimura [39] investigated the flow generated by
27
the noise generated by the shock waves, their experimental set up was similar to the one
used in this study. They also found the three main stages of high pressure discharge from
a nozzle and noted a shock wave forming in front of the vortex ring much like Ishii’s
secondary shock, Figure 20. Endo observed that their rotary valve must run around 2000
rpm or 33 Hertz to produce a shock wave.
Figure 20 Endo’s Schlieren with Initial Shockwave and Vortices Reproduced with Permission [38]
2.4 Objectives
The main objective of this thesis is to experimentally investigate the fluid mechanic flow
field at the exit of the nozzle associated with the new Shock Induced Spray Process. The
information will be an aid in future designs of Centerline’s Waverider SISP Thermal
Spray Gun. The work is conducted experimentally within the Jet/Vortex Lab at the
University of Windsor’s Centre for Engineering Innovation. The specific objectives are
28
1. Construct an experimental Waverider apparatus with dimensions similar to those
of the actual Waverider manufactured by Centerline Ltd.
2. Construct a working Schlieren apparatus suitable for use with the Waverider
facility.
3. Use high-speed photography to capture Schlieren images of the transient
compressible flow features produced by this device between the nozzle exit and
the substrate and simultaneously collect quantitative data through the use of
pressure transducers mounted at strategic locations.
4. Analyze the Schlieren images to draw conclusions regarding the flow as well as
map all characteristics for one complete Waverider cycle.
5. Correlate qualitative and quantitative data to discover the effects of initial supply
pressure, rotary valve frequency and substrate stand off distance on the substrate
central pressure and the flow field in the region between the nozzle exit and the
29
Chapter 3 Experimental Facility and Procedure
This chapter begins with an overall description of the experimental flow facility
then separately considers the details of each component. The experimental procedure that
was followed and the values of the variables considered are then given.
3.1 Experimental Flow Facility
A schematic diagram of the entire experiment facility is presented in Figure 21.
Flow initiates from the high pressure (31 MPa), nitrogen tank and passes through a
regulator (A) lowering the pressure to the required value. The gas then travels through a
hydraulic hose into the Centerline Custom Rotary Motor/Valve assembly (B), the
frequency of which is controlled by a proprietary controller box. A PCB Piezotronic
113b24 pressure transducer is located at the exit of the rotary valve to provide a pressure
trace from which the frequency can be determined. The gas is then released in pulses
creating shock waves that travel into the heater coil which is replaced, in this experiment,
by a tube of equal dimensions. After exiting the heater coil, the flow enters the SISP
thermal spray apparatus through an inlet section (C) which provides a transition from a
circular cross-section which expands into the nozzle. At this point powder would be
introduced into the flow however in this experiment it will not be included. The flow then
exits the diverging nozzle, (D), passing into the atmosphere, crossing the gap and
impacting onto the substrate. The Schileren Apparatus is adjustable to view along the
entire SISP Apparatus from inlet to exit. The SISP Apparatus is also able to be positioned
at different distances from the substrate to evaluate the affect of the Stand off Distance on
30
Figure 21 Experimental Set Up
3.2 Centerline Custom Rotary Motor/Valve Assembly
The most important component in the experimental equipment is the custom
designed and built rotary valve from Windsor Centerline shown in Figure 22. The three
slotted disc as seen in Figure 22b allows the incoming high pressure gas to be
systematically blocked and released to the atmospheric pressure within the exit tube
which is connected to the thermal spray apparatus. The rotation of the slot disk depends
on the frequency dictated by the electric motor controller thus controlling the effective
![Figure 1 Schematic of the Flame Spray Process Reproduced with Permission [4]](https://thumb-us.123doks.com/thumbv2/123dok_us/1399511.1172640/32.612.112.583.472.687/figure-schematic-flame-spray-process-reproduced-permission.webp)

![Figure 18 Elder and Hass’ Shockwave and Vortex Rings Reproduced with Permission [29]](https://thumb-us.123doks.com/thumbv2/123dok_us/1399511.1172640/55.612.180.505.247.505/figure-elder-hass-shockwave-vortex-rings-reproduced-permission.webp)