Solid Propellant Motor Design: Comparison of
Theoretical and Experimental Data
Henry Gunsalam1
School of Aerospace Engineering, Universiti Sains Malaysia, Engineering Campus, 14300 Nibong Tebal, Pulau Pinang, Malaysia
Illyia Mohd Yusof2
School of Aerospace Engineering, Universiti Sains Malaysia, Engineering Campus, 14300 Nibong Tebal, Pulau Pinang, Malaysia
1 Postgraduate Student, M.Sc. by Research ‘Preliminary Design of Short Range Ballistic Rocket with Prescribed Trajectory’ 2 Main Supervisor and Dean, Lecturer Specialization in Satellite and Launcher Design
Abstract: The objective of this paper is to compare the results of a solid rocket motor’s performance between theoretical calculations with empirical data collected from a static thrust bench in Propellant Laboratory, School of Aerospace Engineering, University Science of Malaysia. In this experiment, a simple and cheap solid propellant is manufactured, which consists of chemical compounds of potassium nitrate (KNO3), sulfur (S) and sugar (C12H22O11).
Lesson learnt from this experiment will allow further research on the rocket’s flight trajectory prediction model being formulated for the completion of the dissertation.
Keywords: Internal Ballistic, Solid Rocket Motor,
Solid Propellant, Static Thrust test, Thrust and Pressure Profile
Nomenclature
p
m
=Propellant massI =Impulse
sp
I
=Specific Impulseg
=Gravitational accelerationp
V=Propellant Volume
p
ρ
=Propellant DensityR
=RadiusD
=Diameter cL=Motor Case length
W
=Grain web thicknessb
t
=Burn timer
=Regression rateF
=Thrust m=Mass flow ratet
A
=Throat AreaX
=Throat design permutation coefficient (0.95-1.10)*
c
=Characteristic Veloctiyc
P
=Chamber Pressureε
=Nozzle Area Expansion Ratiob
A
=
Burn areaport
A =Port area
N
=Number of grain segmentso
η
=Isp efficiencySubscripts: o=Initial
i=Value at time increment i
port=Grain port variable p=Propellant
e=Exit c=Motor case avg=Average
1. Introduction
This paper presents a work in progress to study the flight performance of a ballistic rocket for optimization of range. Detail study on solid rocket propellant motor design had done by theoretical and experimental method. In this experiment, a simple and cheap solid propellant is manufactured, which consists of chemical compounds of potassium nitrate (KNO3), sulfur (S) and sugar C12H22O11).
solid rocket was to carry the ballistic rocket and payload to an altitude at range 100 to 200 m. To meet this requirement, the solid propellant rocket motor to be developed. The process included designing, analysis and construction of the motor. In designing the motor, a propellant formulation was used from various source and initially verified to find the best compounds. This formulation was then used to determine the interior ballistic properties and grain geometry that allow the motor complete the mission. Then, all component of the motor including case, nozzle and the actual propellant segments had to fabricate.
After the formulation of the propellants was complete, small batches of propellant were made and test fired to ensure the propellant properly mixed and cast. After that, full size motor segments were cast to verify the nozzle design. A complete motor was fabricated to be used in static test firings. An empirical data from this static test is collected to be analyzed and compared to the theoretical calculation.
2. Solid Rocket Motor Modeling
This section focused on determining the grain geometry of the propellant, sizing the solid rocket motor and also modeling the pressure and thrust profiles. The mathematical models that had been derived from the propellant
configuration will be compared to the test data.
2.1 Internal Ballistic
2.1.1 Propellant characteristic
In this project, a simple and cheap propellant was cast: potassium nitrate (KNO3), sulfur (S) and sugar (C12H22O11).The mixture of the compound 75% KNO3, 10% S and 15% (C12H22O11) is selected based on initial experimental result. The compound properties shown in the table 2.1 collected from PEP code.
Specific Impulse 135.2 s
Design Chamber Pressure 3457 kN/m2
Actual density 1122 kg/m3
Ideal density 2016 kg/m3
Expansion Ratio 6.30:1
Characteristic velocity 863.43 m/s Table 2.1 Properties of 75% KNO3, 10% S and
15% (C12H22O11). (Extracted from
PEP code)
2.1.2 Solid rocket motor initial design and preliminary calculation
The first step is to determine the propellant mass, volume and port geometry:
p sp
I
m
I g
=
(2.1)p p p
m
V
ρ
=
(2.2)For cylindrical grain geometry:
2 p
port c
V
R
R
L
π
=
−
(2.3)The web distance:
c port
W
=
R
−
R
(2.4)The burn rates:
b
W
t
r
=
(2.5)And the average thrust:
avg b
I
F
t
=
(2.6)The second step is to determine the throat area and exit area of the nozzle:
p avg b
m
m
t
=
(2.7)avg t c
m
c
A
X
P
∗
⎛
⎞
= ⎜
⎟
⎝
⎠
(2.8)e t
A
=
ε
A
(2.9)The next step is to model the mass, thrust and pressure in this design. Therefore to estimate the initial number of segments for given area: avg bo p
m
A
r
ρ
=
(2.10)To analyze the thrust, pressure and mass profile, the burn duration is taken as a reference ∆t. At time ti, web distance burned is:
1
i i i i
W
rt
W
−∆ =
+ ∆
(2.11)And the burn Area is;
(
)
(
2(
)
2)
2 2 2
bi port i i c port i
L
A N R W W N R R W
N
π ⎛ ⎞ π
= + ∆ ⎜ − ∆ ⎟+ − − ∆
⎝ ⎠
…. (2.12)
The mass flow rate at any instance ti is:
i p i bi
m
=
ρ
r A
(2.13)Chamber pressure at ti:
* i ci t
m c
P
A
Thrust
(
)
i i sp ei atm e
F
=
m I g
+
P
−
P
A
(2.15)Where Pe at ti determined from;
1
1
2 12
ei ci e
P
P
M
γ γ
γ
−
−⎛
⎞
=
⎜
+
⎟
⎝
⎠
(2.16)And motor mass;
1
i i i
m
+=
m
− ∆
m t
(2.19)The preliminary motor design for static test shown in the table 2.2
Solid rocket Motor Dimension
Port radius, Pr = 0.0029 m
Port Area = 0.000026 m^2
Length per slot, L/N = 0.0400 Nozzle: Throat rad, Rt = 0.0047 m Nozzle: Exit rad, Re = 0.0117 m
Nozzle: Exit Area = 0.00043 m^2
Target Chamber Pressure = 344750 N/m^2 Propellant Density, rho = 1122 kg/m^3 Characteristic velocity = 863.4374 m/s Propellant mass = 0.15 kg
Web distance = 0.015 m
Gamma = 1.1065
Epsilon = 6.30
Table 2.2 Motor dimensions and
characteristic from preliminary design modeling
Figure 2.1 Nozzle Schematic
3. Static Thrust Testing
This section addresses the static thrust testing includes planning, fabrication and development of the solid rocket motor based on previous section. The final test data recorded from static thrust bench apparatus to be analyzed.
3.1 Test plan
Several stages of development were accomplished before the actual motor was fabricated. The first is to gain experienced in handling and mixing the materials used in this solid propellant. Once the tasks were completed, small segment of the solid propellant is tested to validate the mixture of the propellant. After that, static firing of the motor was performed to verify the predicted performance.
3.2 Propellant Segment and Solid Rocket Motor Fabrication
As mentioned before, a simple and cheap propellant composition selected, that is of potassium nitrate (KNO3), sulfur (S) and sugar (C12H22O11).The castings of the propellant were in simple plate. It is necessary to gain experience in mixing and casting this propellant. The compounds had been tested ranging from 60% to 80% potassium nitrate (KNO3)and from 10% to 40% sugar with or without sulfur. And the based on the result from each compounds, 75% KNO3, 10% S and 15% (C12H22O11) were selected. After the mixing and casting process was completed, the propellant segments were ready to be loaded into the motor.
Then the next step is to fabricate the rocket motor and the nozzle. The nozzle was made out and machined from aluminum alloy. A picture of the nozzle is shown in figure 3.1.
Figure 3.1 Nozzle
Once the motor was fabricated and assembled, it was ready to be installed to the static test bench. Figure 3.2 show a fully assembled motor.
3.3 Instrumentation and data Acquisition
The static test bench apparatus used shown in figure 3.3. The motor was mounted on the test stand in a horizontal configuration as shown in figure 3.4.
Figure 3.3 Static Thrust Test Bench
Figure 3.4 Rocket Motor on static test
3.4 Test Data
The static test on the solid rocket motor was conducted at Propulsion Lab, School of Aerospace Engineering, University Science of Malaysia. Figure 3.5 shows the thrust profile measured during static test.
Thrust (N) vs Time (S)
0 5 10 15 20 25 30 35
0 1 2 3 4 5 6 7
Time (second) Thrust (Newton)
Figure 3.5 Experimental Thrust Profile
4. Performance Analysis: Theoretical
and Empirical data
The thrust profile measured from static test will be compared and matched to the predicted profile. The other data, pressure profile, motor mass during burn and burn area derived and modified based on experimental thrust data before compared to the predicted data.
4.1 Theoretical versus Experimental data
Theoretical Thrust Profile
0.00 5.00 10.00 15.00 20.00 25.00
0 1 2 3 4 5 6 7
Time,t sec Thrust, N
Thrust (N) Time (S)
0 5 10 15 20 25 30 35
0 1 2 3 4 5 6 7
Tim e (second) Thrust
(New ton)
Figure 4.1 Theoretical and Experimental Thrust Profile
Theoretical Chamber Pressure
0 10 20 30 40 50 60 70 80 90 100
0 1 2 3 4 5 6 7
Time, t sec
C
h
am
b
e
r P
re
ssu
re,
b
a
r
Modified Chamber Pressure
0 25 50 75 100 125 150
0 1 2 3 4 5 6 7
Time (second) Pressure
(Bar)
Figure 4.2 Theoretical and Modified Chamber
Predicted M otor Burn Area
0 0.05 0.1 0.15 0.2 0.25 0.3
0 1 2 3 4 5 6 7
Time, t sec
B
u
rn
A
rea,
cm
^
2
Modified Burn Area
0.00 0.05 0.10 0.15 0.20 0.25 0.30
0 1 2 3 4 5 6 7
Time (second) Burn Area
(cm^2)
Figure 4.3 Theoretical and Modified motor burn area
Propellant Mass vs Time
0 0.02 0.04 0.06 0.08 0.1 0.12 0.14 0.16
0 2 4 6 8Time,t sec mass, kg
M odified Prope llant M ass
0.00 0.05 0.10 0.15 0.20
0 1 2 3 4 5 6 7
Tim e (second) Propellant
mass (kg)
Figure 4.4 Theoretical and Modified propellant mass motor
From the figure 4.1, the experimental thrust profile is completely different from the
theoretical thrust profile. The burn time duration for experimental, 5.56 sec is 15% faster than measured from calculation that is 6.5 sec. For experimental and modified graph, trend line had been added to ease the analyzing and
comparison.
For modified chamber pressure profile, figure 4.2, shows the chamber pressure is higher than the predicted data. The differentiation is nearly 20% average along the curve.
For modified and calculated motor burn area and mass of propellant profile, figure 4.3 and figure 4.4 shows there are compromise between the theoretical and modified profile. Table 4.1 shows the comparison summary of experimental and theoretical calculation of the thrust profile;
Figure 4.1 Theoretical and Experimental Thrust Profile
5. Conclusion.
The data collected were analyzed and matched to the thrust predicted in the model. It is clear the thrust profile was different from the one predicted. The two main assumptions that was invalid for test;
i) Constant burn rate ii) Constant throat area
Without pressure data and the St. Robert coefficient and exponent for burn rate correlation, it was difficult to predict the precise burn rate during test. However by examining the experimental thrust profile a burn rate could be postulated to decrease approximately linearly during the course of the test.
The other important information that can be obtained from the thrust test is the specific impulse efficiency. The Isp efficiency of the motor can be derived from the thrust by;
0
0 b
b
t
o t
sp
Fdt
I g
mdt
η
=
∫
∫
(5.1)Theoretical Experimental %
Burn time 6.5 s 5.56 s -17
Maximum Thrust 23 N 32 N 28
Thrust Average 11.15 N 15 N 26
Total Impulse 72.5 N.s 83.4 Ns 13
Thrust steady state duration
3 s 2.2 s 36
Pressure steady state duration
3 s 2.8 s 7
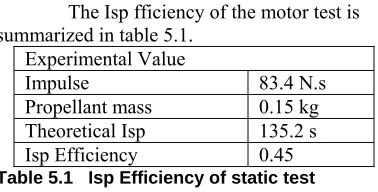
The Isp fficiency of the motor test is summarized in table 5.1.
Experimental Value
Impulse 83.4 N.s
Propellant mass 0.15 kg
Theoretical Isp 135.2 s
Isp Efficiency 0.45
Table 5.1 Isp Efficiency of static test
Even if there are differentiation between the theoretical calculation and empirical data, useful data have been collected to improve the next rocket motor design for flight testing to predict the ballistic rocket trajectory.
6. Reference
[1] Humble, Ronald W., Henry, Gary N., Larson, Wiley J. 1995. Space Propulsion Analysis and Design. New York, NY: McGraw-Hill
Companies.
[2] Mark Davies, Editor-in Chief (2003) ‘The Standard Handbook for Aeronautical and Astronautical Engineers’, First Edition, The McGraw-Hill Companies, Inc. United States of America.
[3] George P. Sutton and Oscar Biblarz (2001)’ Rocket propulsion element’, seventh edition, John Willey and Sons Inc. Canada
[4] G. Harry Stine (1994) ‘ Handbook of model Rocketry’, sixth edition, John Willey and Sons Inc.USA.
[5]URL: A brief history of rocketry. Available at: http://science.ksc.nasa.gov/history/rocket-history.txt 27 June 1998
[6[ URL: ‘Introduction to BMD: Does Ballistic Missile Defense makes sense for Japan?’,The Okazaki Institute The Ballistic Missile Defense Research Group. Hideaki Kaneda (Nov 2000) Available at:
http://www.glocomnet.or.jp/okazaki-inst/ebmd/etmdintro.intro.html
[7] URL:‘Forces on a Model Rocket’.Glenn Research Center, NASA. Available at;
www.rockets4schools.org/education/Rocket_For ces.pdf
[8] URL: Gene Fleeman, ‘Maximizing Missile Flight Performance’ Senior Technical Advisor Georgia Institute of Technology. Avaliable at :
www.dbf.gatech.edu/performance.ppt [9] URL: Richard Nakka's Experimental Rocketry Web Site. Available at: