OPEN ACCESS
Exploring the Potential of High Resolution Remote
Sensing Data for Mapping Vegetation and the Age
Groups of Oil Palm Plantation
To cite this article: N Kamiran and M L R Sarker 2014 IOP Conf. Ser.: Earth Environ. Sci. 18 012181
View the article online for updates and enhancements.
Related content
Age-surface temperature estimation model: When will oil palm plantation reach the same surface temperature as natural forest?
S B Rushayati, R Hermawan and R Meilani
-The characteristics of palm oil plantation solid biomass wastes as raw material for bio oil
RN Yanti, E Hambali, G Pari et al.
-A Survey on the Usage of Biomass Wastes from Palm Oil Mills on Sustainable Development of Oil Palm Plantations in Sarawak
K Y Phang and S W Lau
Exploring the Potential of High Resolution Remote Sensing
Data for Mapping Vegetation and the Age Groups of Oil
Palm Plantation
N Kamiran1and M L R Sarker1, 2,1
1Department of Geoinformation, Universiti Teknologi Malaysia, Malaysia 2Department of Geography and Environmental Studies, University of Rajshahi,
Bangladesh
Email: [email protected]
Abstract. The land use/land cover transformation in Malaysia is enormous due to palm oil plantation which has provided huge economical benefits but also created a huge concern for carbon emission and biodiversity. Accurate information about oil palm plantation and the age of plantation is important for a sustainable production, estimation of carbon storage capacity, biodiversity and the climate model. However, the problem is that this information cannot be extracted easily due to the spectral signature for forest and age group of palm oil plantations is similar. Therefore, a noble approach "multi-scale and multi-texture algorithms" was used for mapping vegetation and different age groups of palm oil plantation using a high resolution panchromatic image (WorldView-1) considering the fact that pan imagery has a potential for more detailed and accurate mapping with an effective image processing technique. Seven texture algorithms of second-order Grey Level Co-occurrence Matrix (GLCM) with different scales (from 3x3 to 39x39) were used for texture generation. All texture parameters were classified step by step using a robust classifier "Artificial Neural Network (ANN)".Results indicate that single spectral band was unable to provide good result (overall accuracy=34.92%), while higher overall classification accuracies (73.48%, 84.76% and 93.18%) were obtained when textural information from multi-scale and multi-texture approach were used in the classification algorithm.
1.0 Introduction
The land use/land cover transformation due to the palm oil plantation has a significant importance inthe Malaysianeconomy. The accurate information about oil palm plantation and the age of plantation is important for the sustainable productivity as well as for the assessment of the environmental effect of the oil palm plantation [1,2]. Age map can help to assess the health status of the palm oil plantationsas well as for the development of the yield forecasting models [3]. Previous investigation found that palm oil production increases with the increase of age up to year seven/eight and then decreases. However, the age of the palm oil plantation is also very important for the estimation of carbon storage capacity of the oil palm plantation because age can be converted into biomass content using existing allometric model for the palm oil plantation [3,4]. The information of the age of the palm oil plantation can be obtained from the field investigations [4]. The field
1To whom any correspondence should be addressed
IOP Conf. Series: Earth and Environmental Science18(2014) 012181 doi:10.1088/1755-1315/18/1/012181
investigations are very accurate but time consuming and cannot be carried out over a large area very frequently because of the cost and time. Researcher [1] found that usually every palm oil estates have maps of age but unfortunately this spatial information is not easily accessible for the purposes of environmental impact assessment or large-area yield forecasting.
However, instead of field investigation, remote sensing techniques have been used potentially toestimate the age of oil palm plantationvery cost effectively although the accuracy for the estimation varied based on the image processing techniques and the data used for the investigation [5]. The advantage of the investigation for the oil palm is that oil palm tree is systematically planted, as a result the plantation stand is less complex than natural forest stand [1] but the determination of the age is still a very challenging task especially when using remote sensing techniques due to the almost similar spectral signature for forest and different age groups of palm oil plantation.Many studies [4,6,7] have been carried out for the determination of the age of vegetation using different satellite data and image processing techniques and obtained varied level of success. In this study, a high resolution panchromatic image is intended to use for the classification of vegetation, age of oil palm plantation, and other land features because it has an ability to give more detailed and accurate information [8]. But the problem is that panchromatic imagery has a drawback to classify and differentiate ground features with higher complexities probably due to high interclass spectral confusion as well as the absence of multispectral information [8,9]. However, studies [5,6,9,10] found that accurate discrimination between land use/cover classes depends not only on spectral information but also on spatial (textural) information of the high resolution image. Therefore, considering the potential of the high resolution panchromatic data and the necessity of spatial information (texture), this study has an objective to classify vegetation, the age group of oil palm plantation and other land features using a multi-scale and multi-texture approach of WorldView-1data taking the advantages of complementary information from different texture algorithms as well as better averaging from the multi-scale kernel sizes in order to minimize the confusion between different land feature classes.
2.0 Study Area and Data
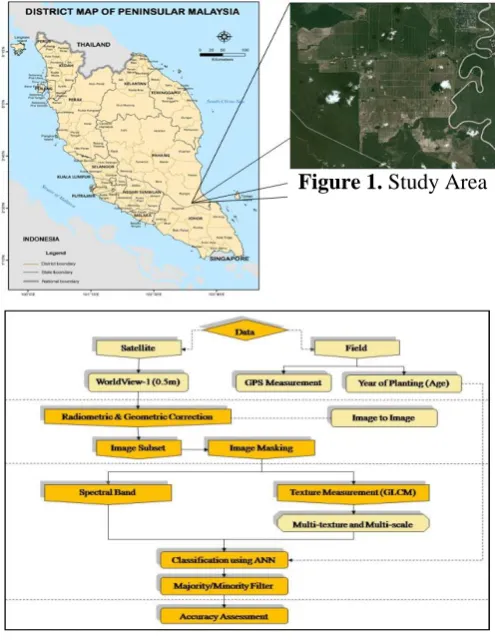
The study area for this research (Figure 1) is located at Tanjung Gemok, Kuala Rompin, Pahang with the center position at 2º49’00’’ N and 103º29’00’’ E. The whole area of oil palm plantations is 27. 341 ha. A high resolution panchromatic (0.5m) WorldView-1 satellite data (11 June 2012) covering the whole study area was used for this study.
3.0 Methodology
The overall methodology (Figure 2) of this research is comprised of several image pre-processing and pre-processing steps which include i) radiometric correction, ii) geometric correction, iii) cloud masking, iv) texture processing, image classification and accuracy assessment.
4.0 Results
The results of this study are presented in four sections based on the classification results obtained from the four image processing steps i.e. i) original imagery, ii) single texture and multi-scale technique, iii) single scale and multi-texture technique, and iv) multi-scale and multi-texture technique.
Figure 1. Study Area
Figure 2. Overall Methodology
IOP Conf. Series: Earth and Environmental Science18(2014) 012181 doi:10.1088/1755-1315/18/1/012181
4.1 Classification result using original imagery
In general, the overall accuracy (OA) for different feature classes using the original imagerywas very low (Table 1) except for the water (OA=69.03%) and clear cut/brushes (OA=77.24%). The classification algorithm "ANN" was unable to classify oil palm (7 years) because of the almost similar spectral signature of forest and 7 years old oil palm. However, 4 years old oil palm was classified but the accuracy was still quite low (OA=32.95%).
4.2 Classification results using single texture and multi-scale approach
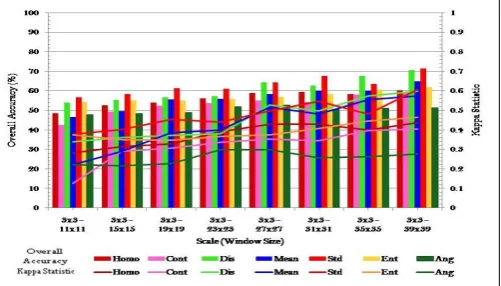
A comparatively better classification accuracy (OA=73.48%) was obtained using the single texture and multi-scale approach compared to the classification result obtained from the original imagery (OA=34.92%).It is noticeable from the results (Figure 3) that the classification accuracy improved significantly using all texture algorithms, however, the best performance was observed using "standard deviation" and “dissimilarity"
texture algorithms for all scale combinations. Among the scale combinations, it is obvious that the accuracy (Figure 3) was improved with the increase of the number of window sizes, and the highest accuracy (OA=73.48%) was obtained using the combination of texture images from 3x3– 39x39 scales. On the other hand, the lowest accuracy (OA=42.44% and kappa= 0.13) was obtained when images from contrast texture algorithm with 3x3 – 11x11 scale combinations were used in the classification algorithm.
4.3 Classification results using single scale and multi-texture approach
In this study, seven texture algorithms were used individually, however, in this part of the image processing, all seven texture algorithms were grouped into four texture combinations (i.e. four, five, six and seven texture combinations) (Table 2)after trial and error process in order to examine the potential of multi-texture for the improvement of classification accuracy.
Table 2. Multi-texture algorithm combinations
No. of Textures Texture Combinations
4 Mean, Standard Deviation, Homogeneity, and Dissimilarity
5 Mean, Standard Deviation, Homogeneity, Dissimilarity, and Entropy
6 Mean, Standard Deviation, Homogeneity, Dissimilarity, Entropy and Contrast 7 Mean, Standard Deviation, Homogeneity, Dissimilarity, Entropy, Contrast and
Angular Second Momentum
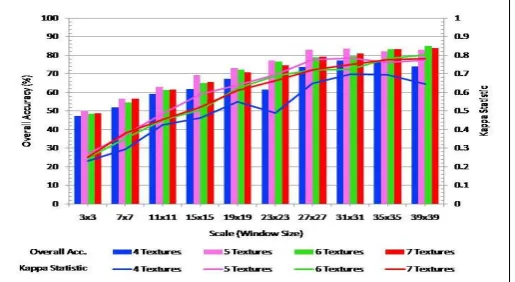
The classification results (Figure 4) showed a significant improvement of accuracy using the single-scale and multi-texture approach. The highest overall accuracy obtained was 84.76% (kappa=0.80), and this result was better than the previous two approaches i.e. i) original imagery and
Table 1. Confusion matrix for classification using original imagery
Figure 3. Classification results using single texture and multi-scale approach
ii) single texture and multi-scale, which achieved an overall accuracy of 34.92% and 73.48% respectively.
The performances of the different texture combinations varied based on the number of the texture algorithms but in almost all cases five textures combination showed better performance than other texture groups although slightly better performance was observed from the six textures combination using particularly 35x35 and 39x39 scale sizes. However, it was also noticeable that the accuracy (Figure 4) of the classification was increased with increase of the window size, and the highest accuracy (OA=84.76%) was obtained from the 39x39 window.
4.4 Classification results using multi-scale and multi-texture approach
In this part of the image processing, multi-scale and multi-texture approach was used considering the findings from the previous studies [5,11,12] that multi-scale and multi-texture approach is capable to improve classification result.However, for this multi-scale and multi-texture approach, texture images of only larger window sizes (from 25x25 to 39x39) were used in the classification algorithms considering the facts that larger size of moving window could provide better performance [13] especially when using panchromatic high resolution imagery [6].
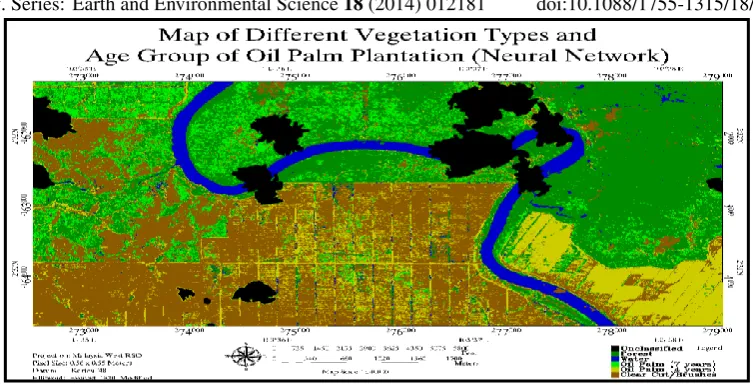
It is clear from the results that the accuracy (OA = 93.18% and kappa = 0.92) of the classification was improved using the multi-scale and multi-texture approach (Figure 5) compared to the highest accuracy obtained from the single texture multi-scale (Figure 4) (OA = 73.48% and kappa = 0.64) and single scale multi-texture (Figure 3) (OA = 84.76% and kappa = 0.80). In this approach, the best accuracy was obtained when data from the combination of 6 texture algorithms with the window sizes of 25x25 – 39x39 were used in the classification algorithm.
Among the classification results, the best result (Figure 6 and Table 3), indicated that most of the features were classified successfully using the scale and multi-texture approach as a result, a validation accuracy of more than 93% was obtained. Several features such as forest (94.53%), water (100%), oil palm 7 years old (92.42%), oil palm 4 years (95.39%) and clear cut/brushes (94.42%) were successfully classified although misclassification between oil palm 7 years old and forests were still observed due to the low severability between these two classes.
Figure 4. Classification results using single scale and multi-texture approach
Figure 5.Classification results using multi-scale and multi-texture approach
Table 3. Confusion matrix for the best results using multi-scale and multi-texture approach
IOP Conf. Series: Earth and Environmental Science18(2014) 012181 doi:10.1088/1755-1315/18/1/012181
5.0 Discussions and Conclusions
In this research, four steps of image processing techniques were used to classify forest, oil palm age groups and other features using high resolution panchromatic data. Results indicated that high resolution pan image have a potential to classify different features very accurately but original panchromatic band was unable to provide satisfactory result (OA=34.92%) probably because of the missing of multispectral information [8] and high interclass spectral confusion [9].
Texture information from the high resolution pan images show very potential and a significant improvement of classification accuracy was found using all three steps of image processing techniques i.e. i)single texture multi-scaleapproach(OA = 73.48%), ii) single-scale and multi-texture approach (OA= 84.76%), and iii) multi-scale and multi-texture approach (OA= 93.18). The improvement of classification accuracy using the texture processing in agreement with previous studies [9,14] who stated that only spectral information for classification could not promise to give accurate interpretations because of the discrimination between land use/cover classes depends not only on spectral information but also on spatial (textural) information of the image data.
In case of texture processing, it is observed that the improvement of the classification accuracy varied based on scales (window sizes) and texture combinations. It was found that the accuracy of classification increases with the increase of the window size and this finding is in agreement with the previous studies [6] who found that larger texture window size can increase the classification accuracy of land use/land cover especially for the high resolution satellite imagery.However, the accuracy of the classification was also improved when multi-texture algorithms were used in the classification probably due to complementary textural information of multi-texture algorithms that help in discriminating between different features [13]. Finally, multi-scale and multi-texture approach superseded the performance of all processing which is in agreement with previous studies [5,10,13] who observed that multi-scale multi-texture measurements has a potential to improve the accuracy of the land use/land cover as well as forest classification due to complementary information as well and better averaging.
Acknowledgement
This work was supported by the Grant University Project (vot: QJ130000.2527.03H71) managed by Universiti Teknologi Malaysia (UTM) under the Ministry of Higher Education (MOHE).
References
[1] McMorrow J 2001 International Journal of Remote Sensing22 2243-64 [2] Basiron Y 2007 European Journal Lipid. Science Technology 289-95
[3] Foong S F 1982 Proc. International Conference on Oil Palm in Agriculture in the Eighties: Session-Prediction Prospect and Forecast 17-20 Jun (Kuala Lumpur: Malaysia) 327-49 [4] Chemura A 2012 Determining oil palm age from high resolution satellite imagery University of
Twente 1-34
Figure 6. The best result obtained from multi-scale and multi-texture approach
[5] Rakwatin P, Longepe N, Isoguchi O, Shimada M 2012 International Journal of Remote Sensing 7727–46
[6] Franklin S E, Wulder M A, Gerylo G R 2001 International Journal of Remote Sensing 22 2627−32
[7] Champion I, Dubois-Fernandez P, Guyon D, & Cottre M 2008 International Journal of Remote Sensing29 1795−1800
[8] Pacifici F, Chini M and Emery W J 2009 Remote Sensing of Environment113 1276–92 [9] Gong P, Marceau D J and Howarth P J 1992 Remote Sensing of Environment40 137–51. [10] Podest E and Saatchi S 2002 International Journal of Remote Sensing23 1487−506
[11] Zhang C, Franklin S E and Wulder M A 2004 International Journal of Remote Sensing25 859– 65
[12] Marceau D J, Howarth P J, Dubois J M and Gratton D J 1990 Geoscience and Remote Sensing 28 513−17
[13] Coburn C A and Roberts A C B 2004 International Journal of Remote Sensing 4287 – 308 [14] Lillesand T, Kiefer R and Chipman J 2004 Remote Sensing and Image Interpretation (5th ed.)
763
IOP Conf. Series: Earth and Environmental Science18(2014) 012181 doi:10.1088/1755-1315/18/1/012181