ABSTRACT
BEEMAN, JENNIFER LEIGH SLOAN. Assessing Understanding of Sampling Distributions and Differences in Learning Amongst Different Learning Styles. (Under the direction of Dr. Roger Woodard and Dr. David Dickey.)
Research has found that students successfully complete an introductory course in
statistics without fully comprehending the underlying theory or being able to exhibit
statistical reasoning. This is particularly true for the understanding about the sampling
distribution of the mean, a crucial concept for statistical inference.
This study investigates two different types of students, sensor and intuitor, based on a
preferred style of learning, in how they answer questions about sampling distributions and
how they demonstrate reasoning and logic regarding these answers. Ten sections of
introductory statistics are taught at North Carolina State University over three semesters and
data is collected from eight final exam questions. These final exam questions are analyzed
using both quantitative and qualitative analysis techniques. Differences between the groups
are summarized, if they exist. This study also explores foundational questions and their
relationship to understanding the sampling distribution of the mean.
The analysis of data showed differences between the sensor and intuitor on three of
the eight questions, but the level of significance is not very high. No evidence is found to
support that if a student understands a series of questions thought to be foundational to
understanding of sampling distributions then they should exhibit statistical reasoning.
Although there was no evidence to show that there is a largely observable difference between
misconceptions that students reason about a sampling distribution of means as though it were
a simple random sample. Further research is needed to investigate the lexical ambiguity
amongst key terms and definitions and how it affects the performance in the classroom as
well as how students fail to make the connection between a simple random sample and a
Assessing Understanding of Sampling Distributions and Differences in Learning Amongst Different Learning Styles
by
Jennifer Leigh Sloan Beeman
A dissertation submitted to the Graduate Faculty of North Carolina State University
in partial fulfillment of the requirements for the Degree of
Doctor of Philosophy
Statistics
Raleigh, North Carolina
2013
APPROVED BY:
_________________________ ______________________ Dr. Herle McGowan Dr. Hollylynne Stohl Lee
_________________________ _________________________
Dr. David Dickey Dr. Roger Woodard
ii
DEDICATION
iii BIOGRAPHY
29 August 1980………Born – Greenville, SC
2002………...…B.S. Mathematics, Charleston Southern University.
2004………..………… M.S. Statistics, North Carolina State University.
2002 – 2005……….. Teaching Assistant, Department of Statistics,
North Carolina State University
2005-2006………. Student Employee, Data Mining,
Glaxo Smith Kline Pharmaceuticals.
2005 – 2006………Research Assistant,
Statistical and Applied Mathematical Sciences Institute
2005-present……….. Advanced Analytics Software Tester,
Forecasting and Time Series, SAS Institute. Publications
Leonard, Michael, Jennifer (Sloan) Lee, Taiyeong Lee, Bruce Elsheimer. “An Introduction to
Similarity Analysis using SAS®”
http://www.forecasters.org/submissions08/MichaelLeonardISF2008.pdf
Fields of Study
Major Field: Statistics
iv
ACKNOWLEDGEMENTS
First and foremost I want to thank my advisor Dr. Roger Woodard for his patience
and encouragement as I traveled along this journey.
I want to thank my committee members, Dr. Stohl Lee and Dr. McGowan for
providing me with invaluable feedback and support throughout this process. I also want to
thank Dr. Dickey for his willingness to jump into this project and provide his invaluable
insight and wisdom.
I am grateful for two of my colleagues at SAS Institute, Armistead Sapp and Robert
Allison, for providing insight, motivation and guidance. I don’t know anyone else who would
choose to proof read a dissertation for fun in order to help a friend. And I thank all of my
managers at SAS; Bruce Elsheimer, Jim Metcalf, and Bengt Pederson, for keeping me
gainfully employed, and especially Dr. Jim Goodnight, for encouraging me to finish.
Finally, I want to thank my family for being so supportive of me over the last 10
years; most importantly, my husband, Rick Beeman who joined me in this journey only
during the latter part, and pushed me to finish, and my beautiful daughter Sloan Violet, for
sacrificing countless nights of cuddle time in order to let me finish writing. I also want to
thank my uncles, Dr. Lee Sloan, and Dr. Jerry McDowell, my aunt Dolores McDowell, and
especially, my parents, David and Judy Sloan; for being so supportive throughout the past
decade. I could not have done this without any of you and for that I am very grateful.
I write this in memory of Dr. Kay Clayton whose last words to me were, “Do NOT
v
TABLE OF CONTENTS
LIST OF TABLES ... xi
LIST OF FIGURES ... xvi
Chapter 1: Introduction ... 1
Rationale of the Study ... 1
Context of the Study ... 3
Problem Statement ... 4
Research Question 1. ...4
Hypothesis ...4
Research Question 2. ...5
Hypothesis ...5
Definitions: ... 7
Learning Styles. ...7
Statistical Reasoning ...7
Statistical Literacy. ...8
What to expect in the next chapters ... 8
Chapter 2: Literature Review ... 9
Statistics Education ... 9
Statistical Reasoning ... 15
Student Misconceptions ... 31
Learning Styles ... 34
Learning Style Instruments ... 37
MBTI. ...38
KOLB Learning Style Index. ...42
VARK. ...43
Index of Learning Styles ...45
Summary of Learning Styles. ...47
Sampling Distributions ... 48
Key Connections to Project ... 49
Learning Style Connection ...50
Statistical Reasoning and Learning Styles ...50
Theoretical Framework. ...54
Summary ... 58
Chapter 3: Quantitative Methodology ... 59
vi
Overview of Methods Used ... 60
Participant Selection ... 60
Data Analysis ... 61
Quantitative Methods ... 61
Final Exam Questions. ...61
Analysis Tool: Fisher’s Exact Test. ... 61
Sampling Distribution Question taken from CAOS. ... 62
Written Multiple Choice Questions. ... 69
Evaluating a Z-statistic: Probability and Range. ... 70
Foundational Knowledge: Likelihood, Center, Spread, and Shape. ... 72
Likelihood. ... 73
Center ... 74
Spread ... 74
Shape ... 74
Ethical considerations ... 75
Timeline ... 75
Summary ... 76
Chapter 4: Quantitative Results ... 77
Research Question 1. ... 79
Hypothesis ...79
Fall 2006 – Spring 2007. ...81
Graphic Distribution on a Simple Random Sample. ... 81
Graphic Distribution on a Sampling Distribution of Means. ... 84
Comparison/Interaction of Simple Random Sample and Sampling Distributions. .... 86
Fall 2007 – Fall 2008. ...87
Graphic Distribution on a Simple Random Sample. ... 88
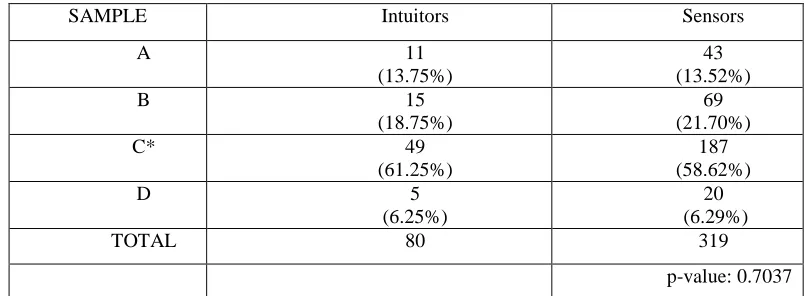
The observed p-value of 0.7037 indicates that we have no reason to reject Hₒ suggesting that there is not a significant difference between how an intuitor and a sensor answer this question regarding the distribution of a simple random sample. All other counts seem to be relatively proportional within the answer selection. The Fisher’s Exact test on the 4x2 table yields a p-value of 0.9559. ... 89
Graphic Distribution on a Sampling Distribution of Means. ... 91
Comparison/Interaction of Simple Random Sample and Sampling Distributions. .... 95
vii
Likelihood ... 97
Center ... 99
Evaluating a Z-Statistic: Probability and Range. ... 102
Quantitative Analysis Summary. ...109
Analysis Summary ... 111
Chapter 5: Qualitative Methodology ... 116
Overview of Methods Used ... 117
Interview Selection ... 117
Focus Groups and Interviews ... 118
Interviews ... 119
Data Analysis ... 121
Qualitative Methods ... 121
Interview Based Methods. ...123
Pilot Study. ...123
Task Based Interviews. ...127
Qualitative Analysis Tools: Grounded Theory, Text Mining and Content Analysis. ...128
Grounded Theory ... 132
Text Mining ... 134
Content Analysis. ... 135
Final Exam Questions. ...137
Foundational Knowledge: Likelihood, Center, Spread, and Shape. ... 138
Likelihood ... 138
Center ... 139
Spread ... 140
Shape ... 140
Ethical considerations ... 140
Timeline ... 141
Summary ... 142
Chapter 6: Qualitative Results ... 143
Research Question 2. ... 143
Hypothesis ...143
Data Analysis. ...144
Grounded Theory. ...144
Likelihood. ... 145
viii
Correct Reasoning. ... 149
Misconceptions. ... 152
More Information Needed. ... 154
Center. ... 156
Overall Results. ... 156
Correct Reasoning. ... 160
Misconceptions. ... 164
More Information Needed. ... 169
Spread. ... 171
Overall Results. ... 171
Correct Reasoning. ... 175
Misconceptions. ... 177
More Information Needed ... 185
Shape. ... 186
Overall Results. ... 186
Correct Reasoning. ... 189
Misconceptions. ... 193
More Information Needed. ... 197
Foundational Questions Combined. ... 198
Grounded Theory Summary. ... 202
Text mining using SAS. ...205
Likelihood. ... 205
Center. ... 209
Spread. ... 213
Shape. ... 216
Text Mining Summary. ... 221
Content Analysis. ...222
Likelihood. ... 225
Overall Results. ... 225
Subset of Responses. ... 229
Comparison with Grounded Theory ... 231
ix
Overall Results. ... 235
Subset of Responses. ... 238
Comparison with Grounded Theory. ... 240
Spread. ... 248
Overall Results. ... 248
Subset of Results. ... 251
Comparison with Grounded Theory. ... 253
Shape. ... 255
Overall Results. ... 256
Subset of Responses. ... 258
Comparison with Grounded Theory. ... 260
Content Analysis Summary. ... 263
Summary of Analysis Methods ... 265
Qualitative Analysis Summary ... 268
Chapter 7: Conclusions, Limitations and Implications ... 273
Overview of Conclusions ... 273
Limitations of the Study ... 275
Instrument Effect ...275
The Instructor Effect. ...277
The Researcher Effect. ...278
The Learning Style Effect ...278
Discussion ... 279
Implications for Future Research ... 282
Summary ... 283
References ... 285
APPENDICES ... 294
Appendix A - Informed Consent Form ... 295
Appendix B - Focus Group Fall 2006 ... 298
Appendix C – Focus Group Procedures for ST311 ... 319
Appendix D – Invitation ... 324
Appendix F – Responses ... 334
Appendix G – Task Based Interview Format ... 338
x
Appendix I – Task Based Interview Fall 2007 pre Assessment ... 371
Appendix J – Task Based Interview Fall 2007 pre Assessment Results ... 381
Appendix K – Interviews ... 384
Appendix L – Four Foundational Questions Intuitor and Sensor ... 392
Appendix M – Text Mining Per Group ... 394
Appendix N – Content Categorization Rules ... 420
Appendix O – Content Categorization, Center Uncategorized Values ... 431
xi
LIST OF TABLES
Table 1. Correct Reasoning Scales ... 17
Table 2. SOLO Taxonomy ... 26
Table 3. Eight Scales of Student Misconceptions ... 33
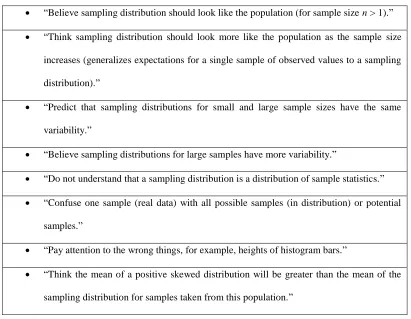
Table 4. Common Sampling Distributions Misconceptions ... 34
Table 5. MBTI statistics of Population Averages ... 40
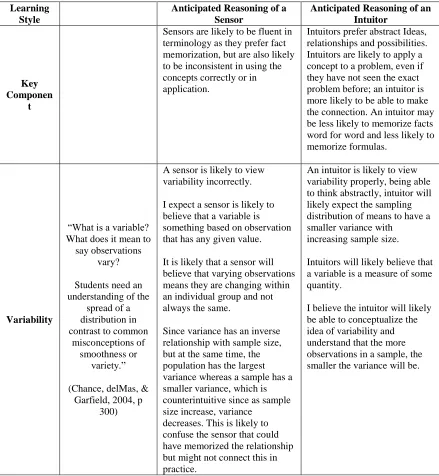
Table 6. Conceptual Framework ... 56
Table 7. Timeline of data collection, analysis, and participant count... 76
Table 8. Participant Rate ... 78
Table 9. Fall 2006 - Spring 2007: Graphic Question on a SRS of 500 observations ... 83
Table 10. Fall 2006 - Spring 2007: Graphic Question on distribution of 500 means ... 85
Table 11. Fall 2006 - Spring 2007: Interaction of SAMPLE and MEANS ... 87
Table 12. Fall 2007 - Fall 2008: Graphic Question on SRS of 500 observations... 89
Table 13. Fall 2007 - Fall 2008: Graphic Question on SRS of 500, Version A ... 90
Table 14. Fall 2007 - Fall 2008: Graphic Question on SRS of 500, Version B ... 91
Table 15. Fall 2007 - Fall 2008: Graphic Question on Distribution of Means ... 93
Table 16. Fall 2007 - Fall 2008: Version A, Means ... 94
Table 17. Fall 2007 - Fall 2008: Version B, Means... 95
Table 18. Fall 2007 - Fall 2008: Interaction of SAMPLE and MEANS ... 96
Table 19. Fall 2007 - Fall 2008: Likelihood ... 98
xii
Table 21. Fall 2007 - Fall 2008: Spread ... 101
Table 22. Fall 2007 - Fall 2008: Shape ... 102
Table 23. Spring 2008 - Fall 2008: Likely in Range, Version I ... 104
Table 24. Spring 2008 - Fall 2008: Likely in Range, Version II ... 105
Table 25. Spring 2008 - Fall 2008: Likely in Range, Combined Versions ... 107
Table 26. Spring 2008 - Fall 2008: Likely Mean, Combined Versions ... 109
Table 27. Results Analysis Summary A ... 113
Table 28. Results Analysis Summary B ... 114
Table 29. Summary of Questions Examined in the Quantitative Analysis and Results ... 115
Table 30. Timeline of data collection, analysis, and participant count ... 142
Table 31. Grounded Theory, Likelihood: Categories ... 146
Table 32. Grounded Theory, Likelihood: Answer and Reasoning ... 148
Table 33. Grounded Theory, Likelihood: Correct Reasoning Categories, Subset ... 150
Table 34. Grounded Theory, Likelihood: Correct Reasoning and Incorrect Response ... 152
Table 35. Grounded Theory, Likelihood: Misconceptions. ... 153
Table 36. Grounded Theory, Likelihood: Misconception Categories, Subset ... 154
Table 37. Grounded Theory, Likelihood: More Information Needed, Subset... 155
Table 38. Grounded Theory, Center: Categories ... 158
Table 39. Grounded Theory, Center: Answer and Reasoning ... 160
Table 40. Grounded Theory, Center: Correct Reasoning Categories, Subset ... 162
Table 41. Grounded Theory, Center: Correct Reasoning and Incorrect Response. ... 164
xiii
Table 43. Grounded Theory, Center: Misconceptions of a sample: Subset ... 167
Table 44. Grounded Theory, Center: Misconceptions. ... 169
Table 45. Grounded Theory, Center: More Information Needed, Subset ... 170
Table 46. Grounded Theory, Spread: Categories ... 173
Table 47. Grounded Theory, Spread: Answer and Reasoning ... 175
Table 48. Grounded Theory, Spread: Correct Reasoning Categories, Subset ... 176
Table 49. Grounded Theory, Spread: Correct Reasoning and Incorrect Response. ... 177
Table 50. Grounded Theory, Spread: Misconceptions About Variance, Subset ... 178
Table 51. Grounded Theory, Spread: Misconception about the Mean, Subset ... 179
Table 52. Grounded Theory, Spread: Misconceptions, Subset ... 181
Table 53. Grounded Theory, Spread: Misconception involving Outliers, Subset ... 182
Table 54. Grounded Theory, Spread: Miscellaneous Category, Subset ... 183
Table 55 Grounded Theory, Spread: Misconceptions on Standard Deviation, Subset ... 184
Table 56. Grounded Theory, Spread: Misconceptions ... 185
Table 57. Grounded Theory, Shape: Categories ... 187
Table 58. Grounded Theory, Shape: Answer and Reasoning ... 189
Table 59. Grounded Theory, Shape: Correct Reasoning Categories, Subset ... 190
Table 60. Grounded Theory, Shape: Correct Reasoning and Incorrect Response. ... 191
Table 61. Grounded Theory, Shape: Partially Correct Response Categories, Subset ... 192
Table 62. Grounded Theory, Shape: Misconception of Sample, Subset ... 194
Table 63. Grounded Theory, Shape: Misconception of Sample, Subset ... 195
xiv
Table 65. Grounded Theory, Shape: Misconceptions. ... 197
Table 66. Grounded Theory, Shape: Not Enough Information, Subset ... 198
Table 67. Grounded Theory: Interaction of Spread, Shape, Center, and Likelihood ... 201
Table 68. Summary of Grounded Theory ... 204
Table 69. Text Mining, Likelihood: Topics, Intuitor ... 206
Table 70. Text Mining, Likelihood: Topics, Sensor ... 207
Table 71. Text Mining, Center: Topics, Intuitor ... 210
Table 72. Text Mining, Center: Topics, Sensor ... 211
Table 73. Text Mining, Spread: Topics, Intuitor ... 214
Table 74. Text Mining, Spread: Topics, Sensor ... 215
Table 75. Text Mining, Shape: Topics, Intuitor... 217
Table 76. Text Mining, Shape: Topics, Sensor ... 218
Table 77. Text Mining, Shape: Response Subset, Sensor... 220
Table 78. Text Mining, Shape: Response Subset, Intuitor ... 221
Table 79. Content Categorization, Likelihood. ... 226
Table 80. Content Categorization, Likelihood: Correct Reasoning and Correct Answer .... 228
Table 81. Content Categorization, Likelihood: Correct Reason and Incorrect Answer ... 229
Table 82. Content Categorization, Likelihood: Subset ... 230
Table 83. Content Categorization vs. Grounded Theory: Likelihood. ... 234
Table 84. Content Categorization, Center... 236
Table 85. Content Categorization, Center: Correct Reasoning and Correct Answer ... 237
xv
Table 87. Content Categorization, Center: Response Subset ... 239
Table 88. Content Categorization vs. Grounded Theory: Center, No Response ... 242
Table 89. Content Categorization vs. Grounded Theory: Center unmatched categories ... 244
Table 90. Content Categorization vs. Grounded Theory: Center ... 246
Table 91. Content Categorization vs. Grounded Theory: Center Simplified ... 247
Table 92. Content Categorization, Spread ... 249
Table 93. Content Categorization, Spread: Correct Reasoning and Correct Answer ... 250
Table 94. Content Categorization, Spread: Correct Reason and Incorrect Answer... 251
Table 95. Content Categorization, Spread: Subset ... 252
Table 96. Content Categorization vs. Grounded Theory: Spread ... 254
Table 97. Content Categorization, Shape ... 256
Table 98. Content Categorization, Shape: Correct Reasoning and Correct Answer ... 257
Table 99. Content Categorization, Shape: Correct Reason and Incorrect Answer ... 258
Table 100. Content Categorization, Shape: Subset ... 259
Table 101. Content Categorization vs. Grounded Theory: Shape ... 261
Table 102. Content Categorization vs. Grounded Theory: Shape Simplified ... 262
Table 103. Content Categorization Summary ... 265
Table 104. Analysis Methods Summary ... 266
Table 105. Results Analysis Summary A ... 270
Table 106. Results Analysis Summary B ... 271
Table 107. Summary of Questions Examined in the Qualitative Analysis and Results ... 272
xvi LIST OF FIGURES
Figure 1. Final Exam Fall 2006 - Spring 2007 ... 65
Figure 2. Final Exam Fall 2007 - Fall 2008, Version A. ... 67
Figure 3. Final Exam Fall 2007 - Fall 2008, Version B ... 68
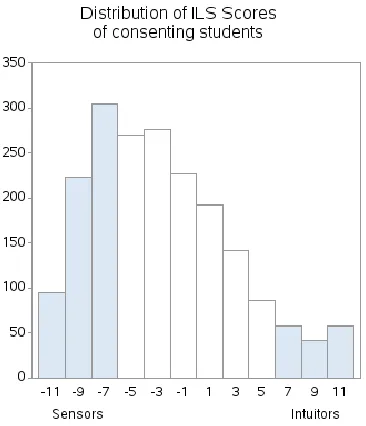
Figure 4. Distribution of ILS Scores of Consenting Students. ... 79
Figure 5. Applet and questions asked during interview Part 1. ... 125
1
Chapter 1: Introduction
Perhaps the most important topic for introductory statistics is the concept of sampling
distributions. It is a lynch pin for most of the topics in introductory statistics, such as
confidence intervals and hypothesis tests and it is often viewed as the key to statistical
inference. I explored the topic of sampling distributions and how students are learning
interrelated concepts in an introductory statistics course at North Carolina State University.
Rationale of the Study
The idea of the sampling distribution of the mean and its associated characteristics
such as center, shape and variability are core concepts presented in an introductory statistics
course. It is obvious, from both personal observation and the literature in statistics education,
students struggle with understanding the concept of a sampling distribution of the mean.
The American Statistical Association (ASA) released a report presenting guidelines
for the assessment and instruction in statistics education at the college level in February of
2005, calledGuidelines for Assessment and Instruction in Statistics Education (GAISE).
They reported that at two year colleges, enrollment in statistics courses grew to 74% the size
of calculus enrollments by 2000 (Aliaga, Cobb, Cuff, Garfield, Gould, Lock, & Witmer,
2005). George Cobb notes, as cited by Aliaga,et. al., “Any introductory course should take as its main goal helping students to learn the basic elements of statistical thinking” (Aliaga, et
al., 2005, p. 8). The goal for today’s students tends to focus less on learning a set of tools and
procedures and more on the conceptual understanding of statistical literacy and thinking
(Aliaga, et al., 2005). In the guidelines, the goals for students in an introductory course
2
of a sampling distribution and how it applies to making a statistical inference based on
samples of data (including the idea of standard error)” (Aliaga, et al., 2005, p. 12).
Even though the topic of sampling distributions is so important, it is also one of the
most difficult for many students. What causes these difficulties for students? Can we improve
our methods of teaching to make this topic easier for students to understand? In this research
I explore a student’s learning style as one possible factor that might influence understanding
of sampling distributions.
A learning style can be defined as a student’s preferred style of learning. Specific to
my research, I looked at a dimension of learning called, Sensing/Intuition. Briefly, a sensing
learner (sensor) prefers real world examples, and to memorize facts and formula and plug in
numbers. An intuitive learner (intuitor) deals better with abstract ideas and dislikes
memorization and “plug in chug” type calculations (Felder & Solomon, 1999). I have chosen
this dimension of learning styles based on the characteristic of concrete versus abstract
thinking which is described in greater detail, in later sections.
The purpose of this dissertation is to explore the possibility of a learning style affect
upon understanding, and to attempt to find differences between sensors and intuitors. I
identified the misconceptions that students have in understanding the concept of sampling
distributions and explored the possibility that students with different styles of learning will
approach the topic differently. I explored the different styles of learning and the ways in
which these students, possessing different preferences for learning, process the same
3
I believe that there is a difference between specific groups of students and that their
learning styles affect the way they may understand the statistical concept of sampling
distribution and relevant properties. I attempted to determine if there were any differences
between groups of students and showed differences, if they exist, in the way in which the
student exhibits an understanding or lack of understanding on the subject matter.
Context of the Study
This study took place at North Carolina State University. On average, NCSU enrolls
nearly 25,000 undergraduate students with over 90% of them from North Carolina. Over
50% of the undergraduate students enrolled at NCSU are non-science and math majors (NC
State University, 2012). By the fall 2009 semester, the student to faculty ratio was listed as
17:1 (NC State University, 2012).
The university offers an introduction to statistics course at the 300 level through the
statistics department. There are no prerequisites for this course and this is the only
introductory statistics course offered to non-math and science majors.
“The syllabus covers introductory topics such as, relationships between two
variables using graphical techniques, simple linear regression and correlation
methods, producing data using experiment design and sampling. Elementary
probability and the basic notions of statistical inference including confidence
interval estimation and tests of hypothesis. One and two sample t-tests,
one-way analysis of variance, and inference for count data and regression” (NC
4 Problem Statement
Despite the findings in previous research, the fact remains: There is no definitive
solution to correcting student misconceptions. We, as educators lack specific methods for
teaching the topic of sampling distributions in order to maximize learning and understanding.
My aim is to help facilitate the development of a method of teaching that improves the students’ conceptualization of sampling distribution while reducing the recurrent
misconceptions by establishing differences between types of students and assessing levels of
reasoning.
This research has two parts. The main goal is to determine if there are any observable
differences between sensors and intuitors in the way they understand sampling distributions.
I plan to assess this in two parts. In order to look at student differences, I used quantitative
and qualitative data analysis techniques on data collected from questions presented on a final
exam.
The major question addressed in my research is: Do sensors learn (understand)
sampling distribution differently than intuitors? If no differences exist, how then do we teach
the concept of sampling distributions to harvest a deeper understanding and support the
comprehension of the underlying relationships between many interrelated concepts?
Research Question 1.
Are there any differences between sensors and intuitors in their responses to sampling distributions activities?
5
understand sampling distributions differently, and that intuitors are more likely to
comprehend more abstract concepts than the sensor. I believe that sensors are more likely
than intuitors to fail to apply a formula or definition in practice, but that the sensor will be
better at fact memorization and recalling a formula. My belief is that a sensor be stronger than an intuitor at solving an equation involving “plug and chug” style, but that the intuitor
will be stronger than the sensor at solving complex problems and applying the information
given in a word problem to solving the answer involving the understanding of the sampling
distribution of means.
Research Question 2.
Are there any differences between sensors and intuitors in how they use logic and reasoning in qualitative responses to sampling distribution questions?
Hypothesis. I believe that a sensor will be more likely to provide a good
rationalization but fail to apply it to answering a question, meaning, the sensor might be able
to give a definition or formula, but will be unable to apply it in context. I believe that an
intuitor will be more likely to apply definitions in context, but may be less likely to give
definitions verbatim, and might be more likely to give justifications in their own terms.
Evaluating these answers is quite complex and will involve the evaluation of the
answer to a question about the sampling distribution using mixed methods; both quantitative
and qualitative data analysis. The quantitative data were categorized as either correct or
incorrect, and then within each group, I looked at how the student supports their answer
using qualitative analysis. I explored the use of three qualitative analysis methods: grounded
6
a strong alternative to grounded theory and much faster as it involves computer logic, but
some of the precision of grounded theory was lost in the automated categorization.
I expected that overall; intuitors would be more likely than sensors to understand the
concept of the sampling distribution. Since the majority of students are sensors, I evaluated
whether sensors comprehended these difficult and abstract statistical concepts, since they
make up the vast majority of the classroom population (Myers-Briggs Foundation. (n.d.)).
My hypothesis that sensors and intuitors understand sampling distributions
differently, and intuitors are more likely to comprehend more abstract concepts than sensors
is based on the premise that intuitors are stronger at thinking abstractly. I believe that
sensors will be more likely than intuitors to memorize a definition but then fail to apply this
definition from a practical perspective.
First I explored the research question: Are there any differences in how sensors and
intuitors respond to a question regarding the sampling distribution of the mean. Can I find
any observable differences between how a sensor versus an intuitor makes a multiple choice
answer selection on various questions concerning the sampling distribution of means?
Next I explored the research question: Are there any differences between sensors and
intuitors in how they used logic and reasoning in response to questions regarding the
sampling distribution of means. Can I find any observable differences between how a sensor
and intuitor provide reasoning in giving rationalization for answers regarding the sampling
distribution.
I explored the following questions as well: Do students select the correct answer but
7
that leads us to believe they “understand” the information or definitions, but fail to apply
them successfully. My research lead to determining the reasoning of the student and their
ability to apply this reasoning to questions about the sampling distribution. When I finished
the analysis, I described the differences between sensors and intuitors in how they both
understand and apply their reasoning to sampling distributions.
Since the majority of students taking the course are sensors, it was important to
determine if sensors understand the difficult and abstract statistical concepts.
Definitions:
There are various terms that will be used throughout this paper, and thus it is
important to define each term.
Learning Styles. A learning style can be defined as a person’s preferred method of instruction or study that is most effective for them to best learn (Pashler, McDaniel, Rohrer,
& Bjork, 2008, p. 106). There are various methods used to determine one’s learning styles. In
the following chapter, I discuss, in detail, a few of the popular methods and then explain why
I chose the method I did for my research. Conceptual Understanding. Conceptual understanding can be defined as the understanding of concepts and ideas required for the
process of conceptual development. It is also part of being able to determine the connections
(i.e. relationships) between different statistical concepts and techniques necessary for success
in problem solving (statistically) (Gal & Garfield, 1997, p. 8-9).
Statistical Reasoning. “Statistical Reasoning may be defined as the way people reason with statistical ideas and make sense of statistical information.” (Garfield, 2002, p. 1)
8
summaries, and making inference or judgment about such data. Garfield claims that the
underlying part of statistical reasoning is conceptual understanding of important ideas such as
spread, center, shape, randomness, and sampling. Research by Garfield also concludes that
students who do well in a statistical course do not often do well when their statistical
reasoning is measured.
Statistical Literacy. Statistical literacy can be defined as understanding the basic language and tools of statistics, knowing what specific terms mean, understanding symbols,
and recognizing as well as being able to interpret different representations of data (Rumsey,
2002).
What to expect in the next chapters
Chapter 2 provides a literature review of research for statistics education, learning
styles, and statistical reasoning that are pertinent to the issue of assessing, understanding and
developing reasoning specifically in relation to sampling distributions. Chapter 3 discusses
the quantitative methods I used to both collect and analyze the data from an “Introduction to
Statistics” course at North Carolina State University in order to answer the first research
question posed in this chapter. Chapter 4 gives a detailed quantitative data analysis of all
relevant data from the final exam questions. Chapter 5 discusses the qualitative methods I
used to analyze open response questions and Chapter 6 gives a detailed data analysis of the
responses using three qualitative analysis methods. Finally, Chapter 7 discusses any data
limitations I encountered with this study, the conclusions I was able to draw from my data,
and implications for further research on a student’s understanding of sampling distributions
9
Chapter 2: Literature Review Statistics Education
In 1972 Robert Hogg credits Walter Federer with stating, “One note of warning: if the statistical profession doesn’t do something about the teaching of statistics, other groups will”
(p. 8). In the same year, Robert Hogg used this quote, along with other advice, to challenge
statisticians, especially those in the teaching profession, to submit manuscripts containing innovative programs, which are presently not being used elsewhere. Hogg’s goal was to
establish a series in The American Statistician called Statistical Education. Hogg points to
alternative methods of statistics education, involving the idea that students learn by doing, as
the best way to learn statistics. Most of these methods involve the collection and analysis of
real data, done by the students, which, in Hogg's opinion, leads to better learning. Hogg
comments in 1972, “Certainly, I have never heard of a person learning how to swim by
watching the swimming instructor and I believe that a similar statement can be made about statistics” (p 8). Richard Freund states, “(we must develop) a student who can recognize a
problem and the solution appropriate to it rather than one who has a technique for which he
must find a problem to fit” (Hogg, 1972, p. 10).
In The American Statistician, Roger Carlson (1978) wrote, “The reason (few students
come away with the kind of understanding that we think they need) for this, is a failure to
confront the pedagogical problems of statistics. Until efforts are put into pedagogy, overall
results of understanding will remain about the same” (p. 140). Pedagogy is the art or
10
In the early to mid-1980s several papers were written presenting methods of teaching
statistics. They ranged from teaching basic level statistics to more complex inference based
methods and theories. All of these papers adopt a common underlying theme; improve the
way material is presented so that students have a better overall understanding and grasp of
the key statistical ideas and concepts.
Hubert Blalock, Jr. (1987) wrote a paper titled “Some General Goals in Teaching Statistics.” His first point was that students often approach a course in statistics with much
fear and anxiety, which often does not disappear with the first class. He suggests that by
encouraging the students to think differently about statistics, we can help them overcome, if
not avoid, those moments during a test in which their minds go blank. Blalock suggests that
this can be done by teaching the students to think a problem through in a persistent manner,
rather than having them memorize formulas and techniques. Certainly students need to learn
key facts and ideas, but memorization is often what causes the students to go blank in the
first place. If they had an alternative solution, for times when they do draw a blank then they
would still be able to solve the problem.
Garfield and Ahlgren (1988) published a paper giving implications for further
research in statistics education by listing common misconceptions in statistical reasoning,
and how to address these issues. In describing the misconceptions involving descriptive statistics such as randomness, sample, distribution and average, the authors state “there is
evidence that conceptual difficulties abound for these topics, too,” despite the minimal
amount of attention that had been given to these simple yet powerful ideas. (p.53). Pollatsek,
11
mean, as a computational act rather than conceptual, which actually may inhibit the student
from learning with a more sufficient understanding involving relationships between and among statistical concepts and ideas. “Students’ knowledge often seems limited to
computational formulas, and many simple problems require more general, relational,
knowledge of concepts. (It is) justified that thorough understanding of the material can wait
until the second course (or later)” (Pollatsek, et. al., 1981, p. 202). Justification that I believe
is neither sound, nor appropriate. Since statistical reasoning and inference is the cornerstone
for a more complex understanding of statistics, I believe that failure to teach crucial
statistical concepts that facilitate deeper understanding and reasoning early may result in
more complex confusion. The encompassing idea behind all of this research emerges into the
idea of conceptual understanding or knowledge which is defined in the previous chapter.
Conceptual knowledge is just one of the many components in statistics education.
Most introductory statistics teachers are aware that the terminology itself can be quite
cumbersome; it is common for the student to become quickly lost amongst the morass of
terminology (Singleton, 1989). Singleton (1989) suggested that we teach the basic concepts,
techniques, and principles of sampling through an extended concrete example. The exercise
progressively builds upon students’ understanding; beginning with the concepts of random
selection and sample, and then continuing to simple random sampling. Singleton (1989)
encourages hands on experience in drawing samples and calculating sample estimates.
Despite building on concepts and using hands on experiences, students still fail to
12
deeper understanding. These misconceptions filter through to advanced topics and cause a
complete disconnect in learning.
In 1999, delMas, Garfield and Chance discussed classroom research in statistics,
termed active research, presenting a four step model, with the main goal of gaining insight
into problems, their definitions, and their sources. They developed a model for classroom
research in order to address their concern that: while new methods are being introduced into
the classroom and shared among teachers, no tangible data or evidence are collected to
support their claims. (delMas, Garfield, & Chance, 1999) Many teachers have incorporated
various simulation activities to try to enable the students’ understanding of difficult concepts
such as sampling distribution, but found that after presenting these new methods, students
still demonstrate a lack of statistical understanding as well as possess “troubling
misconceptions about sampling distributions” (delMas, Garfield, & Chance, 1999, p. 2).
The main concern of Chance delMas and Garfield is that “many students who pass a
statistics course do not develop the deep understanding needed to integrate these concepts
(ideas of sample, population, sampling, and sampling variability) and apply them in their
reasoning, ... we see the concept of sampling distribution as crucial to the understanding of
statistical inference” (1999, p. 3).
The idea of a sampling distribution is a key component to statistical inference but
often comes with much difficulty in understanding and carries with it a great amount of
misconception. According to Chance, delMas, & Garfield; “Students tend to look for rules
and pattern but rarely understand the underlying relationships causing the patterns they see”
13
understand why the sampling distribution of means becomes narrower and more normal as
the sample size increases. Therefore, when asked to make predictions about plausible
distributions of samples for a given size of varying population shapes, the students resort to
rules that are often incorrectly memorized, or inconsistently applied, and tend not to think
through the generation process for these distributions. As a result, students confuse the
difference between the distributions of several sample means with the distribution of one
sample of data.
Furthermore, the Chance, delMas, & Garfield also observe that having students use
technology along with making predictions under differing conditions through simulation, and
then testing the accuracy of their predictions against the simulated results does appear “to
improve the impact of the technology on their reasoning” (2004, p. 312). Research shows that “students are more apt to correct their misconceptions and to construct more lasting
connections with their existing knowledge framework” (Chance, delMas, & Garfield, 2004,
p. 312). Technology alone is not enough to cultivate a deeper understanding of key statistical
concepts and abstractions. Their research concludes that, allowing a student’s direct
interaction with software, as well as the ability to test their formulated ideas may have some
effect upon the student’s ability to reason and process, but is not likely to cause a significant
change in the student’s deeper levels of understanding. Good software coupled with concise
directions pointing students towards important features does not ensure that the student will
understand and while contradictory, is necessary for conceptual change; it has not been
14
The problem, in part, of developing a thorough comprehension of sampling
distributions, can be attributed to a student’s lack of understanding of associated concepts,
such as standard deviation, distribution, as well as shape and spread. Evidence also suggests
that although students follow rules to correctly predict the performance of sample means,
they are still unable to correctly describe the process that creates a sampling distribution,
suggesting that a student still cannot fully integrate evidence about sampling distributions, in
spite of their ability to predict behavior correctly.
Many authors take note at the exceeding number of statistical misconceptions,
referenced in the next section. There are very few studies that tell us how to avoid further
encouragement of these misconceptions within our students. One major reason for the lack
of literature is that prior to 2000, few people based their research on how students think,
omitting a major psychological mechanism in learning. Prior to that time, there had been
many contributions to the teaching of statistics, but a very limited amount of data collected
through research, to support these contributed theories and ideas.
In spite of this, over the last ten years, there has been an increase in the number of
publications geared at the topic of statistical reasoning, both in how to develop statistical
reasoning in the student as well as how to assess it. The following sections will discuss recent
literature on statistical reasoning and student misconceptions. A section on how students
prefer to learn will follow and then I related statistical reasoning with how students prefer to
learn, and how I believe the connection between student learning preferences and statistical
reasoning will help guide us in better teaching and assessing of statistical understanding in
15 Statistical Reasoning
The underlying theme of statistical reasoning has proven to be a hot topic for statistics
education research, with the goal of assessing student understanding about sampling
distributions and other underlying concepts. Statistical thinking is applying statistical
thoughts to new problems and then recognizing questions of your own (Rumsey, 2002).
Garfield and Chance (2000) define statistical reasoning as “the way people reason with statistical ideas and make sense of statistical information,” which encompasses drawing
conclusions based on data sets, statistical synopses of data, or representations of data.
Richard Nisbett (1993) summarized reasoning and concluded that it can be improved by
learning statistical rules. Contradictory research has indicated that merely understanding
statistical rules does not necessarily imply statistical reasoning (Garfield, 2002, p. 3).
Statistical reasoning cannot be upheld without statistical literacy, or correct statistical
thinking. Statistical reasoning implies the understanding of important concepts such as:
location and variation, distribution, sampling and randomness, as well as association, and
aims at interpreting statistical results and making inferences (Tempelaar, Gijselaers, & van
der Loeff, 2006, p. 2).
In 2000, Garfield and Chance summarize the current practices being used to assess
students in statistics education and suggest alternative assessment methods (Garfield &
Chance, 2000, p. 100). With a main goal of developing statistical literacy and reasoning,
among other more basic learning goals, the authors suggest an approach to student
16
homework, and other task based assignments such as hands on projects, portfolios of work,
concept maps as well as news critiques and minute papers.
“The Statistical Reasoning Assessment (SRA) was developed and validated as part of
the ChancePlus Project funded by the NSF,” (attributed to the work of both Garfield (1998)
and Konold (1989)), (Garfield and Chance, 2000, p.114). The SRA was the only existing
tool, at that time, which was used in assessing students’ ability to understand statistical
concepts and apply statistical reasoning (Garfield & Chance, 2000, p. 114). The SRA is a 20
question multiple choice test, published in 1998 that became widely available after the
Garfield 2003 publication in the Statistics Education Research Journal: “Assessing Statistical Reasoning” (Tempelaar, 2004, p. 1).
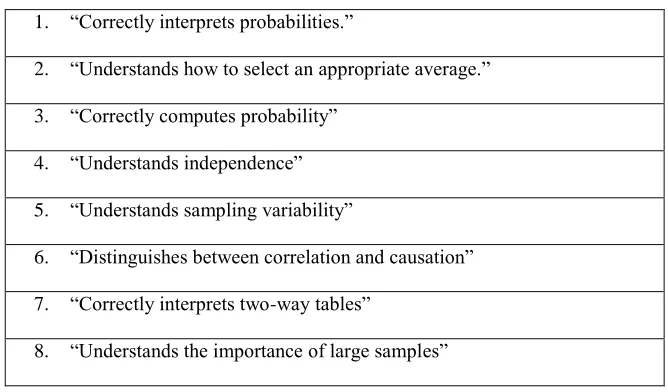
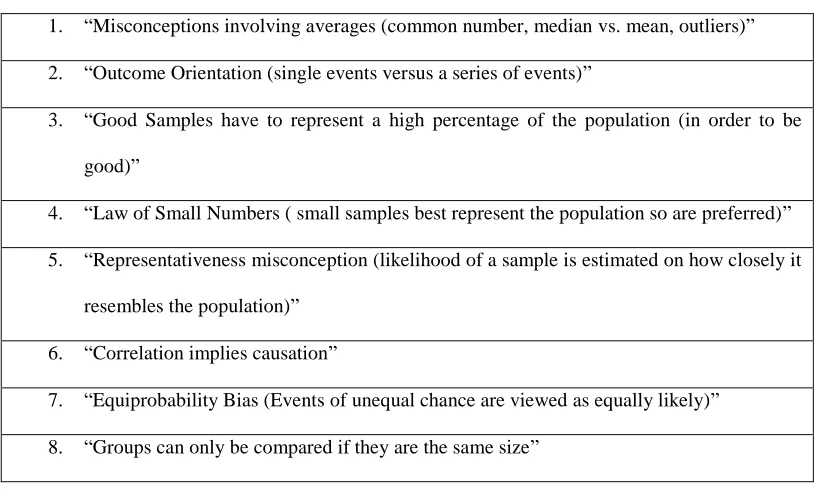
The SRA lists 8 correct and 8 incorrect reasoning scales. The correct reasoning scales
are listed below. The measured misconceptions are listed in the following section, titled,
Student Misconceptions. The following is taken from Table 1 in Garfield and Chance (2000,
17 Table 1. Correct Reasoning Scales
1. “Correctly interprets probabilities.”
2. “Understands how to select an appropriate average.”
3. “Correctly computes probability”
4. “Understands independence”
5. “Understands sampling variability”
6. “Distinguishes between correlation and causation”
7. “Correctly interprets two-way tables”
8. “Understands the importance of large samples”
Garfield (2003) suggests that “traditional forms of assessment such as multiple choice are too narrow to provide sufficient information about student learning” and concludes that despite
the growing emphasis on the development of statistical reasoning in students, it is still a
challenging task to assess statistical reasoning and this area needs more attention in the
research literature. She also adds that “there is still ample room for more studies that develop
new assessments of statistical reasoning” (p. 22, 31).
Building upon what Garfield (2003) suggested regarding needing more complex
methods of assessing statistical reasoning, Lipson (2003) found that since many statistics
students are not mathematically trained, the abstract ideas in statistics tend to be proven
rather than solved, meaning that students are looking for formulas and equations to answer
questions in a statistics course. Lipson (2003) concluded that the understanding of the
18
statistical inference, and confirms that “in order to develop conceptual understanding of the
procedures of statistical inference, the empirical representation of the sampling distribution is an important component of the student’s schema for sampling distribution” (p. 282-83).
Students exhibiting learning approaches based on higher efforts (such as greater
efforts at test preparation or longer amount of time studying) tend to have lower statistical
reasoning scores and a greater number of misconceptions than students that have different
approaches at learning (Tempelaar, Gijselaers, & van der Loeff, 2006). They did not
elaborate what these different learning approaches might be, but they do hypothesize that:
students that exhibit a deeper learning approach are ideal because they tend to focus on
underlying meanings of the main principles, ideas and applications. Tempelaar, Gijselaers, &
van der Loeff, (2006) hypothesized that students exhibiting a surface learning approach to
statistics are less ideal since their focus is mainly on root learning and memorization, with no
real attempts at gaining a deeper understanding, and further hypothesized that students with the deeper understanding approach will have a positive effect upon the student’s level of
statistical reasoning upon entering the statistics course, in opposition to the suggested
negative relationship between surface understanding and statistical reasoning. The authors
administered an inventory of learning styles by Vermunt and Vermetten (2004) and conclude
that correlations between types of learning related to deeper understanding do exist, but they
are quite small, albeit significant. This avenue has not been pursued any further and the
Vermunt and Vermetten learning style index is included in my Learning Styles section to
19
Most teachers instruct on concepts and procedures with the hope that statistical
reasoning develops. This approach is often blind to the overall process of providing proper
instruction to ensure a solid foundation for statistical literacy, inference and reasoning, and
tends to leave the process of developing understanding and reasoning to the student rather
than as part of the task of the teacher.
Several suggestions are made for administering an assessment of statistical reasoning:
Presenting case studies and real life examples, drawing concept maps, providing critiques of
statistical ideas or issues in the media, writing minute papers on what has been learned;
presenting enhanced multiple choice items that map answers with appropriate explanations,
and presenting the statistical reasoning assessment (Garfield & Chance, 2002). There has
been no clear consensus on how to help students develop statistical reasoning, an ongoing
goal of researchers and educators alike.
Measuring a student’s statistical reasoning is something we are now equipped to
ascertain due to the summary by Garfield and Chance on the various assessment methods that
can be used to determine a student’s reasoning; apart from traditional assignment of grades, a
task more directly linked to procedural reasoning. One tool, in particular, is the Statistical
Reasoning Assessment Tool (SRA), which entails 20 multiple choice questions that offer
reasoning along with the response, with both correct and incorrect ideas (Garfield, 2003).
Students taking this assessment are encouraged to select the option which best represents
their own line of thinking. Common misconceptions taken from previous research are used in
developing this tool, and it has been noted that despite being able to correctly determine the
20
underlying the solution. In developing the tool, researchers first established that typical
evaluations of conceptual understanding are inadequate, since students receiving good grades
still uphold misconceptions and misunderstand main ideas (Garfield & Chance, 2000). An
example of this would be the misconception that the sampling distribution of means will have
the same shape as the parent population. The implementation of simulation software into the
classroom addresses the misconceptions by illustrating a visual representation of sampling,
but no evidence has been presented to support its overall effectiveness at circumventing this
misconception.
Research by Saldanha and Thompson (2002a) suggested that the underlying concepts
of sampling distributions are abstract in nature, and a higher level of reasoning is needed to
capture all of its properties. They define this abstract reasoning as relating to all parts of a
problem and how they interact and support one another (Saldanha and Thompson, 2002a). In
sampling distributions, many students possess a more simple kind of reasoning rather than
abstract reasoning. A more simple type of reasoning would only involve viewing the parts
that make up the whole, in terms of definitions rather than abstractions. A simple way to
reason about the sampling process is that the samples drawn are parts that make up the
population. Each individual sample is just a part of the population with no relationships
between samples made (Saldanha & Thompson, 2002a).
Abstract reasoning about sampling distributions, encompasses the parts as
simultaneously making up the whole, such that the means of the repeated samples are
simultaneously approximating the mean of the population. Likewise, the samples will
21
Thompson concludes that generally, poor performing students have been found to view
sampling as a more simple process, a building block from one step to the next, whereas very
few students view sampling distributions as an abstract process (Saldanha & Thompson,
2002a). For sampling distributions, abstract reasoning involves repeatedly sampling from a
population, recording a statistic, and tracking the accumulation of statistics as they distribute
along a range of possibilities. Poor students view sampling in a simple context. Their sense
of variability does not extend to the idea of distribution and their ability to coordinate various
levels of activity such as repeated sampling is weak (Saldanha & Thompson, 2002a).
The authors believe that, if we can teach students to think abstractly regarding the
sampling distribution (of the mean), then we will be able to better teach the subject, thus
enabling a deeper understanding in statistical inference (Saldanha & Thompson, 2002b).
A “mature and well-articulated image of distribution supports quantifying the
expectation of a particular kind of sampling outcome and thus quantifying one’s confidence in a sampling outcomes’ representativeness” (Saldanha & Thompson, 2002a, p. 267). This
entails contrasting the individual sample result against an aggregate of similar sample results
in order to compare the one against many. This image of simultaneity is central to being able
to think in abstract terms. Saldanha and Thompson (2002a) conclude that very few students
are able to think abstractly and speculate that the complex activities of sampling distribution
tend to overshadow the more simplistic ideas of sampling variability that are presented early
in their experiment.
Inferential statistics is founded on reasoning about the characteristic of a population
22
that, while individual samples in a set of samples may vary tremendously from a population,
means of all possible samples of a given size will follow a predictable pattern as described by
the Central Limit Theorem (Heid, M., Perkinson, D., Peters, S., & Fratto, C., 2005). “To
understand sampling distributions, one needs to build on understandings of distribution
(including center, spread and shape), population, samples, and the act of sampling” (Heid, et
al., 2005, p. 1). In this understanding students must be able to distinguish among sample,
sampling distribution, distributions of means, and sampling distribution of sample means;
four concepts that sound very similar but exhibit different behavior and properties (Heid, et
al., 2005).
One of the difficulties of developing statistical reasoning concerning sampling
distributions comes with what Heid, Perkinson, Peters and Fratto (2005) call making and
managing distinctions in regards to sampling distributions. The authors reaffirm that “the
concept of sampling distribution is one of the most complex topics encountered in an introductory statistics course” (p. 1). The similarities of these terms primarily exist in the
nomenclature. For example, the root words amongst these terms are sample and distribution,
listed in nearly every word, and the verbiage itself confuses the definitions to the student who
is often hearing them for the first time in a formal setting. To further confound the issue, the
definition of a sampling distribution, a distribution of means and sampling distribution of
means contains the other terms.
The authors also noted the need to account for the fact that while some properties
hold true under any conditions, some need to be restricted, for example, to a subset of
23
The distinctions referred to by the authors include distinctions in language, in
sampling, in probability, and in measures of spread and center. The distinctions in language are “critical because similar language is used to describe different essential concepts: sample,
sample distribution, distribution of sample means, and sampling distribution of sample
means. Understanding of sampling distribution involves a nesting of concepts and navigating
this web of concepts requires making distinctions about the level of nesting about which one
is thinking” (Heid, et al., 2005, p. 2). They continue to explain that the understanding of the measures of a population’s center and spread is needed to reason about possible values of the
center and spread for samples drawn from the population. “Understanding about possible
values for the measures of center and spread for a sample leads to the need to understand the”
abstract nature of sample statistics, and understanding this abstract nature is central to
understanding about the set of means of all possible samples (of a given size) (p.2).
Therefore, to be able to reason about sampling distribution, students must have a sense of
how likely a sample mean is rather than whether or not the occurrence of the specific mean is
possible (Heid, et al., 2005).
Further, the students also need to understand that there are properties of the sampling
distribution that are absolutely true, such as the mean of the population is equal to the mean
of the sampling distribution. Applying this to sample size, students must also be able to
distinguish the effect sample size has on the sampling distribution characteristics as well as
the characteristics of the individual sample (Heid, et al., 2005).
In conclusion of the study, the authors find that it is imperative that precise language
24
between the closely related concepts within the complexity of sampling distributions. They
state that the everyday meanings of statistical terms are less precise than the statistical
meaning, which compounds the issues students have with the difficulty in reasoning with statistical terms. “The use of informal language impacts one’s ability to make distinctions
that would be available through the use of precise mathematical language,” (Heid, et al.,
2005, p. 5). Being able to develop statistical reasoning is further complicated by the difficulty
in making distinctions among interrelated terms and ideas.
Makar and Confrey (2005) reiterate that the movement of statistics education has
been driven away from rote calculations and operations and towards the development of students’ thinking about what makes sense. The authors discuss and evaluate the use of
standard and nonstandard statistical language when discussing the notion of variation and
explain that while standard language is ideal, it is important to recognize that the concepts being described are far from simplistic, and that students “often articulate meaning in
statistics through the use of less than conventional terminology” (Makar & Confrey, 2005, p.
50). By attending to nonstandard statistical language, the authors believe that you can gain
insight into student thinking and communicate, to students, that statistics can be understood
even without proper statistical talk, but do not imply that you should teach nonstandard
statistical language. By acknowledging only the conventional language, opportunity to gain
insight into students reasoning and thought process could be lost. It can also be noted that
when students use their own language, they are making sense of statistics in their own terms
(Makar & Confrey, 2005). Using standard language to explain or define a statistical process
25
Reading and Reid (2006) conducted a study on reasoning about distributions from the
perspective of variation. In the comprehensive sense, they view variation as the explanation
or amount of the observable characteristic variability. They expect the students to include in
their basic descriptions about distributions, concepts of shape, center and spread as well as
outliers, or deviations from the pattern (Reading & Reid, 2006). The goal of their study was “to develop and describe a hierarchy of reasoning about distribution” using SOLO Taxonomy
as a suitable framework. (Reading & Reid, 2006, p. 47). In general, SOLO (Structure of the
Observed Learning Outcome) Taxonomy is a model consisting “of five modes of
functioning, with levels of achievement identifiable within each of these modes” (Reading &
Reid, 2006, p. 48). John B. Biggs and Kevin F. Collis (1982) are attributed with developing
this model in order to evaluate learning. The SOLO taxonomy suggests: Prestructural,
Unistructural, Multistructural, and Relational Understanding. In relation to the elements of
26 Table 2. SOLO Taxonomy
SOLO LEVEL Explanation of Reasoning
Prestructural No reference to key elements of distribution.
Recognizes the concept but does not use it to make inferential statements. Unistructural Focuses on one key element (center, shape, spread)
Indicate a correct understanding of the concept of distribution with one inferential statement.
Multistructural More than one key element of distribution is focused upon.
Shows correct understanding of the distribution concept using multiple inferential statements.
Relational Develops relational links between various key elements of distribution Links concepts together to exhibit a strong understanding of the concept of distribution.
Students are divided into four categories regarding variation: no consideration, weak
consideration, developing consideration and strong consideration (of variation). When asking
students about the sampling distribution and relating to variation, the students with weaker
association compared the distribution of sample means to the parent population and had
expectations for it to be similar in shape and variation. Other students expected the sampling
distribution to have greater variation than the population. Students with some developing
consideration of variation considered the variation in relation to shape or sample size
(Reading & Reid, 2006).
The study concludes that most students with weak consideration of variation, had
responses that focused on some measure of the range of data and the location (mean), while
others incorporated terminology to suggest they considered more than just the center and
spread, using both standard (outliers, skewed) and non-standard (clumped, compact)
27
purposes did so incorrectly,” and they attribute these types of response to more than half of
the students (Reading & Reid, 2006, p. 56).
A third of the students exhibited a developing consideration of variation, and often
made a link between center and spread, as well as explained variation within and between
distributions. Few of the students were able to apply their understandings to the complex idea
of sampling distribution of the mean (Reading & Reid, 2006). Students with a “developed
consideration of variation were able to draw these key elements together to reason better
about distribution, through the language they used and the links they made.” Responses
indicated that a student’s ability to understand and articulate variation may be indicative of
the ability to reason about distributions, and that their understanding was refined about
center, density, spread, skewness and outliers suggesting that how students reason about
variation can be partially solved through the development of their consideration of variation,
and includes the use of non-standard language. Finally, the authors conclude that students
who do not have the correct concepts or language necessary to describe variation are
consequently unable to reason about distribution in context. In conclusion, “tasks designed to
assess outcomes in core themes can also be used to identify indicators of reasoning about distribution.” (Reading & Reid, 2006, p. 63).
Garfield and Ben-Zvi (2007), regarding teaching students about the ideas of
distribution, center, and variability, state that they should first be introduced informally in
intuitive ways such as data exploration and simple experiment design, and then introduced to
the ideas of sampling distribution in a more formal context, in relation to the Central Limit
28
such that rather than first introducing rules and definitions, they introduce the intuitive ideas
and visual demonstrations. The authors add that the concepts of center, shape and spread
should be combined and introduced together rather than be presented as separate isolated
topics in order to guide students to a better understanding.
More recent studies have heeded this call for the development of statistical thinking, and examine “the existence and development of reasoning about important statistical ideas”
through both formal and informal assessment methods. Most of these studies focusing on the assessment of students’ statistical reasoning reveal that despite formal instruction, students
still fail to exhibit correct reasoning about important statistical ideas and concepts (Zieffler,
Garfield, Alt, Dupuis, Holleque, & Chang, 2008, p. 5). Both quantitative and qualitative
approaches have been used to assess statistical reasoning. Researchers have found puzzling
results of a low to zero correlation between course performance and an aggregation of reasoning skills, and that “students with strong effort-based learning approaches tended to
have lower correct reasoning scores, and higher misconception scores, than students with different learning approaches” (Zieffler, Garfield, Alt, et al., 2008, p. 5).
Qualitative methods to assess statistical understanding such as metaphor, SOLO
taxonomy, and an APOS theory (Action, Process, Object, Schema) are introduced. Groth
and Bergner (2005) examined the use of metaphors to assess students understanding of
statistical ideas by asking them “to write down their own metaphor for the concept of a sample” and discuss its strengths and weaknesses. They then used SOLO Taxonomy to
categorize the responses, as cited by Zieffler, Garfield, Alt, et al. (2008), “building on the