www.ijiset.com
Evaluation of the Performance of K-Nearest
Neighbor Algorithm in Determining Student
Learning Styles
Elhaj Musa Ali ElnazeerP
1
Department of computer science East Kordofan University, SudanP
1
P
Bashir Shehu GaladanciP
2
Department of Software Engineering Bayero University, Kano, Nigeria
Hauwa Ahmad AmshiP
5
Department of Mathematics and Computer Science Federal University, Gashuwa, Nigeria
Abdullahi IsaP
3
Department of Mathematical Sciences University of Maiduguri, Nigeria P
3
P
Edeh Michael OnyemaP 4
P
Department of Mathematics and Computer Science Coal City University, Enugu, Nigeria
Hayatu Alhaji SaiduP
6
Department of Computer Science Federal Polytechnic, Mubi, Nigeria
Abstract— Machine Learning (ML) is an important emerging technology that is fast becoming popular due to its distinct features and applicability to different domains. ML has the potentials to play a critical role in the future of education. It can assist the teacher to predict student learning patterns and outcomes, and to generate feedbacks on student learning progress. However, research has shown that different machine learning algorithms exist some of which can predict outcomes with high missed classification error. Consequently, the present study evaluates the performance of K-Nearest Neighbor (K-NN) supervised algorithm in determining students’ learning styles. K-NN algorithm is used in the domain of students’ learning styles to predict the possible outcomes using various numbers of records in the dataset, ratio of test dataset to training dataset and value of K; in order to minimize the missed classification in other ML algorithms. Data were collected through Felder Silverman Questionnaires administered to 200 respondents selected from the Faculty of Computer Science and Information Technology, Bayero University, Kano, Nigeria. The data were analyzed using Felder Silverman classifier to determine the students’ learning style and K-NN algorithm to predict the learning style. The findings reveal that the total number of records in the dataset and ratio of test data to training data are significant factors in determining error rate while K value is found to be weakly significant when determining the error rate. Thus, for a large dataset (like 100 records and above), with low ratio (0.25, 0.33 and 1) and small value of k (1, 2 or 3) an error free value for K-NN algorithm was obtained. This implies that K-NN algorithm produces an excellent result for large dataset. Thus, it is the most efficient data mining technique to be used.
Keywords— Machine Learning; K-Nearest Neighbor
Algorithm; Felder Silverman; Learning Style; Performance.
INTRODUCTION
I.
Advancements in Information and Communications technologies (ICTs) play an important role in our daily life. Activities such as business transactions, decision making, organizational enrollments and other vital aspects of our lives are driven by ICTs. The advancement in ICTs paved the way for the evolution of Artificial intelligence (AI). AI gives presence to what we now call the expert systems. An expert system according to [1] is a computer system that emulates the decision making of a human expert. Expert systems are designed to solve complex problems by reasoning about knowledge, represented primarily as If-Then rules rather than true conventional procedural code.
www.ijiset.com learning algorithms used for inferences from datasets consisting of input data without labeled responses. The supervised learning algorithms, on the other hand, are type of machine learning algorithms that uses a known dataset (called the training dataset) to make predictions. The K-Nearest Neighbor algorithm (K-NN) is one of the most popular machine learning algorithms that is widely used in many applications today. It is a non-parametric method used for classification and regression whereby the input contains K-closest training examples in the feature space [3]. The study is an attempt to evaluate the performance of the K-NN algorithm in determining student learning styles.
Machine learning algorithms are designed to note changes made in data and evolve to new findings as applied to data predictive analytics. A static algorithm only accommodates what it is instructed to accommodate. Machine learning algorithms on the other hand are skillful and more advanced adjusting themselves to new data but they are not always efficient. Many different machine learning algorithms exist, in which most of them predicts outcomes with high missed classification errors. Therefore, K-NN algorithm is used in the domain of students’ learning styles to predict the possible outcomes using various number of records in the dataset, ratio of test dataset to training dataset and value of K; in order to minimize the missed classification in the other machine learning algorithms. An attempt is made to analyze the impact of these factors on the predictions using the above-mentioned algorithm. However, the study evaluates the performance of K-NN algorithm with respect to the total number of records in the data set, the ratio of test data set to training data set and the K value, by developing a system that implements the K-NN algorithm for the purpose of predicting the students learning style and developing a system that calculates the learning style of students from filled questionnaires using the Felder-Silverman classifier algorithm. In addition, there is a calculation of errors generated by the K-NN algorithm when its results are compared to those of the Felder-Silverman classifier algorithm.
RELATEDWORK
II.
There is a growing literature on evaluation of the performance of algorithms. For instance, in the [4], analyzed the performance of different classification models, and algorithms on different data sets were applied to streamline and improve the algorithm performance, namely ID3, Naïve Bayes, Multilayer Perception, and K-nearest neighbor. He found that K-Nearest Neighbor algorithm provides the highest accuracy and passed the tested data set. Study by [5] used SVM and K-NN algorithms to classify data and obtain prediction for target. Medical patient’s nominal data was used to classify and discover the data pattern to predict future disease. They concluded that the K-NN algorithm is a quite good classifier. Furthermore, a study by [6], analyzed the use of machine learning techniques in text classification process. The machine learning techniques such as naïve Bayes, Support Vector Machine, K-Nearest Neighborhood and
Decision Tree were used in different text dataset and the performances were compared. The result shows that the K-NN algorithm has the highest performance among the others.
Also, a Study by [7], proposed K-Nearest Neighbor algorithm classifier to determine the classification and prediction the accuracy where the prediction accuracy is comparatively high. They discovered that K-Nearest Neighbor algorithm gives prediction with less accuracy than the existing K-Nearest Neighbor algorithm. and for a small improvement in the runtime, there will be a large improvement in the prediction accuracy. According to [8], they explored the potentials of machine learning algorithms in the context of an object-based image analysis and to thoroughly test the algorithm’s performance under varying conditions to optimize their usage for urban pattern recognition tasks. Four classification algorithms namely Normal Bayes, K-Nearest Neighbors, Random Trees and Support Vector Machines were selected and implemented on a free and open-source basis. The results shows that the K-NN and BN algorithms showed good performance while the others were poor.
Furthermore, study by [9] built a computational model that uses past students evaluation in order to predict future teaching performance assessments. Several models were built based on two classification techniques: K-Nearest Neighbor algorithm and Support Vector Machine with the purpose of finding a model that has the high performance of the new cases of the test dataset. He found that the K-NN technique classified a better new teaching performance evaluation case than the model based on the Support Vector Machine. The present study by [10], compares two different classification algorithms: K- Nearest Neighbor and Liner Regression, the algorithms were compared on how accurately they predict the winner of a match, how precise they predict, how many goals each team will score and the accuracy of the predicted goal difference. The result shows that the K-NN did well even though the data is not so clear. The study conducted by [11], classified whether a breast cancer is benign or malignant cases after a certain period using a machine learning technique. All algorithms were coded in MATLAB, then compared the accuracies of different techniques and obtained the result. The result shows that the evaluation performance of the K-NN algorithm was the best for overall methodology. Another study by [12], evaluates the performance of support vector machine (SVM) and K-Nearest Neighbor algorithm (K-NN) classifier in diagnosis respiratory pathologies using respiratory sounds from R.A.L.E database. The system included four processing stages, namely preprocessing, feature extraction, classification and performance evaluation. The algorithms used to distinguish normal, airway observation, and parenchymal pathologies. The study concluded that the K-NN classifier was better than the SVM classifier for the discrimination of pulmonary acoustic signals from pathological and normal subjects obtained from R.A.L.E database.
www.ijiset.com Compute Unified Device Architecture (CUDA). They came to
the conclusion that K-NN algorithm which could take the full advantage of the computation horsepower of GPU and its multi-leveled memory architecture increased the performance of the method compared with CPU implementation particularly when the number of records in data sets to be analyzed is large. The research by [14], developed a system that uses historical weather data of a region and then applied the data mining algorithm K-NN to classify that historical data into specific time spans. The study concluded that K-NN algorithm can predict up to seventeen climatic attributes at the same time. [15] examined some of the problems of the K-NN algorithm and came out with a new method that, amongst other features, prevented the diversion of the classification process leading to an increase in the performance of the algorithm. Vincent [16], used an efficient branch and bound R-tree traversal algorithm to find the nearest neighbor object to a point, and then generalized to finding the k-nearest neighbors.
The work of [17] used K-NN algorithm to recognize the projected face image of a person. In the K-NN algorithm used, each data pixel value within the data set was given a class set {c1, c2, c3 … cn}. The data points closest to the neighbor were found by analyzing the distance matrix and then the K-closest to the data point were analyzed to determine the class level which is most common among the set. The K-NN algorithm showed the superior performance of smaller values of k than larger values of k and the closest point among the k nearest neighbor had more influence on the outcome of the query point. A study by [18], used the K-NN algorithm to study step by step text categorization using dynamically produced training documents in predefined categories to find out the category for a new document as input to the program. For each category, the training document was taken from array and put in a similarity function formula.
When the calculation of the similarity of each training document was found, similarities of this document belonging to the same category were added and put into the similarity array. The K-value used in the K-NN algorithm was chosen as the number of the training document. The K-NN algorithm was found to be an efficient and simple algorithm based on the simple weighing approach. The [19], in their study of the precise location estimation of mobile nodes used the K-NN algorithm to minimize location. They used K-NN rule to estimate the best possible location out of 50 locations made of tree triangulated location with five different times. The result of the K-NN algorithm was found to be 217 % to 289 % better than the famous triangulation method. The K-NN algorithm also gave the most appropriate position.
Studied text categorization by [20] using a K-NN algorithm-based machine learning approach. The authors compared the K-NN algorithm to the naïve Bayes and Term Graph methods. The K-NN showed the maximum accuracy compare to the other two methods. However, the time complexity was recorded as a drawback for K-NN algorithm. According to [21], four big data machine learning algorithms were studied namely Bayesian decision theory, K-Nearest
Neighbor algorithm Classification, K-means Clustery and Linear Regression. The K-means was used to assign boundary data points to a cluster whose center is the nearest. Using an iterative algorithm that selects the number of clusters which spilt into data points k, a centroid was randomly assigned to each cluster and then each point in the data was assigned in the nearest centroid and was recomputed by taking the average of all procedures and this was repeated till the cluster became stable. For the experimental study, the training sample for three classes (red, blue, green) 2D provides the boundaries to the system. The result shows that K-NN algorithm performed best among the four methods used when predicting the new class of the test simple.
A study by [22], used the K-NN algorithm to predict economic events based on four different algorithms namely, artificial neural network, naïve Bayesian classifier, Genetic algorithm and K-Nearest Neighbor algorithm. The K-NN algorithm was found to be more effective in predicting the outcomes of the prices of stock on the basis of company performance major and economic data.
The work of [3], developed a system that used the K-NN algorithm and numeric data to forecast the climate of a specific region. Their results were of satisfactory accuracy and it was shown that the K-NN algorithm can be used to reduce the uncertainty in predicting climatic conditions. In the same way, the study by [23], used the K-NN algorithm for the univariate time series prediction. The result shows that the K-NN is a good candidate for times series prediction. A study by [24], four classifiers namely K-NN algorithm, Binary decision, Tree classifier and Naïve Bayes were compared on the problem of predicting cellular localization sites of protein in yeast and E.coli and the result was showed that the K-NN classifier performed better than the other methods used.
The review vanes of the K-NN algorithm by [25], observed that the structure based K-NN techniques suffer due to memory limits whereas the non-structure based K-NN techniques suffer due to compute time complexity. They further found out that the structure-based K-NN algorithm was good for small dataset, while the non-structure based was ideal for a large dataset. Research by [26], studied the process of diagnosing Diabetes Mellitus using K-NN algorithm to predict whether a particular patient is affected by the Diabetes Mellitus or not. They used 100 sample of training data set with 11 attributes and two test samples of 50 rows each to test the algorithm with different values of k. They found discovered that the accuracy and errors increase with increase in the value of K. The work of [27], predicts the stock prices of some major companies using both the back-propagation algorithm and the K-NN algorithm. The study concluded that the predicted price used is closer to the actual price using the K-NN algorithm than using the back-propagation algorithm. The study by [28], investigated the possibility of using K-Nearest Neighbor algorithm to estimate main forest attributes, and came to the conclusion that the K-NN algorithm gave very good results in the prediction of the forest attributes.
www.ijiset.com bank, and found that when the K value increases, the error
increases with the best results obtained when the K value is equal to 3. A research by [30], examines the defects of the software using the K-NN algorithm. The result shows that a new defect prediction method reduces the cost of software systems with a very high accuracy. The work of [31], predicted the possibility of drought occurrence from the Standard Prediction Index (SPI) using the K-NN algorithm, and came to the conclusion that the error of their prediction increases when the value of K increases.
Additionally, the work of [32], compared hypothyroid prediction using two types of machine learning namely K-Nearest Neighbor algorithm and Support vector Machine. Their findings show that the K-NN algorithm performed better than SVM.
METHODOLOGY III.
The study employed the use of Felder Silverman Questionnaires for data collection. The Questionnaires were ministered to 200 respondents selected from the Faculty of Computer Science and Information Technology, Bayero University, Kano, Nigeria. Also use case diagram was also used as shown in Fig 1. The system consists of the distributor and the administrator. The distributor shares the questionnaires generated using the Felder silverman system. The distributor also receives the questionnaires and logs them in to the system using the student ID as indicated by the questionnaire. The data is then extracted from the questionnaire and the Felder silverman algorithm was run to determine the student’s learning style. After which the student learning style was recorded in Database. The administrator logs in and extracts data from the knowledge base then run the KNN algorithm to predict the student learning style. The learning style predicted by the K-NN algorithm is then evaluated and compared with the one obtained using the Felder Silverman classification system. The performance of the K-NN algorithm in predicting student learning style is then
evaluated.
Figure 1: Use Case Diagram for the Propose System
SYSTEMIMPLEMENTATION
IV.
The system was basically developed using Java, Php and MySQL for the database, the database was created using MySql (Xammp) workbench and Php was found useful in testing the application, the various hardware component of the system is the computer system itself.
SYSTEM TESTING
The performance of the K-NN algorithm was evaluated using the following factors
1.The value of K (k=1, 2, 3 …). 2.The size of the Data (20, 50,100,200).
3.The ratio of test data over the training data (4, 3, 1, 0.33, 0.25).
Testing was performed by developing test cases for unit and system testing.
Figure 2 is a page that gives the administrator access to put the username and password before operating the system.
Figure 2: Admin Login Access Page
Figure 3: The K-NN Interface System
www.ijiset.com
Figure 6: A graph of error against K value with
Figure 4: FSLSM Questionnaire Page
Figure 4 shows the questions to answer are displayed for the distributor to go true and entered the students’ responses respectively before submitting.
Figure 5: K-NN Parameter (number of records in data sets)
Figure 5 shows the total records of the students that answered the questionnaire assigned to them, the next step is use the K-NN algorithm to know the error of the algorithm which depend on the factors of the K-NN algorithm entered into the system.
RESULTSANDANALYSIS
V.
Here the results of the performance evaluation on the K-NN algorithm applied to know students’ learning styles according to the FSLSM questionnaire are given for randomly selected data sets for N=20, N=50, N=100 and N=200. The questionnaire is distributed to the Computer Science students of Bayero University, Kano. The results were then analyzed to see the effects of K value, ratio and number of records in data set. Here the acceptable error is 11% or less according to [33].
Result for N=20
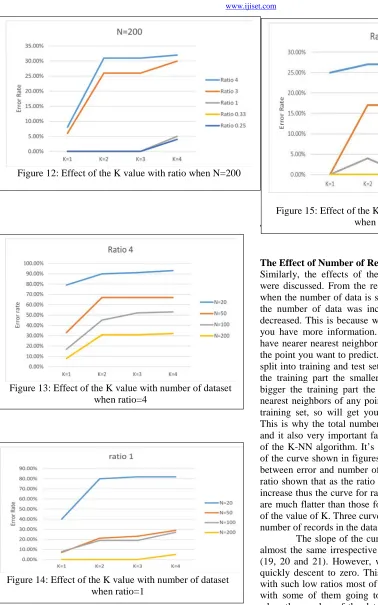
As shown in the figure 6 below it is clearly seen that when the number of datasets is 20 the error is higher than 20% for all ratios and all K values. This is much higher than allowable error percentage margin.
Result for N=50
As shown in figure 7 below when N=50 the value of the error varies with the value of K, N and R. It also shows the relationship between the error and value of K for varies ratios of (ratios 4, 3, 1, 0.33, 0.25) the figure clearly shown that as the ratio of (test data over training data) increases the error also increase significantly. On the other hand, the value of the error does not change significantly as K increases. It is interesting to see in the figure 7 that the error is acceptable for ratio 0.25, 0.33 and ratio 1 for only when K is equal to1.
Result for N=100
As shown below in figure 8 when N=100 the characteristics are similar as N=50. However, there are now curves of two ratios (0.25 and 0.33) are within the acceptable margin of all values of K. While all others are out site of the acceptable error accept the ratio 1 when K is equal to 1.
www.ijiset.com
Result for N =200
For number of records in datasets is equal to 200 as shown in figure 9 the error for all the series when the ratio is less than or equal to 1 fall within the acceptable error margin accept for k is equal to or greater than 10 when ratio is equal to 1 and it is error acceptable for ratio 3 and 4 only when K value is equal 1.
ANALYSIS OF RESULTS
This section presents the analysis of the results obtained.
The Effect of K value
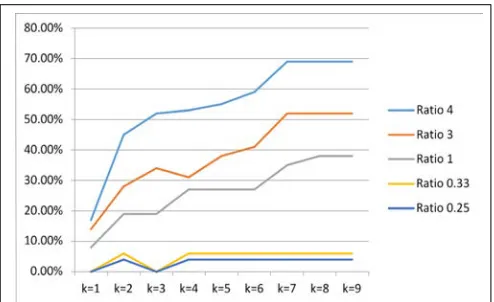
It can be seen from the results obtained in figure (10, 11, and 12) that when the k is small the error is also small. With this kind of data, a lower k is recommended, as this will prevent skewing by neighbors in other classification. Having a lower k also helps identify outlier more easily. While when the K value was increased the error also increased. This is because the unlabeled point always assumes the same label as that of its nearest point. However, if the K value is increase, it
assumes the label of the majority votes. This is in accordance with the work of other researchers like [28], [31], [29]. The K value is not strong significant according to the correlation analysis. Furthermore it’s interesting to note that the gradient of the curve shown in figures (fig 13, fig 14 and fig 15) the relationship between error and K value get the gradient become progressively higher as the ratio between (ratio 3 and ratio 4) increases thus for low ratio such as ratios (0.25, 0.33 and 1) the curves are flat irrespective of the number of record in data set it’s same thing. It’s also worth noting that as total number of record in datasets increases more of the curves shown in figures (fig 10, fig 11 and fig 12) the relationship between K value and the ratio fall within the acceptable error, while for total number of the data set is 20 none of the curves fall within the acceptable error. For total number of the data set is 200 three of the curves (ratio 0.25, ratio 0.33 and ratio 1) all come under the acceptable error range.
Figure 9: A graph of error against K value with different ratios of training vs. test data
Figure 8: A graph of error against K value with different ratios of training vs. test data
Figure 10: Effect of the K value with ratio when N=20
www.ijiset.com
The Effect of Number of Records in the Dataset
The Effect of Number of Records in the Dataset
Similarly, the effects of the amount or number of datasets were discussed. From the results obtained we observed that, when the number of data is small the error is high. But, when the number of data was increased the error came down or decreased. This is because when you increase the data points you have more information. In the case of K-NN, you will have nearer nearest neighbors which will tell you more about the point you want to predict. Moreover, when the dataset was split into training and test set, it was observed that the bigger the training part the smaller the error. This is because, the bigger the training part the more likely that most of the k nearest neighbors of any point in the test set are all from the training set, so will get you approximately the same result. This is why the total number of datasets is strong significant and it also very important factor to evaluate the performance of the K-NN algorithm. It’s interesting to note that the study of the curve shown in figures (16, 17 and 18) the relationship between error and number of records in data set for previous ratio shown that as the ratio increases the slope of the curves increase thus the curve for ratio of 0.25, ratio 0.33 and ratio 1 are much flatter than those for ratios 3 and 4 this irrespective of the value of K. Three curves in the acceptable error for total number of records in the data set is 50 and above.
The slope of the curves for different values of K are almost the same irrespective of the ratio as shown in figures (19, 20 and 21). However, when the ratio is low the curves quickly descent to zero. This is consistent with the fact that with such low ratios most of the curves have acceptable error with some of them going to the zero. In the final analysis when the number of the data set is equal to 200 the error is within the acceptable value of less than 11% irrespective of the value of K, but when the total number of records in data set is 50 only the curve for k=1 is within the acceptable rate. Figure 12: Effect of the K value with ratio when N=200
Figure 15: Effect of the K value with number of dataset when ratio=0.25
Figure 13: Effect of the K value with number of dataset when ratio=4
www.ijiset.com
Figure 16: Effect of the number of dataset with ratio when K=1
Figure 17: Effect of the number of dataset with ratio when K=2
Figure 19: Effect of the number of dataset with K value when Ratio is 4
Figure 20: Effect of the number of dataset with K value when Ratio is 1
Figure 21: Effect of the number of datasets with K value when Ratio is 0.25
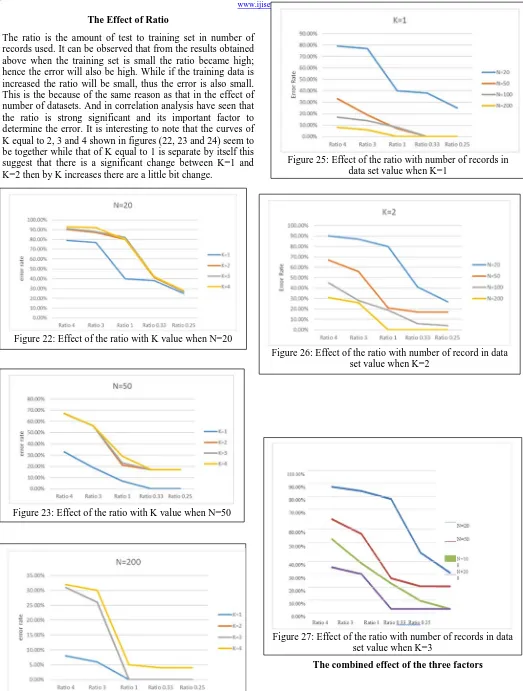
www.ijiset.com The Effect of Ratio
The ratio is the amount of test to training set in number of records used. It can be observed that from the results obtained above when the training set is small the ratio became high; hence the error will also be high. While if the training data is increased the ratio will be small, thus the error is also small. This is the because of the same reason as that in the effect of number of datasets. And in correlation analysis have seen that the ratio is strong significant and its important factor to determine the error. It is interesting to note that the curves of K equal to 2, 3 and 4 shown in figures (22, 23 and 24) seem to be together while that of K equal to 1 is separate by itself this suggest that there is a significant change between K=1 and K=2 then by K increases there are a little bit change.
The combined effect of the three factors Figure 22: Effect of the ratio with K value when N=20
Figure 23: Effect of the ratio with K value when N=50
Figure 25: Effect of the ratio with number of records in data set value when K=1
Figure 26: Effect of the ratio with number of record in data set value when K=2
www.ijiset.com
For small values of k and small numbers of records the error is large. However, when the number of records is increased, for the same value of K, the error decreases. On the other hand, increasing the ratio of test data over training data leads to an increase in the error. When the K value is increased for the same number of records and the same ratio, the error increases.
For a datasets of 20 records, the error for all ratios and all values of K is not acceptable. When the number of records in the dataset increases to 50, the error is acceptable for ratio 0.25, 0.33 and 1 only when K is equal to 1. The error is unacceptable for all other values of K. When the total number of records in the data set to 100, the error is acceptable for ratio 0.25 and 0.33 for all value of K and for ratio 1 only when the value of K is 1. When the total number of records in the dataset is increased to 200, it is clearly seen than the error is acceptable for all values of K for ratios 0.25, 0.33 and 1 and the error is acceptable for ratios 3 and 4 for value of K equal to 1 as shown in Table 1 below.
Table 1: Acceptable errors for all 3 factors combined
The total number
of
The K value The
ratio
Acceptable error
20 1,2,3,4 0.25
,0.33, 1 , 3 , 4
None
50 1,2,3,4,5,6 0.25
,0.33, 1 , 3 , 4
K=1 ratio 0.25,
100 1,2,3,4,5,6,7,8,9 0.25
,0.33, 1 , 3 , 4
All value of K
Ratio 0.25 , 0.33 ( ratio 1 for only when k =1) 200 1,2,3,4,5,6,7,8,9,10,11,12 0.25
,0.33, 1 , 3 , 4
K less than 10
Ratios( 0.25 , 0.33, 1)
(ratio 3 and 4 only when k=1)
CORRELATION ANALYSIS
In order to find out the correlation analysis to determine the strength of the correlation analysis using SPSS. Correlation analysis is a statistical technique that can show whether and how strongly pairs of variables are related (Zaid, 2015). The correlation analysis indicates that the K value is not strong
significant to determine the error. On the other hand, the ratio and total number of datasets are strong significant to determine the error.
LIMITATIONS VI.
The following are limitations of the research work.
1. The study uses classification technique in carrying out the prediction and only two classifier algorithms were used out of the numerous data mining algorithms.
2. Other researchers can use any other questionnaire to determine the students’ learning styles such as Kolb’s, Honey and Mumford questionnaire.
3. K-Nearest Neighbor algorithm (K-NN) is used to predict the learning style of the students’ in this research. Support vector machine and Naïve Bayes algorithms can be used in future research to predict the learning styles of the students.
CONCLUSIONANDRECOMMENDATIONS
VII.
The total number of records in the dataset, ratios of test data to training data and the K value were found to be correlated [1]with error. The correlation analysis, however, shows that the total number of records in the dataset and ratios were more strongly significant to determine the errors. The K value was not strongly significant in determining the error. For small values of k and small numbers of records the error is large. However, when the number of records is increased, for the same value of K, the error decreases. On the other hand, increasing the ratio of test data over training data leads to an increase in the error. When the K value is increased for the same number of records and the same ratio, the error increases. For a dataset of 20 records, the error for all ratios and all values of K is not acceptable. When the number of records in the dataset increases to 50, the error is acceptable for ratio 0.25, 0.33 and 1 only when K is equal to 1. The error is unacceptable for all other values of K. When the total number of records in the data set to 100, the error is acceptable for ratio 0.25 and 0.33 for all value of K and for ratio 1 only when the value of K is 1. When the total number of records in the dataset is increased to 200, it is clearly seen than the error is acceptable for all values of K for ratios 0.25, 0.33 and 1 and the error is acceptable for ratios 3 and 4 for value of K equal to 1. The following recommendations are made for future types of research work. There is a need to measure the performances of various algorithms apart from the K-NN algorithm in order to identify which among the algorithms better predicts the students’ learning styles. In addition, to find out the most important reasons that make for the differences between the various algorithms. Consequently, there is a need to analyze or to find out the reasons for the strong correlation between N, R, and error and those for the lower correlation with k.
ACKNOWLEDGMENT
www.ijiset.com
Information Technology; and School of Postgraduate Studies, all in Bayero University Kano, Nigeria, in carrying out this research.
REFERENCES
[1] R. Abedi and A. E. Bonyad, "Estimation and Mapping Forest Attributes Using K- Nearest Neighbor Method on IRS-P6 LISS III Satellite Image Data," Union of scientist in Bulgeria, vol. 7, no. 1, pp. 93-102, 2015.
[2] P. Norton and N. Nakai, "Better Prediction of Protein Cellular Localization Sites with the k nearest Neighbors Classifier.," in American Associational for Artificial Intelligence, ISMB-97 Proceedings., 1997.
[3] S. B. Imandoust and M. Bolandraftar, "Application of K-Nearest Neighbor algorithm (K-NN) Approach for Predicting Economic Events: Theoretical Background.," Int. Journal of Engineering Research and Applications, vol. 3, no. 5, pp. 605-610, 2013.
[4] A. K Abdelmoula, "Bank creadit risk analysis with K-Nearest Neihbor algorithm classifier: Case of Tunisian Banks," Accounting and management information systems, vol. 14, no. 1, pp. 79-106, 2015.
[5] D. Alberg and M. Last, "Intelligent Information and Database Systems," in 9th Asian Conference , Kanazawa, Japan, 2017.
[6] S. S. Badhiya, N. U. Sambhe and P. N. Chatur, "K-NN Technique for Analysis and Prediction of Temperature and Humidity Data.," International Journal of Computer Applications, vol. 61, no. 14, pp. 975-8887, 2013.
[7] V. Bijalwan, P. Kumari, J. Pascual and V. S. Bhaskar, "Machine Learning Approach for text and document mining," Department of Computer Science, University of Oviedo, Spain, 2015.
[8] R. M. Chezian and C. Kanakalakshmi, "Performance Evaluation of Machine Learning Techniques for Text Classification.," in Proceedings of the UGC Sponsored National Conference on Advanced Networking and Applications., 2015.
[9] S. Dhanabal and S. Chandramathi, "A Review of various K-Nearest Neighbor algorithm Query Processing Techniques.," International Journal of Computer Application, vol. 30, no. 7, 2011.
[10] G. Dlipui, C. Asmaoa, R. Barilla, L. A. Clevenger, A. Copeland, S. Elnagdy, H. Eng, M. Holmes, S. Jayaraman, K. Khan, S. Lindo, J. Maghsoudi, M. Reid, M. Sale and C. C. Tappert, "Big Data Machine Learning Algorithms," in proceeding of Students-Faculty Reserach Day, Pace University, 2015.
[11] G. E. Dragomir, "Teaching Performance Evaluation Using Supervised Machine Learning Techniques.," in The 5th International Conference on Virtual Learning ICVL., 2010.
[12] S. Govil and N. Chugh, "Prediction of Defects in Software Using K-Nearest Neighbour Algorithm for Cost Reduction.," International Journal of Advanced Research in Computer Science & Technology (IJARCST), vol. 3, no. 2, 2015.
[13] M. Govindrajan and R. M. Chandrasekaran, "Evaluation of K-Nearest Neighbor algorithm classifier performance for direct marketing.," Expert Systems with Applications, vol. 37, 2010.
[14] Z. Jan, M. Abrar, S. Bashir and A. M. Mirza, "Seasonal to Inter-annual Climate Prediction Using Data Mining K-NN Technology.," Springer-Verlag Berlin Heidelberg., 2008.
[15] M. Kahani, "Expert System & Knowledge Engineering in Wikipedia.," PDF generated using the open source mwlib toolkit. See http://code.pediapress.com/ , 2012.
[16] E. F. Kermani, G. A. Barani and M. G. Hassaroeyeh, "Drought monitoring and prediction using K-Nearest Neighbor algorithm.," Journal of AI and Data Mining Published online., 2016.
[17] H. Khamis, K. W. Cheruiyot and S. Kimani, "Application of k- Nearest Neighbour Classification in Medical Data Mining.," International Journal of Information and Communication Technology Research, vol. 4, no. 4, 2014.
[18] M. Kuhkan, "A method to improve the Accuracy of K-Nearest Neighbor algorithm.," International Journal of Computer Engineering and Information Technology, vol. 8, no. 6, pp. 90-95, 2016.
[19] K. S. Kumar and R. M. Chezian, "Support Vector Machine and K- Nearest Neighbor Based Analysis for the Prediction of Hypothyroid," International Journal of Pharma and Bio Sciences, vol. 5, no. 4, pp. 447-453, 2014.
[20] Q. Kvang and L. Zhao, "A practical GUP Based K-NN Algorithm.," Proceedings of the second Symposium International Computer Science and Computation Technology, pp. 151-155, 2009.
[21] A. Muhammad, M. S. Maziham, P. Boursier and M. Sharhralniza, "K-Nearest Neighbor algorithm for Improving Accuracy in Clutter Based Location estimation of Wireless Nodes.," Malaysian Journal of Computer Science, vol. 24, no. 3, pp. 146-159, 2011. [22] C. Oprea, "Performance Evaluation of the Data Mining
Classification Methods.," Annals of the Constantin Brancusi.University of Targu Jiu, Economy Series, Special Issue/Information society and sustainable development., 2014.
www.ijiset.com [24] T. Patil, K. Patil, D. Sonawane and Chandraprakash,
"Prediction Using Back Propagation and K-Nearest Neighbor algorithm (K-NN) Algorithm.," International Journal of Innovative Research in Computer and Communication Engineering, vol. 3, no. 4, 2015.
[25] J. S. Raikwal and K. Saxena, "Performance Evaluation of SVM and K-Nearest Neighbor algorithm over Medical Data set.," International Journal of Computer Applications , vol. 50, no. 14, pp. 975-8887, 2012.
[26] M. Rana, P. Chandorkan, A. Dsosuza and N. Kazi, "Breast Cancer Diagnosis and Recurrence Prediction Using Machine Learning Techniques.," International journal of Research in Engineering and Technology , vol. 4, no. 4, 2015.
[27] S. Rita and T. Leo, "In-Depth analysis of the Felder-Silverman Learning Style Dimension.," Journal of Research on technology In Education., 2007.
[28] P. Rudin, "Football result prediction using simple classification algorithms, a comparison between K-Nearest Neighbor algorithm and Linear Regression.," KTH SKOLAN FÖR DATAVETENSKAP OCH KOMMUNIKATION., 2016.
[29] A. L. Samuel, "Some Studies in Machine Learning Using the Game of Checkers.," IBM Journal of Research and Development., 1959.
[30] A. Sasu, "K-Nearest Neighbor Algorithm for Univariate Time Series Prediction.," Bulleting of the Transilvania University of Brasov, vol. 5, no. 54, 2012.
[31] K. Saxena, Z. Khan and S. Singh, "Diagnosis of Diabetes Mellitus using K Nearest Neighbor Algorithm.," International Journal of Computer Science Trends and Technology (IJCST), vol. 2, no. 4, 2014.
[32] G. Toker and O. Kirmemis, "Text Categorization using K-Nearest Neighbor algorithm Classification.," Computer Engineering Department, Middle East Technical University., 2002.
[33] O. L. Tripp and S. D. Moore, "Examination of pre-service teachers’ learning styles and temperament styles within an elementary science methods course.," Institute
for Learning Styles Journal, vol. 1, pp. 23-33, 2007. [34] V. Vaidehi, S. Vasuhi, R. Mariammal, M. B.
Raghuraman, R. V. Sundara, L. Meenakshi, V. Anupriyadharshini and T. Thangamani, "Person Authentication Using Face Detection.," Processing of the world congress on engineering computer science, San Francisco, USA., 2008.
[35] N. R. S. K. F. Vincent, "Nearest Neighbor queries. In processing of the ACM SIGMOD,," in International Conference on Management of Data, San Jose, AC, 1995.
[36] M. Wieland and M. Pittore, "Performance Evaluation of Machine Learning Algorithms for Urban Pattern Recognition from Multi-spectral Satellite Images.," www.mdpi.com/journal/remote sensing., 2014.