Scholarship@Western
Scholarship@Western
Electronic Thesis and Dissertation Repository
4-19-2012 12:00 AM
Fatty Acid
ω
-Hydroxylases in Soybean
Fatty Acid -Hydroxylases in Soybean
Jessica Koteles
The University of Western Ontario
Supervisor
Dr. Mark Bernards
The University of Western Ontario Graduate Program in Biology
A thesis submitted in partial fulfillment of the requirements for the degree in Master of Science © Jessica Koteles 2012
Follow this and additional works at: https://ir.lib.uwo.ca/etd
Recommended Citation Recommended Citation
Koteles, Jessica, "Fatty Acid ω-Hydroxylases in Soybean" (2012). Electronic Thesis and Dissertation Repository. 447.
https://ir.lib.uwo.ca/etd/447
This Dissertation/Thesis is brought to you for free and open access by Scholarship@Western. It has been accepted for inclusion in Electronic Thesis and Dissertation Repository by an authorized administrator of
(Thesis format: Monograph)
by
Jessica Koteles
Graduate Program in Biology and Environment and Sustainability
A thesis submitted in partial fulfillment of the requirements for the degree of
Master of Science
The School of Graduate and Postdoctoral Studies The University of Western Ontario
London, Ontario, Canada
CERTIFICATE OF EXAMINATION
Supervisor
______________________________ Dr. Mark Bernards
Supervisory Committee
______________________________ Dr. Susanne Kohalmi
______________________________ Dr. Mark Gijzen
Examiners
______________________________ Dr. Sheila Macfie
______________________________ Dr. Sangeeta Dhaubhadel
______________________________ Dr. Shiva Singh
The thesis by
Jessica Koteles
entitled:
Fatty Acid
ω
-Hydroxylases in Soybean
is accepted in partial fulfillment of the requirements for the degree of
Master of Science
Date__________________________ _______________________________
Soybean (Glycine max (L.) Merr.) is an important and widely cultivated crop. A
substantial cause of soybean yield loss is due to root rot caused by the pathogen
Phytophthora sojae. There is an established correlation between preformed soybean root
aliphatic suberin and high levels of partial resistance to P. sojae. Since fatty acid ω
-hydroxylase (FAωH), which introduces a second functional group to fatty acids, is a
critical enzyme in suberin biosynthesis, characterization of soybean FAωHs was
undertaken. Six putative soybean FAωHs (Gm FAωHs) were identified using a
sequence-based in silico approach. Gene-specific primers were developed and relative expression
was analyzed across various tissues using RT-PCR. While differential expression patterns
were detected for Gm FAωH-1, Gm FAωH-2, Gm FAωH-3 and Gm FAωH-4, neither Gm
FAωH-5 nor Gm FAωH-6 were detected in any of the tissues examined. In comparison
with RNA-Seq and EST in silico data, RT-PCR profiles revealed contrasting expression
patterns.
Keywords: Soybean, suberin, Phytophthora sojae, resistance, fatty acid ω-hydroxylase
I am extremely thankful to my supervisor, Dr. Mark Bernards, for his guidance
and support throughout this project. His constant encouragement made completing this
thesis possible.
Thank you to Dr. Susanne Kohalmi and Dr. Mark Gijzen for sharing their advice
and wisdom. To Susanne who endured long meetings discussing molecular biology and to
Mark who provided both in silico guidance and the soybean seed used in this research.
To the members of my lab and fellow graduate students on the 4th floor of NCB,
thank you for your continual friendship, support, coffee breaks, advice and being there to
listen whenever I had something to celebrate or complain about.
I am deeply thankful to my family for encouraging me throughout my entire
academic career. To my parents whose unconditional love and perspective always made
me believe I could succeed.
Finally, thank you to Albert who was there for me every step of the way. His daily
support helped me get past seemingly impassible obstacles.
...
ABSTRACT iii
...
ACKNOWLEDGEMENTS iv
...
TABLE OF CONTENTS v
...
LIST OF TABLES vii
...
LIST OF FIGURES viii
...
LIST OF APPENDICES x
...
LIST OF ABBREVIATIONS xi
...
CHAPTER 1: INTRODUCTION 1
...
1.1 Soybean 1
1.2 Phytophthora sojae: basic life cycle and infection process ...1
...
1.3 Plant defenses against pathogens 2
...
1.4 Cultivar development 4
...
1.5 Suberin 6
...
1.5.1 The suberin poly(aliphatic) domain (SPAD) 7
...
1.5.2 Fatty acid ω-hydroxylases 9
...
1.5 Rationale of approach 12
...
1.6 Objective of thesis 12
...
CHAPTER 2: MATERIALS AND METHODS 14
2.1 In silico analysis ...14
...
2.2 RNA extraction and DNase digestion 15
...
2.3 DNase digestion of RNA 16
...
2.5 Genomic DNA isolation for PCR optimization 17
...
2.6 Primer design and optimization 18
...
2.7 PCR purification and sequencing 20
2.8 Semi quantitative RT-PCR of putative Gm FAωHs in soybean tissues ...21
...
CHAPTER 3: RESULTS AND DISCUSSION 22
3.1 In silico analysis of putative Gm FAωHs ...22
3.2 In silico expression profiles ...29
...
3.3 Designing gene-specific primers 35
...
3.4 Checking and optimizing primers 38
...
3.5 RT-PCR analysis of tissue-specific gene expression 45
3.6 A role for FAωHs in suberin formation ...51
...
CHAPTER 4: CONCLUSIONS AND FUTURE DIRECTIONS 54
...
BIBLIOGRAPHY 56
...
CURRICULUM VITAE 87
Table 1: Primer sets used for PCR amplification of potential Gm FAωH
...
genes 19
Table 2: Pairwise nucleotide comparisons of putative Gm FAωHs...23
Table 3: Pairwise amino acid comparisons of putative Gm FAωH ...s 27
Table 4: RNA-Seq expression data for the six putative Gm FAωHs ...31
Table 5: EST data for five of the putative Gm FAωHs ...34
Table 6: Characteristics of the Gm FAωH primers designed for
...
RT-PCR 37
Table 7: Tissue expression comparison of the putative Gm FAωHs from
RT-PCR, EST and RNA-Seq data...52
Figure 1: The relationship between preformed whole-root suberin and
partial resistance of soybean to P. sojae ...5
Figure 2: The proposed structure of potato suberin ...8
Figure 3: The ω-hydroxylation of fatty acids ...11
Figure 4: Homology trees of the six putativeGm FAωHs ...25
Figure 5: Amino acid sequence alignment of the related proteins CYP86A1, CYP86A33, CYP86A32, CYP86A9 and the six putative Gm FAωH ...s 28 Figure 6: Phylogenetic tree of the predicted full length amino acid sequence comparison between known CYP86As and CYP94As ... with the six putative Gm FAωHs 30 Figure 7: Nucleotide sequence alignment of the six putative Gm FAωHs...36
Figure 8: Optimizing MgCl2 concentration for PCR amplification of soybean FAωH genes ...39
Figure 9: Optimizing annealing temperature for PCR amplification of soybean FAωH genes ...40
Figure 10: Optimizing cycle number for RT-PCR amplification of soybean FAωH genes ...42
Figure 11: PCR products of each putative Gm FAωH generated from
...
genomic DNA 44
Figure 13: RT-PCR tissue expression of six putative Gm FAωHs using ‘A’
...
samples 47
Figure 14: RT-PCR tissue expression of six putative Gm FAωHs using ‘B’
...
samples 49
Appendix I: Characteristics of soybean pods and seeds used to designate
...
M2 and L1 stages 63
Appendix II: Extended table of RNA-Seq data ...64
Appendix III: Contig maps of assembled soybean ESTs ...65
Appendix IV: Sequence assembly of five of the putative Gm FAωHs and
...
their corresponding sequencing results 68
...
Appendix V: Permission for copyrighted material 86
BLAST - Basic Local Alignment Search Tool
CYP86A - Cytochrome P450 Subfamily 86, type A
EST - Expressed Sequence Tag
Gm FAωH - Glycine max Fatty Acid Omega Hydroxylase
NCBI - National Center for Biotechnology Information
PCR - Polymerase Chain Reaction
RT-PCR - Reverse Transcription Polymerase Chain Reaction
SPAD - Suberin Poly(Aliphatic) Domain
SPPD - Suberin Poly(Phenolic) Domain
SRS - Substrate Recognition Site
Tm - Melting Temperature
UTR - Untranslated Region
CHAPTER 1: INTRODUCTION
1.1 Soybean
Soybean (Glycine max [L.] Merr.), a legume, is one of the most widely harvested
crops in the world. The high protein, high oil beans are used for human consumption,
animal rations and edible oils as well as many industrial products. Soybean production
has experienced an eight-fold increase in Canada since 1976 (Dorff, 2009). In 2006, 1.2
million hectares of soybean were grown in Canada, 73% of which was in Ontario (Dorff,
2009). A substantial cause of soybean yield loss worldwide is root rot, caused by the
pathogen Phytophthora sojae (Kaufmann and Gerdemann) and significant effort has been
expended in improving soybean resistance to this devastating pathogen.
!
1.2 Phytophthora sojae: basic life cycle and infection process
Phytophthora sojae is a soil-borne organism that causes root rot in soybean and is
capable of causing substantial economic loss (Tooley and Grau, 1984; Dorrance et al.,
2003). Phytophthora sojae survives as oospores in soil and plant debris. Oospores can
survive for a number of years in a dormant state, and can withstand freezing and long
periods of cold temperatures. Oospores of P. sojae have endogenous dormancy and not all
will germinate at the same time even when conditions are highly favorable (Tyler, 2007).
Oospores germinate to form mycelia under high soil moisture conditions, and the mycelia
then produce sporangia and motile zoospores under continuous or intermittent saturated
contain isoflavones (specifically daidzein and genestein) and possibly other compounds
secreted from the roots (Zentmyer, 1961; Morris and Ward, 1992; Tyler et al., 1996;
Morris et al., 1998). Once they reach a root, the zoospores lose their flagella, produce a
cell wall (encyst) and germinate (Dorrance et al., 2007). Germ tubes penetrate into the
root by growing through the middle lamellae of the epidermal cells (Tyler, 2007).
Continued growth of hyphae occurs through cortical air spaces with haustoria formation
to facilitate feeding off nearby cells (biotrophic phase). Eventually the endodermis is
breached, allowing the hyphae to colonize the xylem (Enkerli et al., 1997). Herein the
pathogen switches to a necrotrophic growth habit and aggressively attacks the plant.
Phytophthorasojae can spread quickly throughout the plant, causing large, water-soaked,
necrotic lesions containing dead cells. Eventually the root and stem tissues become
completely colonized, and collapse. New oospores are produced within the dead tissue,
and these are returned to the soil as the host plant dies and rots.
1.3 Plant defenses against pathogens
Plants possess multiple types of defenses against pathogens including both
structural and chemical defenses. Structural defenses include waxy epidermal cuticles of
aboveground tissues, suberized bark and suberin depositions in modified cell walls of
underground dermal layers. Chemical defenses mainly consist of secondary metabolites
including terpenoids, phenolics (e.g., isoflavonoids) and alkaloids (Freeman and Beattie,
2008). These chemical defenses have high energy costs and nutrient requirements that are
defenses can be preformed (innate) or inducible. Preformed defenses can be physical
barriers (e.g., cutin, suberin) or secondary metabolites with antimicrobial, antifeedant or
insecticidal properties (Arnason and Bernards, 2010). As an example, phytoanticipins are
antimicrobial compounds that accumulate in plants prior to an attack (Arnason and
Bernards, 2010). Induced defenses can involve the de novo synthesis of secondary
metabolites, activation of preformed metabolites or reinforcement of existing or
deposition of new physical barriers (including new cell wall deposits, lignin and suberin)
(Arnason and Bernards, 2010). One example is the induced formation of phytoalexins,
which are antimicrobial compounds produced only after infection (Hammerschmidt,
1999). Preformed and induced structural and chemical defenses when combined,
comprise the resistance of a plant to a potential pathogen.
In soybean there are two main mechanisms through which resistance to P. sojae is
manifested: race-specific and partial resistance (also called innate resistance, quantitative
resistance, tolerance or field resistance). Race-specific resistance is a gene-for-gene
relationship and fourteen different single resistance genes for resistance against P. sojae
(Rps genes) have been described (Grau et al., 2004). Partial resistance to P. sojae in
soybean is expressed and inherited quantitatively, effective against all the races of the
pathogen, and is exemplified by reduced colonization and slower lesion expansion
(Schmitthenner, 1985; Tyler, 2002; Burnham et al., 2003). In general, partial resistance is
a multi-gene trait that is believed to involve numerous defense components (e.g.,
pre-formed or induced physical barriers, phytoanticipins, phytoalexins, etc.), while
1.4 Cultivar development
Soybean root rot has traditionally been managed by incorporating single gene
resistance against P. sojae into commercial cultivars. However, the pathogen has the
ability to develop new pathotypes that overcome these Rps genes, rendering them
ineffective. This is known as pathotype (or race) shift, and generally, new virulent races
of the pathogen evolve within an 8 to 15 year window (Olah and Schmitthenner, 1985;
Dorrance et al., 2003). The development of new virulent pathogen races in response to
race-specific resistant cultivars has led to recorded failures in disease control
(Schmitthenner, 1985; Kaitany et al., 2001). Consequently, current disease management
recommendations emphasize the use of partial resistance as a more durable strategy to
control P. sojae (St. Martin et al., 1994; Burnham et al., 2003; Dorrance et al., 2003).
Finding additional sources of partial resistance and incorporating this resistance into
commercial cultivars will be essential for effective disease management especially as the
number and complexity of pathotypes of P. sojae continues to increase in areas of
soybean production.
Increased partial resistance may be possible through the enhancement of
pre-existing plant defenses. For example, Thomas et al. (2007) established that a strong
correlation exists between preformed soybean root suberin (especially the poly[aliphatic]
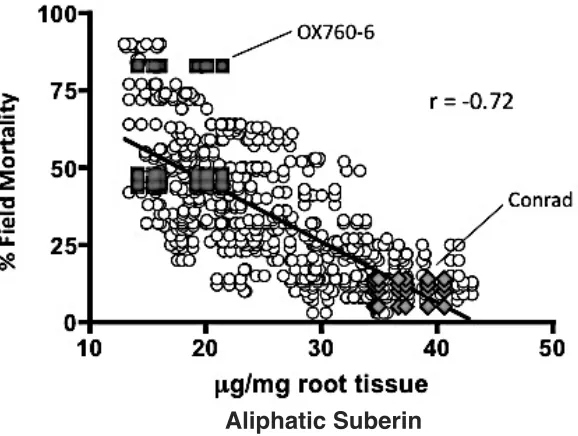
domain [SPAD]) and high levels of partial resistance to P. sojae, (Figure 1). Two
genotypes were studied in detail: ‘Conrad,’ which has a high degree of partial resistance
to P. sojae, and line OX760-6, which is susceptible to this pathogen. Conrad had almost
Figure 1: The relationship between preformed whole-root suberin and partial resistance of
soybean to P. sojae (modified from Thomas et al., 2007). Data obtained for aliphatic
suberin components were plotted against plant mortality data obtained from four
independent plantings of the same recombinant inbred lines at two different field sites
naturally infested with P. sojae. The data for the parental lines ‘Conrad’ (diamonds) and
OX760-6 (squares) are highlighted. (With permission from the American Society of Plant
Biologists.)
endodermal tissues (Thomas et al., 2007). Additionally, it was subsequently shown that P.
sojae progression through soybean roots was significantly slower in Conrad compared
with OX-760-6, primarily due to growth impediment at the epidermal and endodermal
layers of the root (Ranathunge et al., 2008).
These studies suggest that an additional approach to soybean crop protection, in
which levels of preformed suberin are increased through breeding, could provide a
strategy to reduce the extent of P. sojae-mediated root rot in soybean. Furthermore, if
appropriate molecular markers for this trait can be developed and used for progeny
screening, the development time for new cultivars with enhanced partial resistance to P.
sojae could be reduced by up to 3 years relative to conventional selection processes
(Vaino Poysa, personal communication). Thus, it is essential to identify key elements
involved in suberin deposition (especially the poly[aliphatic] component) in order to help
facilitate the development of molecular markers for screening.
1.5 Suberin
! Suberin is a cell wall modification found in specialized cells of plants, particularly
in the epidermis and endodermis of underground components (roots, stolons) (Esau,
1977). It acts as a preformed barrier to pathogens and aids in water retention. Suberin
deposition is induced by wounding, where it serves to seal wounded tissue, preventing
opportunistic pathogens from entering exposed tissue, as well as the loss of water and
nutrients. Suberin is composed of two distinct domains: a poly(phenolic) domain (SPPD)
Bernards, 2002). The SPAD is thought to reside between the cell wall and plasma
membrane, often appearing as repeating lamellae while the SPPD is thought to be in the
cell wall (Bernards, 2002) (Figure 2). Since the SPAD appears to correlate with soybean
partial resistance to P. sojae, its structure and biosynthesis are considered in more detail
below.
1.5.1 The suberin poly(aliphatic) domain (SPAD)
The structure of the polymeric matrix of the SPAD derives from the formation of a
three dimensional matrix of aliphatic monomers cross-linked by ester bonds with glycerol
acting as the linkage between acyl groups (reviewed in Bernards, 2002). The covalently
cross-linked matrix is embedded with waxes, which impart the water retention properties
of the macromolecule. The main structural components of the SPAD are 1-alkanols, ω
-hydroxyalkanoic acids, α,ω-dioic acids, hydroxy-substituted octadecanoates, and glycerol
(Kolattukudy, 1980, 1984; Holloway, 1983; Graça and Pereira,1997). Waxes include fatty
acids, 1-alkanols and alkanes, which are often very long chains (C22-28). The SPAD is
thought to be assembled and deposited on the inner surface of primary walls, and glycerol
is hypothesized to covalently link it to the SPPD (Schmutz et al. 1994; Graça and Pereira
2000). The SPPD is composed mainly of hydroxycinnamic acids, hydroxycinnamoyl
amides, and hydroxycinnamoyl alcohols (Bernards et al, 1995; Negrel et al., 1996;
Kolattukudy, 1980, 1984; Zeier and Schreiber, 1997, 1998; Bernards and Lewis, 1998;
A) B)
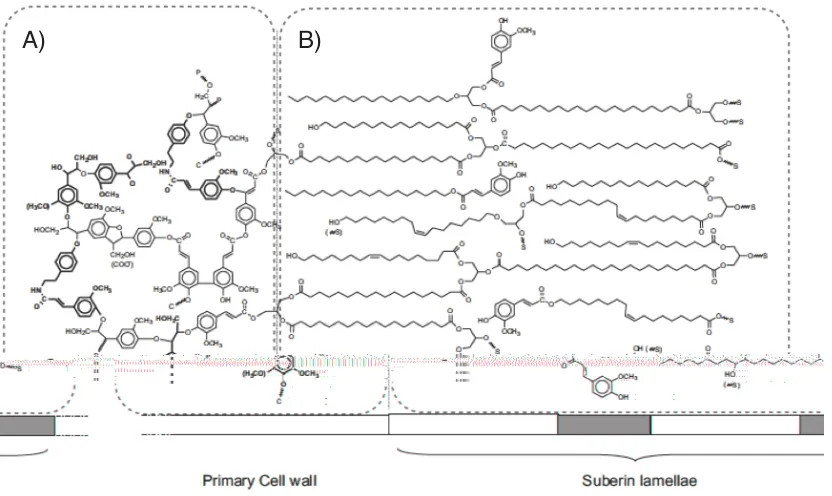
Figure 2: The proposed structure of potato suberin. A) The poly(phenolic) domain (SPPD)
is a part of the primary cell wall and is covalently attached to the cell wall. B) The
poly(aliphatic) domain (SPAD) extends inwards from the primary cell wall in repeating
dark and light bands referred to as the suberin lamellae. P = phenolic, C = carbohydrate, S
The formation of the SPAD involves the modification of fatty acids, including
chain elongation to form very long chain fatty acids, reduction to primary alcohols, or
oxidation to ω-hydroxy fatty acids and α,ω-dioic acids via fatty acid ω-hydroxylation and
subsequent oxidation (Yang and Bernards, 2006).
Fatty acid biosynthesis occurs in the plastid with desaturation occurring before
export into the cytosol (Harwood, 1988). In potato, this step is thought to represent a
“decision making” step in the allocation of carbon to suberin aliphatic monomers because
saturated fatty acids are further generally elongated into very long chain fatty acids at the
endoplasmic reticulum before modification to primary alcohols or alkanes (in the case of
suberin waxes), while desaturated fatty acids are almost exclusively further oxidized to ω
-hydroxy fatty acids and α,ω-dioic acids via fatty acid ω-hydroxylation (Yang and
Bernards, 2006). It is this ω-hydroxylation step that is critical to the structure of the SPAD
because it introduces a second functional group into the main monomers, which allows
them to cross-link into a polymeric matrix.
1.5.2 Fatty acid ω-hydroxylases
The enzymes involved in the oxidation of fatty acids are fatty acid ω
-hydroxylases; these are cytochrome P-450 enzymes that catalyze the terminal carbon
hydroxylation of fatty acids. Cytochrome P-450s are P-450 monooxygenases which are
heme-dependent oxidases that utilize NADPH to reductively cleave atmospheric
dioxygen to produce a functional organic substrate and a molecule of water (Schuler and
NADPH-cytochrome P-450 reductase (Gonzalez and Korzekwa, 1995; Schuler and
Werck-Reichhart, 2003). The reductase is required as it interacts directly with the cytochrome
P-450 enzyme in the transfer of one oxygen atom into a substrate while the other oxygen
atom is reduced to H2O using two electrons from NADPH (Gonzalez and Korzekwa,
1995; De Vetten et al., 1999). The enzyme class is named P-450 because the reduced
carbon monoxide complex that is formed during catalysis absorbs light at 450 nm
(Gonzalez and Korzekwa, 1995). Cytochrome P-450s are typically located in either the
endoplasmic reticulum, the inner mitochondrial membrane, or in chloroplasts (Gonzalez
and Korzekwa, 1995).
In plants, multiple cytochrome P-450 subfamilies have been identified as ω
-hydroxylases: including CYP86A and CYP94A (Duan and Schuler, 2005), CYP86B
(Compagnon et al., 2009) and CYP704B (Dobritsa et al., 2009; Li et al., 2010). Members
of the CYP94A subfamily catalyze the initial ω-hydroxylation as well as subsequent
oxidation of the ω-hydroxy fatty acid to the corresponding dioic acid (Figure 3). The
CYP86A subfamily has been described in Arabidopsis thaliana (Duan and Schuler, 2005;
Rupasinghe et al., 2007) and CYP86A1 has been shown to be a functional ω-hydroxylase
involved in suberin monomer biosynthesis (Hofer et al., 2008). In Solanum tuberosum,
CYP86A33 was shown to be involved in suberin biosynthesis through RNAi knock-down
experiments, where the loss of function resulted in the alteration of suberin composition,
and an impairment of the periderm’s barrier to water (Serra et al., 2009). The ω
-hydroxylase(s) of soybean have not been described in the literature. Due to the inherent
Figure 3: The ω-hydroxylation of fatty acids. The ω-hydroxylation of fatty acids by two
cytochrome P-450 subfamilies: CYP86A and CYP94A. Members of the CYP86A
subfamily catalyze the ω-hydroxylation of fatty acids. Members of the CYP94A
subfamily catalyze the ω-hydroxylation as well as the subsequent oxidation of the
membrane association, traditional protein purification approaches are not feasible for
their characterization. Therefore, a molecular biology approach may make the
characterization of soybean ω-hydroxylases more feasible. This approach has been made
more accessible through the recent completion and annotation of the soybean genome
(Schmutz et al., 2010).
1.5 Rationale of approach
Since aliphatic suberin in soybean root correlates to partial resistance to P. sojae,
suberin is an excellent target for study in the improvement of soybean innate resistance to
P. sojae. Furthermore, ω-hydroxylases (specifically CYP86As) are vital to the
composition of the aliphatic domain of suberin in other plant species (especially
Arabidopsis and potato). Therefore, the characterization of this subfamily of genes in
soybean will be essential to our understanding of suberin deposition in soybean roots.
This characterization will not only aid in potential molecular marker development for
breeding selection, but will allow further understanding of the suberin/resistance
relationship. It will also provide a possible mechanism for altering suberin composition to
study the effects on P. sojae’s ability to infect soybean roots.
1.6 Objective of thesis
The objective of the research in this thesis is to identify potential CYP86A genes
in soybean and establish their tissue expression profiles. Since CYP86A proteins are
unreliable. Therefore, a molecular biological approach will be used. Initially, an in silico
approach will be used to identify potential candidate CYP86A genes from the soybean
genome (Schmutz et al., 2010). Unique primers will then be designed for each gene, and
the expression patterns of the putative CYP86A genes will be analyzed in various
soybean tissues. This PCR-mediated expression data will be compared to existing EST
(various public EST databases) and RNA-Seq (soybase.org) expression data available for
CHAPTER 2: MATERIALS AND METHODS
2.1 In silico analysis
Sequences of characterized fatty acid ω-hydroxylases (FAωHs) from Arabidopsis
thaliana (CYP86A1, accession #: NM_125276) and Solanum tuberosum (CYP86A33,
accession #: EU293405) were used in a Basic Local Alignment Search Tool (BLAST)
search of the soybean genome databases Phytozome.net and compbio.dfci.harvard.edu
(Gene Index). Multiple sequence alignments of the putative genes and known CYP86As
were performed in DNAMAN to show similarities. CYP86A substrate recognition sites
(SRSs) were identified in accordance with Rupasinghe et al. (2007). A phylogenetic tree
with 100 bootstrap trials was generated to show the putative genes relationships to each
other and to known CYP86As and CYP94As. RNA-Seq and expressed sequence tag
(EST) data were utilized to gain insight into the tissue expression patterns of the six
putative fatty acid ω-hydroxylases. RNA-Seq data for the six genes was compiled from
the atlas at Soybase.org. In collaboration with Dr. Martina Stromvick (McGill
University), existing EST data was assembled and analyzed using the software Phrap (P.
Green, University of Washington, Seattle, http://www.phrap.org/). Additionally, probe sets
that represent the putative soybean FAωHs on the Affymetrix soy chip were identified via
2.2 RNA extraction and DNase digestion
All steps involving handling of RNA were done using RNase-free methods. This
included creating an RNase-free zone on the bench top using RNaseZap, using distinct
RNase-free microcentrifuge tubes and barrier tips, baking the mortar and pestle at 250°F
overnight and frequently changing gloves. In order to isolate RNA, seeds of the Conrad
cultivar were grown in the University of Western Ontario greenhouse in Pro-Mix soil.
Seeds and pods of the M2 and L1 stages were obtained from Agriculture and Agri-Food
Canada (Southern Crop Protection and Food Research Centre, London, ON, Canada)
(Appendix I). The QIAGEN RNeasy Plant Mini Kit was used to isolate RNA from 9
distinct tissues: old leaf (> 14 days post germination), young leaf (< 10 days old), stem,
flower, M2 (29-35 days post anthesis) and L1 (35-43 days post anthesis) stage pods, M2
and L1 stage seeds, and root. In order to perform a biological replicate, all tissue types
(except seed and pod) were collected from two different pots containing multiple soybean
plants (‘A’ and ‘B’). These plants were all grown in the same environment and plants
within a pot were grouped. Seed and pod tissue samples were separated into two groups
after being collected in the field. Between 70 and 90 mg of fresh weight of each tissue
was used. Tissue was frozen in liquid nitrogen, ground with a mortar and pestle, and
transferred to a RNase-free, liquid nitrogen cooled microcentrifuge tube. Once the liquid
nitrogen had evaporated, 450 µL of Buffer RLT was added, and the sample vortexed
vigorously and incubated at 56°C for 3 minutes in a water bath to help disrupt the tissue.
The lysate was transferred to a QIAshredder spin column and centrifuged for 2 minutes at
carefully transferred to a new microcentrifuge tube and mixed with 0.5 volumes of
ethanol (96-100%). The sample was then added to an RNeasy spin column and
centrifuged for 15 seconds at 8,000 x g. The flow-through was discarded and 700 µL of
Buffer RW1 was added before centrifuging for 15 seconds at 8,000 x g. After discarding
the flow-through, 500 µL of Buffer RPE was added and the sample centrifuged for 15
seconds at 8,000 x g. Once again the flow-through was discarded and 500 µL of Buffer
RPE was added and the sample centrifuged for 2 minutes at 8,000 x g. To eliminate
possible carryover of Buffer RPE, the column was centrifuged for an additional minute at
full speed. The column was then placed in a clean microcentrifuge tube and the RNA was
eluted by adding 30-50 µL of RNase-free H2O, letting it sit for 5 minutes and then
centrifuging for 1 minute at 8,000 x g. In tissues where the RNA yield was lower, the
eluate was re-added to the column and centrifuged for an additional minute at 8,000 x g.
2.3 DNase digestion of RNA
All steps involving handling of RNA were done using RNase-free methods as
previously described. Prior to generation of cDNA, the RNA samples were treated with
DNase to digest contaminating DNA by following the QIAGEN RNeasy Plant Mini Kit
protocol. Briefly, each RNA sample was mixed with 10 µL of Buffer RDD, 2.5 µL DNase
I and RNase-free H2O to a final volume of 100 µL. After incubating on the bench top for
10 minutes the QIAGEN RNeasy Plant Mini Kit RNA cleanup protocol was used. To the
newly digested sample, 350 µL of Buffer RLT was added. After mixing the reaction, 250
added to a RNeasy spin column and centrifuged for 15 seconds at 8,000 x g. After
discarding the flow-through, 500 µL of Buffer RPE was added and the sample was
centrifuged at 8,000 x g for 15 seconds. Once again the flow-through was discarded, 500
µL of Buffer RPE was added and the sample was centrifuged at 8,000 x g for 2 minutes.
In order to eliminate residual Buffer RPE, the column was subsequently centrifuged at
high speed (17,000 x g) for 1 minute. The column was placed in a clean microcentrifuge
tube and the RNA was eluted by adding 40 µL of RNase-free H2O, letting it sit for 5
minutes and then centrifuging for 1 minute at 8,000 x g.
2.4 Generation of cDNA from isolated RNA
All steps involving handling of RNA were done using RNase-free methods as
previously described. To prepare cDNA, 2.5 µg of RNA was combined with 1 µL Oligo
dT (0.5 µg/µL), 1 µL dNTPs (10 mM) and Milli-Q® H2O to a final volume of 12 µL and
heated at 65°C for 5 minutes. The mixture was cooled on ice for 2 minutes and then 4 µL
5X First Strand buffer, 2 µL DTT (0.1 M) and 1 µL RNase Inhibitor (10 units) were
added. After heating the mixture at 42°C for 2 minutes, 1 µL SuperScript Reverse
Transcriptase (200 units) was added. The mixture was incubated at 42°C for 50 minutes
and then the SuperScript Reverse Transcriptase was inactivated at 70°C for 15 minutes.
2.5 Genomic DNA isolation for PCR optimization
In order to optimize PCR conditions for each gene-specific primer set, genomic
Ammonium Bromide) protocol (modified from Kang and Yang, 2004). An extraction
buffer (1.4 M NaCl, 100 mM Tris-HCl pH 8.0, 20 mM EDTA pH 8.0 and 2% CTAB) was
heated to 65°C with 0.2% v/v β-mercaptoethanol and 2 µL of RNase A per 600 µL
aliquot. Plant tissue was ground in a mortar using a pestle and liquid nitrogen.
Approximately 200 mg of ground tissue was resuspended in 600 µL of the preheated
extraction buffer and incubated at 65°C. After an hour, 600 µL of
Chloroform:Isoamyalcohol (24:1) was added and the mixture vortexed before
centrifugation at 10,000 x g for 12 minutes. The top liquid phase was transferred to a
clean microcentrifuge tube and 0.7 volumes of isopropanol was added in order to
precipitate the DNA. The mixture was cooled at 4°C for 30 minutes and then centrifuged
at 10,000 x g for 20 minutes at 4°C. After the supernatant was discarded, the pellet was
washed with ice cold ethanol (70%) and centrifuged at 10,000 x g for 5 minutes. The
pellet was then dried completely using an aspirator and resuspended in 50 µL of Milli-Q®
H2O.
2.6 Primer design and optimization
Primers were designed to unique regions in the 5’ and 3’ untranslated regions
(UTRs) of the six putative Gm FAωHs (Table 1). Genomic DNA was used as the template
to determine the optimal salt concentration, annealing temperature and cycle number for
each primer pair. Salt concentration was optimized for each primer set by running PCR at
48°C, for 33 cycles and a range of different MgCl2 concentrations (1.25 - 5.00 mM
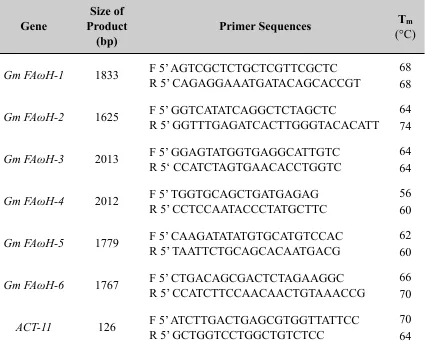
Table 1: Primer sets used for PCR amplification of potential Gm FAωH genes. The
ACT-11 primer sequences were obtained from Hu et al. (2009). F = forward and R =
reverse. The sizes of the products (bp) are based on using cDNA. Tm = (wA+xT)*2 + (yG
+zC)*4 where wA,xT,yG and zC are the number of the A, T, G and C nucleotide bases in the
sequence, respectively.
Gene
Size of Product
(bp)
Primer Sequences Tm
(°C)
Gm FAωH-1 1833 F 5’ AGTCGCTCTGCTCGTTCGCTC R 5’ CAGAGGAAATGATACAGCACCGT
68 68
Gm FAωH-2 1625 F 5’ GGTCATATCAGGCTCTAGCTC
R 5’ GGTTTGAGATCACTTGGGTACACATT 64 74
Gm FAωH-3 2013 F 5’ GGAGTATGGTGAGGCATTGTC R 5‘ CCATCTAGTGAACACCTGGTC
64 64
Gm FAωH-4 2012 F 5’ TGGTGCAGCTGATGAGAG R 5’ CCTCCAATACCCTATGCTTC
56 60
Gm FAωH-5 1779 F 5’ CAAGATATATGTGCATGTCCAC R 5’ TAATTCTGCAGCACAATGACG
62 60
Gm FAωH-6 1767 F 5’ CTGACAGCGACTCTAGAAGGC R 5’ CCATCTTCCAACAACTGTAAACCG
66 70
ACT-11 126 F 5’ ATCTTGACTGAGCGTGGTTATTCC R 5’ GCTGGTCCTGGCTGTCTCC
temperature was increased to find one that yielded a single band of expected size. Cycle
number was determined by removing PCR samples after a certain number of cycles (17,
19, 21, 23, 25, 27, 29, 31, 33, and 35 cycles) and analyzing them on a 1% agarose gel.
The relative brightness of the bands was determined using BioRad Quantity One Software
Version 4.5.1. The cycle numbers were plotted against the intensity of the bands on the
gel, and a cycle in the middle of the exponential phase was chosen. In order to check the
specificity of the primers, each primer pair was checked with genomic DNA using the
optimal salt and temperature determined by the above process.
2.7 PCR purification and sequencing
The PCR products generated using optimized salt concentration and annealing
temperature with genomic DNA as the template were run on a 1% agarose gel and stained
with ethidium bromide to check for specificity. The gels were visualized on a Bio-Rad
Gel Doc (Universal Hood II, S76S/01511). PCR reaction products for each putative Gm
FAωH were purified for sequencing using a QIAGEN QIAquick PCR Purification Kit as
per the manufacturer’s instructions. Five volumes of Buffer PB were added to 1 volume
of the PCR sample and mixed (1 volume = 100 µL). The mixture was added to a
QIAquick Spin column and centrifuged for 1 minute at 15,000 x g. After the flow-through
was discarded, 750 µL of Buffer QG was added to the column and the sample was
centrifuged at 15,000 x g for 1 minute. After the flow-through was discarded again, the
column was re-centrifuged for 1 minute at 15,000 x g to remove all traces of ethanol. The
µL of Buffer EB (10 mM Tris-Cl, pH 8.5), letting the column sit for 5 minutes and then
centrifuging for 1 minute at 15,000 x g. The purified PCR reactions were sent to Robarts
Research for sequencing via the Big Dye Terminator (BDT) v3.1 from Applied
Biosystems, followed by purification via Sephadex spin using Pall Scientific Filter plates
and GS 50 Sephadex. The purified samples were loaded onto the Applied Biosystems
3730 DNA Analyzer, and the data analyzed using Sequence Analysis Software v 5.2 from
Applied Biosystems.
2.8 Semi quantitative RT-PCR of putative Gm FAωHs in soybean tissues
The optimal PCR amplification conditions (Section 2.6) were used to determine
the tissue expression of the 6 putative Gm FAωH genes in RNA extracts from 9 different
tissues: root, flower, M2 and L1 stage seeds, M2 and L1 stage pods, stem, old leaf, and
young leaf. PCR was run using the six primer pairs and ACT-11 primers (94°C 4 min.;
21-33 cycles of [94°C 50 sec., 56-67°C 50 sec., 72°C 2 min.]; 72°C 10 min., 4°C ∞) and
the products were run on a 1% agarose gel and stained with ethidium bromide. The gels
were visualized on a Bio-Rad Gel Doc (Universal Hood II, S76S/01511) for qualitative
CHAPTER 3: RESULTS AND DISCUSSION
3.1 In silico analysis of putative Gm FAωHs
Initial in silico analysis revealed a putative soybean ω-hydroxylase, CYP86A24
(Gm FAωH-1), which had been tagged due to its high identity with known CYP86As but
never further characterized (Li and Yu, unpublished data). When a BLAST search was
performed using the sequence of Gm FAωH-1 against the soybean genome, five
additional genes with high sequence similarity were found. These putative soybean ω
-hydroxylases were named in terms of their decreasing identity to Gm FAωH-1 (Table 2).
A high number of genes was expected because of the palaeopolyploidic nature of the
soybean genome (Schmutz et al., 2010).
The six putative Gm FAωHs are scattered over six of the twenty soybean
chromosomes. As indicated by their genomic locus numbers (Glyma08g01890,
G l y m a 0 5 g 3 7 7 0 0 , G l y m a 0 3 g 0 1 0 5 0 , G l y m a 0 7 g 0 7 5 6 0 , G l y m a 1 4 g 3 7 1 3 0 ,
Glyma11g26500), Gm FAωH-1 is located on the very top of chromosome 8, Gm FAωH-2
is located very close to the bottom of chromosome 5, Gm FAωH-3 is located on the very
top of chromosome 3, Gm FAωH-4 is located on the top arm of chromosome 7, Gm
FAωH-5 is located near the bottom of chromosome 14 and Gm FAωH-6 is located on the
lower arm of chromosome 11. The distribution of the genes amongst various
chromosomes is consistent with that observed for the A. thaliana CYP86A subfamily
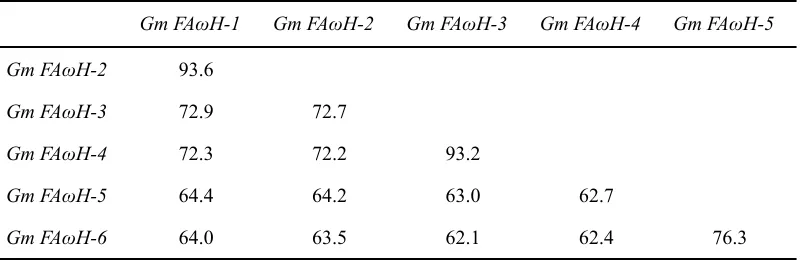
Table 2: Pairwise nucleotide comparisons of putative Gm FAωHs. The percent nucleotide
identity between the six putative Gm FAωHs is shown. Analysis done in DNAMAN.
Gm FAωH-1 Gm FAωH-2 Gm FAωH-3 Gm FAωH-4 Gm FAωH-5
Gm FAωH-2 93.6
Gm FAωH-3 72.9 72.7
Gm FAωH-4 72.3 72.2 93.2
Gm FAωH-5 64.4 64.2 63.0 62.7
Comparisons conducted at the nucleotide level indicate that these genes have very
different structural organizations, with Gm FAωH-1 having a single intron interrupting the
coding sequence at position -90 nucleotides (nt) (relative to ATG; i.e., in the 5’ UTR), Gm
FAωH-5 having a single intron interrupting the coding sequence at position 675 nt
(relative to ATG), Gm FAωH-6 having two introns interrupting the coding sequence at
positions 675 nt and 1523 nt (relative to ATG) and Gm FAωH-2, Gm FAωH-3 and Gm
FAωH-4 having no introns. The intron of Gm FAωH-5 and first intron of Gm FAωH-6 are
relatively large (816 nt and 855 nt, respectively) and are 42.7% identical to one another.
The intron of Gm FAωH-1 (356 nt) and the second intron of Gm FAωH-6 (148 nt) are
smaller and, except for the splice-site junctions, no significant matches exist between
these introns and the larger ones. As indicated in homology trees generated for the six
putative Gm FAωH’s (Figure 4), they group into three pairs with, Gm FAωH-1 and Gm
FAωH-2, Gm FAωH-3 and Gm FAωH-4, and Gm FAωH-5 and Gm FAωH-6 grouping
together. Pairwise comparisons between these sequences indicate that Gm FAωH-1 and
Gm FAωH-2 have the highest degree of nucleotide identity within their coding sequence
(93.6%) (Table 2). Gm FAωH-3 and Gm FAωH-4 have the same degree of identity with
Gm FAωH-1 (72.9% and 72.3%, respectively) as well as a high degree of identity with
each other (93.2%). Gm FAωH-5 and Gm FAωH-6 have the lowest degree of identity with
Gm FAωH-1 (64.4% and 64.0%, respectively) as well as the lowest degree of identity
within their pairing (76.3%).
Pairwise comparisons conducted at the protein level indicate that these proteins
Figure 4: Homology trees of the six putativeGm FAωHs. Trees showing percent identity
of A) nucleotide sequence of coding region and B) full length predicted amino acid
derived relationships as seen at the nucleotide level (Table 3). Gm FAωH-3 and Gm
FAωH-4 have the highest degree of sequence identity (95.9%),withGm FAωH-1 and Gm
FAωH-2 similarly identical (95.8%). Gm FAωH-5 and Gm FAωH-6 have lower similarity
to each other (78.7%) and with the four other putative Gm FAωHs (63.3% - 65.3%).
Since the six putative Gm FAωHs have >55% amino acid sequence identity they are
likely part of the same subfamily of genes.These peptides differ in their number of amino
acids, ranging from 508 (Gm FAωH-6), 520 (Gm FAωH-5), 528 (Gm FAωH-1 and Gm
FAωH-2), and 532 (Gm FAωH-4), to 533 (Gm FAωH-3). Alignments at the primary
sequence level indicate that nearly all of these length differences exist at the C terminus,
with Gm FAωH-5 extending 12 residues, Gm FAωH-2 extending 20 residues, Gm
FAωH-1 extending 21 residues and Gm FAωH-3 and Gm FAωH-4 extending 24 residues
beyond the termination point of Gm FAωH-6 (Figure 5). Based on secondary structure
prediction in DNAMAN, these extensions form random coil structures extending from the
external surface of these proteins.
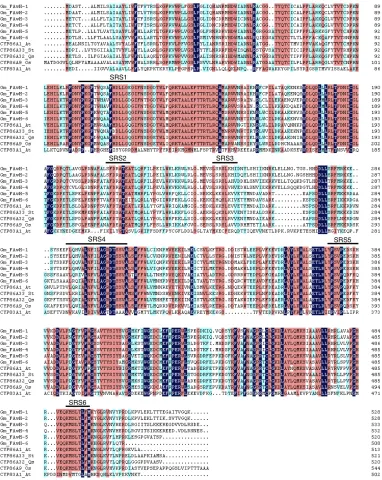
The six putative Gm FAωHs were aligned with other CYP86A proteins, including
one that has been demonstrated to be a FAωH (CYP86A1 in A. thaliana) (Figure 5). This
alignment revealed a high degree of conservation in the putative substrate recognition
sites defined for CYP86As (Rupasinghe et al., 2007) between the six putative Gm FAωHs
and confirmed CYP86As. All six putative Gm FAωHs are nearly identical in SRS1,
SRS4, SRS5 and SRS6, more variable in SRS2, and most variable in SRS3 (Figure 5).
These substrate recognition sites are thought to contribute to defining catalytic site
Table 3: Pairwise amino acid comparisons of putative Gm FAωHs. The percent amino
acid identity between the six putative Gm FAωHs is shown. Analysis done in DNAMAN.
Gm FAωH-1 Gm FAωH-2 Gm FAωH-3 Gm FAωH-4 Gm FAωH-5
Gm FAωH-2 95.8
Gm FAωH-3 75.7 75.3
Gm FAωH-4 75.5 75.1 95.9
Gm FAωH-5 65.0 64.5 64.8 65.0
Figure 5: Amino acid sequence alignment of the related proteins CYP86A1, CYP86A33,
CYP86A32, CYP86A9 and the six putative Gm FAωHs. Amino acids that are identical,
>=75% similar or >=50% similar are shaded in dark blue, red or light blue, respectively.
Putative substrate recognition sites are underlined (Rupasinghe et al., 2007).
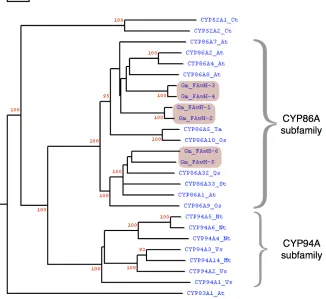
A rooted phylogenetic tree of potentially orthologous fatty acid ω-hydroxylases
from different organisms was constructed based on multiple sequence alignments (Figure
6). Included in this comparison were fatty acid ω-hydroxylases known to exist in plants,
including both the CYP86A and CYP94A subgroups. Notably, Gm FAωH-5 and Gm
FAωH-6 are the closest of the putative Gm FAωHs to align with CYP86A1 from A.
thaliana, a known fatty acid ω-hydroxylase. The similarities between the six sequences
and where they fall in the phylogenetic tree with other known CYP86As suggests that
they are all CYP86As.
3.2 In silico expression profiles
Existing in silico information was utilized to gain insight into the tissue expression
patterns of the six putative Gm FAωHs. This information came from RNA-Seq
(Soybase.org) and EST (various public EST databases) data available for the six putative
Gm FAωHs. In addition, soybean microarray data was accessed.
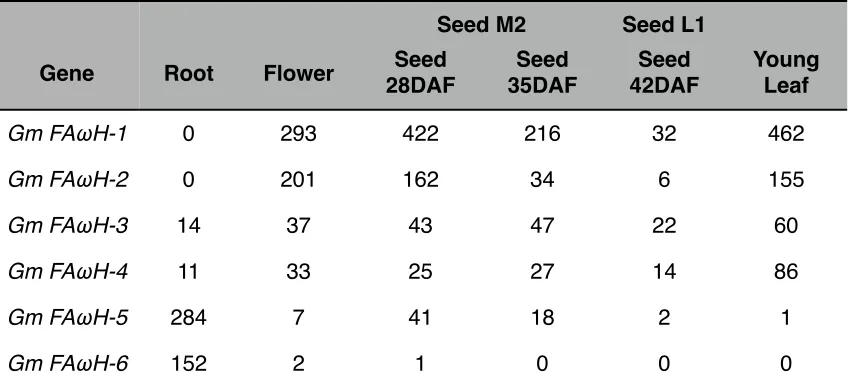
RNA-Seq data was compiled from the atlas at Soybase.org (Table 4; Appendix II).
This RNA sequencing data (RNA-Seq) was derived from high throughput sequencing of
total RNA isolated from various soybean tissues at different developmental stages. The
sequences obtained were then mapped to the soybean genome for identification (Severin
et al., 2010). This unbiased, broad-based sequencing of the transcriptome allowed for an
in silico examination of the tissue expression for all six putative Gm FAωHs. It indicated
that all six putative Gm FAωHs were expressed, albeit in different tissues. For example,
Figure 6: Phylogenetic tree of the predicted full length amino acid sequence comparison
between known CYP86As and CYP94As with the six putative Gm FAωHs. Bootstrapped
values indicating the level of significance (%) by the separation of the branches are
shown in red. The branch length indicates the extent of the difference according to the
scale at the top. The alignment used to construct the tree was performed in DNAMAN
using ClustalW. CYP83A1_At is used as an outgroup. All sequences were obtained from
NCBI. At: Arabidopsis thaliana; Ct: Candida tropicalis; Gm: Glycine max; Mt: Meticago
truncatula; Nt: Nicotiana tabacum; Os: Oryza sativa; Qs: Quercus suber; St: Solanum
Table 4: RNA-Seq expression data for the six putative Gm FAωHs. The raw data for the
gene expression counts for the uniquely mappable reads are presented. The tissues
included match those used in this study for RT-PCR verification. A more comprehensive
table of RNA-Seq data, including several additional tissue types and developmental
stages, is presented in Appendix II. DAF = days after flowering. Data were obtained from
Soybase.org/soyseq.
Seed M2
Seed M2 Seed L1
Gene Root Flower 28DAFSeed 35DAFSeed 42DAFSeed Young Leaf
Gm FAωH-1 0 293 422 216 32 462
Gm FAωH-2 0 201 162 34 6 155
Gm FAωH-3 14 37 43 47 22 60
Gm FAωH-4 11 33 25 27 14 86
Gm FAωH-5 284 7 41 18 2 1
and to a lesser extent in flower and L1 stage seeds. Gm FAωH-2 was shown to be most
expressed in flower, M2 stage seeds and young leaves. Gm FAωH-3 and 4 had similar,
and relatively low expression in young leaves, seeds at the M2 and L1 stage, and flowers.
Gm FAωH-5 and 6 showed the least diverse expression with root being the tissue with the
highest expression for both, while Gm FAωH-5 also showed some expression in M2 stage
seeds. An extended table of RNA-Seq data (Appendix II) indicates that the highest
expression for Gm FAωH-1 (over 700) was observed for pods that were younger than the
M2 stage. Also, Gm FAωH-6 showed high expression (916) in nodules. Neither of these
tissues were represented in our RT-PCR tissue expression analysis (Section 3.5). On the
whole, these expression numbers are relatively low for RNA-Seq data (where a highly
expressed gene is two orders of magnitude higher), and may be due to the high sequence
identity between the six putative Gm FAωH genes. Previous studies have indicated the
potential for under-representing the total number of counts for genes within closely
related gene families as short read sequences that map to multiple locations in a genome
are largely discarded (Mortazavi et al., 2008).
Since Gm FAωH-1 was the only soybean FAωH annotated in the NCBI Unigene
database, M.A. Bernards and I collaborated with Dr. Martina Stromvick (McGill
University) in order to make use of existing expressed sequence tag (EST) data more
fully. ESTs that corresponded with a putative Gm FAωH were assembled into contiguous
sequences (contigs) with the software Phrap (P. Green, University of Washington, Seattle,
http://www.phrap.org/). This allowed for a more extensive in silico tissue expression
III) which represented five out of the six Gm FAωHs. Gm FAωH-1, Gm FAωH-2, Gm
FAωH-3 and Gm FAωH-5 were represented by two contigs each, while Gm FAωH-4 was
represented by 3 contigs. Gm FAωH-6 was not represented in any of the EST data. In
order to establish the tissue-specific expression of each of the five Gm FAωH genes
represented in the data, the origin of each library used to generate the EST data was
compiled from NCBI (Table 5). In general, the majority of ESTs were from libraries
generated from seeds, though ESTs from root, flowers, pods, stems and other tissues were
also available (Table 5). Overall, Gm FAωH-1 was found to be expressed in a variety of
tissues, while Gm FAωH-3, Gm FAωH-4 and Gm FAωH-5 had EST representation in
libraries from seed only. Most ESTs of Gm FAωH-2 were found in libraries from seed, but
a couple were also found in libraries constructed from flowers. While the EST data for
Gm FAωH-1 matched that of the expression profile from Unigene, the fact that a large
number of ESTs were from libraries that were generated from whole soybean plant tissue
meant that there was limited tissue expression data. In general, the expression profiles
predicted by source-cDNA library EST analysis showed corresponding and opposing
expression patterns, compared to RNA-Seq, for all six genes. For example, RNA-Seq
analysis showed high expression of Gm FAωH-5 and Gm FAωH-6 in root tissue, while
analysis of EST data only showed a role of Gm FAωH-1 in this tissue. This variation in
root expression data emphasizes the need for RT-PCR-based verification of gene specific
expression (Section 3.5).
Soybean microarray data is readily available. Four of the putative Gm FAωHs are
Table 5: EST data for five of the putative Gm FAωHs. A raw count of the number of ESTs
generated from libraries from various tissues corresponding to those used in this study is
presented. Contigs were assembled from source cDNA libraries and the frequency of
occurrence in various tissues established.
Gene Root Flower Seed Pod Stem Leaf Other*
Gm FAωH-1 2 8 4 3 1 3 25
Gm FAωH-2 0 2 16 0 0 0 12
Gm FAωH-3 0 0 7 0 0 0 1
Gm FAωH-4 0 0 19 0 0 0 1
Gm FAωH-5 0 0 23 0 0 0 0
*Includes EST libraries generated from whole plants, multiple tissues and other tissues
FAωH-1 and Gm FAωH-2 are both represented by Gma.11025.1.S1_at and GmaAffx.
49459.1.A1_at and Gm FAωH-3 and Gm FAωH-4 are both represented by Gma.
13695.1.A1_at. Since these probe sets correspond to more than one gene, the microarray
data for these four genes is not reliable.
3.3 Designing gene-specific primers
To determine tissue expression for each Gm FAωH gene in vitro, unique
gene-specific primers were designed. Due to the Gm FAωH genes having high identity in their
coding region (Table 2), primers were designed to the 5’ and 3’ UTRs (Figure 7). An
alignment was performed in DNAMAN to find regions of low identity amongst the six
Gm FAωH genes. Sequences ranging from 18 - 26 base pairs (bp) were chosen because
this length is long enough for adequate specificity and short enough for primers to bind
easily to the template at the annealing temperature (Table 6). The primers were designed
within 363 bp of the start codon in the 5’ UTR and within 100 bp of the stop codon in the
3‘UTR (Figure 7, Table 6). By necessity, the Gm FAωH-2 reverse primer is very close to
the stop codon albeit still within the coding sequence. The G/C content of each primer
was kept between 40.9 - 61.9% (Table 6), which allowed for enough annealing strength
(G-C base pairs have three hydrogen bonds) while keeping the melting temperature (Tm)
at a favorable level (Li et al., 1997). The Tm is the temperature at which one half of the
DNA duplex will dissociate to become single stranded (Rychlik et al., 1990). Single base
pair modifications were incorporated within primers, as required, to ensure (1) no self
Figure 7: Nucleotide sequence alignment of the six putative Gm FAωHs. Nucleotides that
are identical, >=75% similar or >=50% similar are shaded in dark blue, red or light blue,
respectively. Forward primers are indicated by red boxes and reverse primers by blue
Table 6: Characteristics of the Gm FAωH primers designed for RT-PCR. The length,
distance from the coding region and G/C content are indicated for each primer. FOR =
forward and REV = reverse.
Primer Length
(bp)
Distance From Coding Region*
(bp)
G/C Content (%)
Gm FAωH-1 FOR 21 102 61.9
Gm FAωH-1 REV 23 100 47.8
Gm FAωH-2 FOR 21 70 52.4
Gm FAωH-2 REV 26 53** 42.3
Gm FAωH-3 FOR 21 363 52.4
Gm FAωH-3 REV 21 7 52.4
Gm FAωH-4 FOR 18 358 55.6
Gm FAωH-4 REV 20 17 50.0
Gm FAωH-5 FOR 22 160 40.9
Gm FAωH-5 REV 21 14 42.9
Gm FAωH-6 FOR 21 143 57.1
Gm FAωH-6 REV 24 52 45.8
*The forward primers are shown as base pairs upstream from the start codon and the
reverse primers are shown as downstream from the stop codon.
sets and (3) that Tm’s were kept within 10°C for primer pairs. To ensure specificity to each
gene, final primer sequences were “BLASTed” against the soybean genome.
3.4 Checking and optimizing primers
Primers were optimized and checked for specificity. Genomic DNA was used to
establish optimal salt (MgCl2) and temperature conditions. Magnesium is a required
cofactor for thermostable DNA polymerases (Chien et al., 1976). Excess Mg2+ in the
reaction can increase non-specific primer binding and increase the non-specific
background of the reaction (Williams, 1989). Therefore, Mg2+ concentration is important
for controlling the specificity of the annealing reaction. In order to find the optimal salt
concentration for each primer set, PCR was run at a low temperature, high cycle number
and a range of different MgCl2 concentrations (Figure 8a). Salt concentrations with high
clarity were chosen for each primer set, including the housekeeping gene actin, ACT-11
(Figure 8b). The primers worked best at a range of salt concentrations (2.50 - 4.78 mM).
The annealing temperature was also optimized for specificity. Using the Tm
calculated for each primer as a guide (lowest Tm per primer pair minus 5°C), each primer
set was tested in vitro for the optimal annealing temperature to ensure maximum
specificity (Figure 9). A temperature that is neither too low nor too high is ideal. A
consequence of having an annealing temperature too low is that one or both primers will
anneal to sequences other than the true target, as internal single-base mismatches or
partial annealing may be permitted (Rychlik et al., 1990). This can lead to nonspecific
1.25 1.88 2.50 3.13 3.75 4.38 5.00 M
mM MgCl2 A)
Gene MgCl2(mM)
Gm FAωH-1 4.38
Gm FAωH-2 4.38
Gm FAωH-3 3.13
Gm FAωH-4 2.50
Gm FAωH-5 3.13
Gm FAωH-6 3.75
ACT-11 4.78
B)
2.5 kb 3.0 kb
Figure 8: Optimizing MgCl2 concentration for PCR amplification of soybean FAωH
genes. A) 1% agarose gel showing PCR products generated using a range of MgCl2
concentrations for Gm FAωH-5. Labels across the top indicate MgCl2 concentration in
mM. The arrow shows the expected product band and the black box denotes the chosen
concentration. Select bands are labeled in the 10 kb ladder lane (M). B) The chosen
MgCl2 concentration for each of the six putative Gm FAωHs and the positive control,
49.1 50.1 51.5 53.6 55.6 57.6 59.1 M
Temperature °C
Gene Temp(°C)
Gm FAωH-1 57
Gm FAωH-2 62
Gm FAωH-3 65
Gm FAωH-4 56
Gm FAωH-5 59
Gm FAωH-6 67
ACT-11 64
B) A)
3.0 kb 2.5 kb
Figure 9: Optimizing annealing temperature for PCR amplification of soybean FAωH
genes. A) 1% agarose gel showing PCR products generated using increasing temperature
for Gm FAωH-5. Labels across the top indicate annealing temperature in °C. The black
box shows the chosen temperature. Select bands are labeled in the 10 kb ladder lane (M).
B) The chosen annealing temperature for each of the six putative Gm FAωHs and the
1990). Conversely, too high an annealing temperature may yield little product, as the
likelihood of primer annealing is reduced (Rychlik et al., 1990). For each primer set,
including the housekeeping gene actin (ACT-11), the highest temperature that generated a
band was chosen (Figure 9b). The reason for this was the observation that in many cases
secondary bands were observed even when a seemingly high temperature was used when
cDNA was used as the template (data not shown).
To enable semi-quantitative RT-PCR, the cycle number for each primer pair was
chosen within the exponential phase of band intensity. This is because PCR amplification
is not logarithmic at a low or high number of amplification cycles (Prediger, 2001).
Logarithmic or exponential amplification usually occurs only during the middle cycles
(Prediger, 2001). Comparison between gene expression levels and tissues can therefore
only be done for bands derived during this phase. This ensures that in each reaction the
amount of each reagent is not depleted. PCR samples obtained with each primer set were
removed after a prescribed number of cycles and were analyzed on a 1% agarose gel. An
example is shown for Gm FAωH-5 (Figure 10a). The relative intensity of the bands was
determined, and the number of cycles plotted against the relative intensity of the bands on
the gel (Figure 10b). A cycle within the exponential phase was chosen for each Gm FAωH
(Figure 10c), and used as the cycle number for subsequent RT-PCR. This analysis was
also done with the housekeeping gene, actin (ACT-11), as it was ultimately used as a
baseline in subsequent RT-PCR analyses. Cycle numbers for the gene specific primer sets,
on the whole, were high and ranged from 27 - 33 cycles. ACT-11’s cycle number was
21 M Cycle Number
2.5 kb 23 25 27 29 31 33
A)
Gene Cycle #
Gm FAωH-1 33
Gm FAωH-2 32
Gm FAωH-3 32
Gm FAωH-4 28
Gm FAωH-5 27
Gm FAωH-6 31
ACT-11 21 B) C) 3.0 kb 0 7500 15000 22500 30000
21 23 25 27 29 31 33
Gm FAωH-5 RT-PCR Standardization
Ad ju st e d V o lu me (I N T *mm2 ) Cycle Number
Figure 10: Optimizing cycle number for RT-PCR amplification of soybean FAωH genes.
A) 1% agarose gel showing PCR products generated using increasing cycle number for
Gm FAωH-5. Labels across the top indicate cycle number. Select bands are labeled in the
10 kb ladder lane (M). B) Graph of intensity of bands at each cycle number for Gm
FAωH-5. The intensity is measured as a background-adjusted volume (band
intensity*area). The black box shows the chosen cycle number within the exponential
phase. C) The chosen cycle number for each of the six putative Gm FAωHs and the
Since the specificity of these primers was vital to the outcome of tissue-specific
expression analyses, each primer pair was checked with genomic DNA using the optimal
salt concentration and temperature determined. This analysis resulted in a single band of
expected size for each gene; Gm FAωH-1 (2193 bp), Gm FAωH-2 (1625 bp), Gm FAωH-3
(2013 bp), Gm FAωH-4 (2012 bp), Gm FAωH-5 (2595 bp) and Gm FAωH-6 (2770 bp)
(Figure 11). The expected band sizes for Gm FAωH-5 and 6 are relatively large because of
introns in genomic DNA. The primers for Gm FAωH-1 consistently generated smears,
especially near the end of the data collection presented herein, and various
troubleshooting attempts could not eliminate this problem.
To ensure each PCR reaction only had a single product (i.e., each primer pair
amplified only one gene) and to further verify that the primers were amplifying the
specific gene they were designed to amplify, the PCR reactions that generated the
products shown in Figure 11 were purified and sent for sequencing. The sequencing
results (Appendix IV) confirmed that each PCR reaction yielded a single product, except
Gm FAωH-1. The smearing of Gm FAωH-1 most likely lead to the observed complex
sequencing result. Otherwise, alignments of each of the other PCR products,
corresponding to the five other genes, revealed a 99% match to the expected gene. This
2.5 kb
M
Gm FAωH
3
1 2 4 5 6
1.5 kb
Expected sizes
(kb) 2.193 1.625 2.013 2.012 2.595 2.770 3.0 kb
2.0 kb
Figure 11: PCR products of each putative Gm FAωH generated from genomic DNA. 1%
agarose gel showing the PCR products that were produced using the MgCl2 concentration
and annealing temperature optimized for each gene. Expected sizes for the genomic bands
are indicated below. GmFAωH-5 and GmFAωH-6 have relatively large genomic band
3.5 RT-PCR analysis of tissue-specific gene expression
The differential expression of each putative Gm FAωH was further examined in
vitro using PCR based on the conditions optimized for each primer pair (Section 3.4) and
equal amounts of cDNA from various soybean tissues (cv. Conrad), including root,
flower, seed (M2 and L1 stages), pod (M2 and L1 stages), stem and old and young leaves.
This was done with both non-DNase-treated (data not shown) and DNase-treated samples.
A biological replicate was also performed using two groups of samples (‘A’ and ‘B’). All
RT-PCR results were qualitatively assessed against the expression level of a housekeeping
gene transcript (ACT-11). Genomic DNA was used as a positive control to show that the
conditions worked with each primer and a negative control (no transcript) was also
included to make sure there wasn’t any contamination or nonspecific amplification.
Additionally, a control experiment was run with tissue samples generated without reverse
transcriptase to ensure that any amplification that occurred in the sample was derived
from the synthesized cDNA and not genomic DNA or other amplicon contamination.
These are illustrated for ACT-11 (Figure 12).
While smearing continued to be a problem for the Gm FAωH-1 primer set, faint
bands of the correct size were visible with cDNA from flower and M2 and L1 stage pod
tissues (Figure 13). This corresponded well with both the RNA-Seq and EST data in that
flower tissue showed high expression levels with both of these in silico analyses.
Conversely, RT-PCR did not reveal Gm FAωH-1 expression in young leaves or seeds,
which was where the highest expression was found with RNA-Seq and, at least moderate