An Efficient & Detailed Digital Image Feature
Extraction Method Using K-NN Algorithm And
Image Tags
Gaurav Mandloi1 , Prof. Kshitij Pathak2
1
PG Scholar, 2Associate Professor & Head, 1,2
Department of Information Technology, Mahakal Institute Of Technology Behind Air Strip, Dewas Road Ujjain(M.P)-456001
Abstract— Image feature extraction is the process getting informative knowledge about that image that can be used in various applications that involve image matching and differentiation like face reorganization, pattern reorganization, etc. There are various feature extraction and vector calculation methodologies, we could find in the literature an available but still demand of details and accuracy could not meet as we could find in the literature survey. In this work we are proposing an efficient and detailed image extraction method for digital color images using k-NN algorithm. We could investigate it that inclusion of k-NN and image tagging can be very useful for feature extraction and matching of digital images as it gives detailed and huge extracted features that can be used in many of the applications. We are proposing a system which can extract and store the features and tags from the given set of images and finally this database becomes input to k-NN algorithm to produce more accurate and detailed results.
Keywords
—
Digital image, feature extraction, k-Nearest Neighbor algorithm (k-NN), tags, patterns, Levenshtein distances, training, pixels,I. INTRODUCTION
In machine learning procedure data is perceived utilizing their compelling patterns and extricated utilizing the closeness between these patterns. To discover the conspicuous patterns among the data needed to lessen the measure of data and concentrate the genuine relationship or difference between two data instances. These relationships or differences are figured utilizing the substance of the data. Accordingly, that is a complex domain; where uncertainty and random nature of the data can be misinform the real decision or recognition design.
The exhibited work in this paper is an assessment of techniques by which the ideal properties between the data can be assessed to discover and from the ideal properties by which the nature of data and the pattern of the data can be recognized. The introduced work is an assessment of the image data and discovering the most suitable feature extraction strategy, with a specific end goal to use them in different applications.
For a legitimate understanding of the connection between the data processing and image processing, first we take a sample, assume we have a set of random documents, for ordering or fitting game plan of these documents as
indicated by their domain, needed to discover some knowledge about the document substance, consequently initially needed to peruse a document and afterward assess the domains and theme dwell in the given document. In the same route for discovering the suitable patterns over the given data, pre-processing, data model construction and implementation in problem is needed.
Image is a different sort of data which includes a tremendous measure of information, such as color information, objects, edges, pixel definition, dimensions and others. Along these lines the treatment of image data is a sensitive concern to preserve the complete information. This paper addresses the various key features and properties of image data by which the information from the image is separated and used for different applications of face recognition, image retrieval and others.
II BACKGROUND STUDY
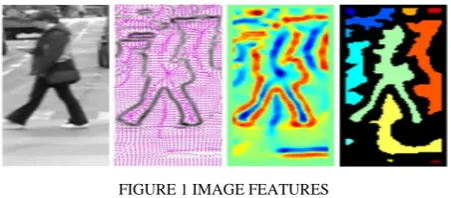
As we realize that local features are the image patterns which vary from its immediate neighborhood. It is usually influenced by the change of an image property or several properties simultaneously, in spite of the fact that it is not necessary localized precisely on these changes. There are predominantly three properties usually considered- intensity, color, and texture. Figure 1 shows some examples of local features into account our image as well as in a gray value image. Local features can be pointed, additionally edges or small image patches. Ordinarily, some measurements are taken from a region focused on a local feature and changed over into descriptors. The descriptor scan then be used for various applications [1].
FIGURE 1 IMAGE FEATURES
Good features should have the following properties:
of variety, such that features can be distinguished and matched.
Repeatability: Given two images of the same objector view, taken under diverse viewing conditions, a high rate of the features perceived on part observable in both images should be found in both images.
Locality: The features should be limited, so as to decrease the probability of occlusion and to permit simple model estimates of the geometric and photometric deformations between two images taken under different viewing circumstances (e.g.: based on a local planarity assumption).
Accuracy: The detected features should be accurately localized, in both image location, with respect to scale and possibly shape.
Efficiency: Preferably, the recognition of features in a new image should allow for time-critical applications. Repeatability, debatably the most significant property of all, can be achieved in two different ways: either by invariance or by robustness.
Quantity: The number of detected features should be satisfactorily large, such that a sensible number of features are detected even on small objects. However, the optimal number of features depend on the application. Ideally, the number of identified features should be controllable over a large range by a simple and intuitive threshold. The density of features should reflect the information content of the image to provide a compact image representation.
Robustness: In case of relatively small deformations, it often suffices to make feature detection methods less sensitive to such deformations, i.e., the accuracy of the detection may decrease, but not drastically. Typical deformations that are tackled using robustness are image noise, discretization effects, compression artifacts, blur, etc. Also geometric and photometric deviations from the mathematical model used to obtain invariance are often overcome by including more robustness.
Invariance: When large deformations are to be projected, the preferred approach is to model these mathematical if possible, and then develop methods for feature detection that are unaffected by these mathematical transformations.
III. LITERATURE
R
EVIEWAn image retrieval system can be defined as searching, browsing, and retrieving images from massive databases consisting of digital images. Although Conventional and common techniques of retrieving images make use of adding metadata namely captioning keywords so as to perform annotation of words. However image search can be described by the dedicated technique of search which is mostly used to find images.
With the development of the Internet, and the availability of image capturing devices such as digital cameras, huge amounts of images are being created every day in different areas including remote sensing, fashion, crime prevention, publishing, medicine, architecture, etc. For this purpose, the requirement for the development of proficient and effectual
methodologies to supervise large image databases for retrieval is urgent so many general- purpose image retrieval systems have been developed. There are three techniques for image retrieval: text-based method, content-based method and hybrid method. This section explains in detail each method. The image retrieval system can be classified as:
• Text based Image retrieval system
• Content Based Image retrieval system
Text Based Image Retrieval (TBIR) is presently used in almost all general-purpose web image retrieval systems today. This approach uses the text connected with an image to determine what the image contains. This text can be text surrounding the image, the image's filename, a hyperlink important to the image, an explanation of the image, or any other part of text that can be associated with the image. Google, Yahoo Image investigates engines are instances of systems using this approach. Although these search engines are rapid and vigorous, they sometimes fail to retrieve relevant images, this is because of many reasons-
• Firstly, there are too many inappropriate words in the surrounding textual descriptions, which consequences in low image search precision rate.
• Secondly, the surrounding text does not seem to fully explain the semantic content of Web images, which results in lower image search recall rate.
• The third trouble is a polysemy problem (same word can be used to submit to more than one object). Due to the query polysemy, the results searcher will fail to find images tagged with Chinese, and a Dutch searcher will fail to find images tagged in English. This means the query must match the language of the text associated with the images.
Content Based Image Retrieval is a set of techniques for retrieving semantically-relevant Images from an image database based on automatically-derived image features [3]. This aims at avoiding the use of textual descriptions and instead retrieves images based on their visual similarity to a user-supplied query image or user-specified image features.
The main goal of CBIR is efficiency during image indexing and retrieval, thereby reducing the need for human intervention in the indexing process [4]. The computer must be able to retrieve images from a database without any human assumption on specific domains (such as texture vs. non texture). One of the main tasks for CBIR systems is similarity comparison, extracting feature of every image based on its pixel values and defining rules for comparing images. These features become the image representation for measuring similarity with other images in the database. There are various feature vector calculation methods that are consumed to design an algorithm for image retrieval system.
Grid Color Moment
insensitive to the rotation and zoom of the image. Color not only adds beauty to objects but also more information, which is used as a powerful tool in content-based image retrieval. In color index, given a query image, the goal is to retrieve all the images whose color and texture, compositions are similar to those of the query image. In color image retrieval there are various methods, but here we will discuss some prominent methods.
The feature vector we will use is called "Grid-based Color Moment". Here is how to compute this feature vector for a given image: [8]
• Convert the image from RGB for HSV color space (Hint: use the function rgb2hsv in Matlab for this operation)
• Uniformly divide the image into 3x3 blocks
• For each of these nine blocks
• Compute its mean color (H/S/V)
Where N is the number of pixels within each block, is the pixel intensity in H/S/V channels.
• Compute its variance (H/S/V)
• Compute its skewness(H/S/V)
• Each block will have 3+3+3=9 features, and thus the entire image will have 9x9=81 features. Before we use SVM to train the classifier, we first need to normalize the 81 features to be within the same range, in order to achieve good numerical behavior. To do the normalization, for each of the 81 features:
• Compute the mean and standard deviation from the training dataset
Where M is the number of images in the training dataset, and fi is the feature of the ith training sample.
• Perform the "whitening" transform for all the data (including both the training data and the testing data), and get the normalized feature value:
Canny Edge Detection
The purpose of edge detection in general is to significantly reduce the amount of data in an image, while preserving the structural properties to be used for further image processing. Several algorithms exists, and this worksheet focuses on a particular one developed by John F. Canny (JFC) in 1986. [9, 10]
The algorithm runs in 5 separate steps:
1. Smoothing: Blurring of the image to remove noise.
2. Finding gradients: The edges should be marked where the gradients of the image has large magnitudes.
3. Non-maximum suppression: Only local maxima should be marked as edges.
4. Double thresholding: Potential edges are determined by thresholding.
5. Edge tracking by hysteresis: Final edges are determined by suppressing all edges that do not connect to a very certain (strong) edge.
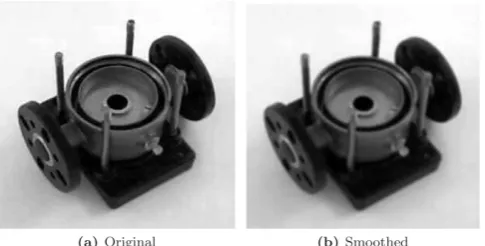
Smoothing
FIGURE 3 SMOOTHING EFFECT ON IMAGE
It is inevitable that all images taken from a camera will contain some amount of noise. To prevent that noise is mistaken for edges, noise must be reduced. Therefore the image is first smoothed by applying a Gaussian filter. The kernel of Gaussian filter with a standard deviation σ = 1.4. The effect of smoothing the test image with this filter is shown in Figure.
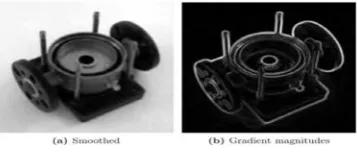
Finding gradients
The gradient magnitudes (also known as the edge strengths) can then be determined as an Euclidean distance measure by applying the law of Pythagoras.
It is sometimes simplified by applying Manhattan distance measure to reduce the computational complexity.
The Euclidean distance measure has been applied to the test image. The computed edge strengths are compared to the smoothed image in Figure (4).
FIGURE 4 GRADIENT MAGNITUDES OF IMAGE
That's an image of the gradient magnitudes often indicates the edges quite clearly, However, the edges are typically broad and thus doing not indicate exactly where the edges are. To make it possible to determine this, the direction of the edges must be determined and stored as.
Non-maximum suppression
Purpose of this step is to convert the “ blurred”edges in the image of the gradient magnitudes to “sharp” edges.
Basically, this is done by preserving all local maxima in the gradient image, and deleting everything else. The algorithm is for each pixel in the gradient image:
1. Round the gradient direction θ to nearest 45◦, corresponding to the use of an 8-connected neighborhood.
2. Compare the edge strength of the current pixel with the edge strength of the pixel in the positive and the negative gradient direction. I.e. if the gradient direction is north (theta = 90◦), comparison with the pixels to the north and south. 3. If the edge strength of the current pixel is largest;
preserve the value of the edge strength. If not, suppress (i.e. remove) the value.
Double thresholding
The edge-pixels remaining after the non-maximum suppression step are (still) marked with their strength pixel-by-pixel. Many of these will probably be true edges in the image, but some may be caused by noise or color variations for instance due to rough surfaces. The simplest way to discern between these would be to use a threshold, so that only edges stronger that a certain value would be preserved. The Canny edge detection algorithm uses double thresholding. Edge pixels stronger than the high threshold are marked as strong; edge pixels weaker than the low threshold are suppressed and edge pixels between the two thresholds are marked as weak.
Edge tracking by hysteresis
Strong edges are interpreted as “certain edges”, and can immediately be included in the final edge image. Weak edges are included if and only if they are connected to strong edges. The logic is of course that noise and other small variations are unlikely to result in a strong edge(with
proper adjustment of the threshold levels). Thus strong edges will (almost) only be due to true edges in the original image. The weak edges can either be due to true edges or noise/color variations. The latter type will probably be distributed independently of edges on the entire image, and thus only a small amount will be located adjacent to strong edges. Weak edges due to true edges are much more likely to be connected directly to strong edges.
Edge tracking can be implemented by BLOB-analysis (Binary Large Object). The edge pixels are divided into connected BLOB’s using 8-connected neighborhood. BLOB’s containing at least one strong edge pixel is then preserved, while other BLOB’s are suppressed. The effect of edge tracking on the test image is shown in Figure.
Figure 5 Blob Analysis
Local Binary Pattern
Given a pixel in the image, an LBP [11] code is computed by comparing it with its neighbours:
Where is the gray value of the central pixel, is the value of its neighbours, P is the total number of involved neighbours and Ris the radius of the neighbourhood. Suppose the coordinate of is (0, 0), then the coordinates of are
The gray values of neighbours that are not in the image grids can be estimated by interpolation. Suppose the image is of size I*J after the LBP pattern of each pixel is identified, a histogram is built to represent the texture image:
The uniform LBP patterns refer to the patterns which have limited transition or discontinuities ( ) in the circular binary presentation. In practice, the mapping from to which has P*(P-1)+3 distinct output values, is implemented with a lookup table of elements to achieve rotation invariance, a locally rotation invariant pattern could be defined as:
The mapping from to which has P+2 distinct output values.
GABOR filter
In the one-dimensional case, the Gabor function consists of a complex exponential (a cosine or sine function, in real case) localized around x = 0 by the envelope with a Gaussian window shape [10].
for and , where is a variance and is a frequency. Dilation of the complex exponential function and shift of the Gaussian window when the dilation is fixed form kernel of a Gabor transform. The Gabor transform (a special case of the short-time Fourier transform) employs such kernel for time-frequency signal analysis. The mentioned Gaussian window is the best time frequency localization window in a sense of the Heisenberg uncertainty principle [12].
In a two-dimensional case, the absolute square of the correlation between an image and a two-dimensional Gabor function provides the spectral energy density concentrated around a given position and frequency in a certain direction. Moreover, the two-dimensional convolution with a circular (non-elliptical) Gabor function is separable to series of one-dimensional ones
for and Here, the actual frequency of the two-dimensional function is determined by Furthermore is an angle between x-axis and a line perpendicular to the ridges of a wave.
Gabor Wavelet
Elements of a family of mutually similar Gabor functions are called wavelets when they are created by dilation and shift from one elementary Gabor function (mother wavelet), i.e.
for (scale) and (shift). By convention, the mother wavelet has the energy localized around = 0 as well as all of the wavelets are normalized . Although the Gabor wavelets do not form orthonormal bases, the discrete set of them form a frame
The used notation is in accordance with [13]. The first order partial derivative of image I with respect to variable x is denoted by . Analogously denotes the second order partial derivative with respect to xand is the second order mixed derivative. Furthermore ) denotes a partial derivative obtained at the location of a point x and calculated by using a Gabor wavelet with scale
Edge Detection
For the edge detection, the convolution in two perpendicular directions is performed with variously dilated wavelets (e.g., separately in row and column directions). It is necessary to use a wavelet which serves as the first order partial differential operator (e.g., a first derivative of a Gaussian function).Consequently, local maxima of module
are found. Only the maxima above a given threshold are considered (due to noise and slight edges). Asa result, the edges for each scale are obtained.
Corner Detection
The key idea is to obtain the partial derivatives needed for a construction of an autocorrelation matrix
by using the convolution with the Gabor wavelets. A Gaussian window of SI scale is used for averaging of the derivatives. On this matrix, detectors are based. Also here, it is necessary to use such a Gabor wavelet which serves as the first order partial differential operator.
Blob Detection
Following the same principle, blobs can be detected [14] from the second order partial derivatives using a Hessian matrix
IV. PROPOSED SYSTEM
compresses the image and calculation of pixel values from the images. Greater efficiency of the algorithm is added
advantage in the content based system. as shown in fig. 6 below :
In this paper, we are proposing a feature extraction and image retrieval system using k-Nearest Neighbors algorithm(k-NN).In this work we investigated a method that prepares a database of features extracted from images provided to the system as an input from the local repository. Images were attached with a tag that also being stored in a database so as to compare with other images.The above process is the part of training the system. Firing test query on the features of the images retrieves the other images with the same tags stored in the database and Levenshtien distance being also calculated and given as an input to k-NN.
k-Nearest Neighbors algorithm(k-NN) algorithms is power full algorithm that can be very help full in image extraction. In this process it extracts color features and age features of the images. Results of k-NN algorithm is very useful and accurate in the various applications.
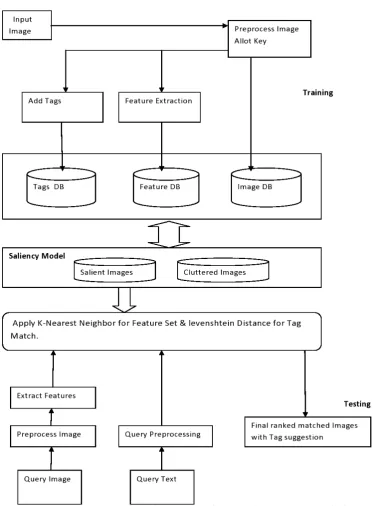
An efficient & detailed digital image feature extraction method using k-NN algorithm and image tags architecture of the system is shown in the Fig.6 and divided into four different stages or modules; training, testing ,feature extraction, results generation. The process involves different steps of execution as explained below:
I. Training: In this process the system is being trained against the input set of digital images. System extracts and stores the features of the given set of images into the images database and features of the images into the feature database as shown in the architecture. Input images are also added with a tag that will in relevance with image. The tags also stored into the database,in which it can use to become a large dataset and retrieve more images with similar tags. In this process, we create a base for the k-NN algorithm.
In training , saliency model works as a filter for query image requested by user. When K-NN gives result for query image, saliency model again filters all the images and gives best results which is needed. It contains two parts, the first part salient image says first image that a viewer sees when looking at an image. The second part cluttered image says that an image which include so many objects in a single image from which a user have to find the real objet to capture that original image. II. Testing: In this part one can fire a query with any
digital image or a text query in the form of tags.The system will fetch any digital image and extract features and relevant tags. The next process is to search similar tags into the stored tags in the database previously and search for the image related to tag extracted. In the other part of this operation one can fire text query onto the image for the calculation of Levenshtien distances in the pixels of the images that also become the input of k-NN algorithm.
III. Feature Extraction: In this process k-NN comes into the system, it takes features and tags of the queried image also with Levenshtien distances and produce features of the images. We can get a huge amount of features from the system that can be used in various applications
IV. Results :The algorithm is so efficient that produces an enormous amount of features including Color and Age features. The algorithms produce 9X9 color features that is 81 features for the image. For the Age features it creates 360 degree orientation with 10 numbers of parts that evaluated with 10 parts of 36 features each. The results can be efficiently used in the various applications like face recognition, biometric authentication etc. The proposed system is found to be efficient and accurate as compared to the previous methods found in the literature. The system can give guarantee about the authenticity of the resulted features and found with the great usefulness in industry and other futuristic research work.
V. CONCLUSION AND FUTURE WORK
In this work we are proposing an efficient and detailed image extraction method for digital color images using NN algorithm. We could investigate it that inclusion of k-NN and image tagging can be very useful for feature extraction and matching of digital images as it gives detailed and huge extracted features that can be used in many of the applications. We are proposing a system which can extract and store the features and tags from the given set of images and finally this database becomes input to k-NN algorithm to produce more accurate and detailed results.
In near future this technique is utilized to introduce a new image feature calculation technique, which is used for color image recognition and clearer and efficient edge detection.
REFERENCES
[1] Krystian Mikolajczyk, Tinne Tuytelaars, “Local Image Features”,Universiteit Leuven, KasteelparkArenberg 10, Leuven,Belgium
[2] Minsu Cho, Jungmin Lee, and Kyoung Mu Lee,“Reweighted Random Walks for Graph Matching”, Computer Vision–ECCV 2010, 2010 – Springer
[3] PritiMaheswary, Dr.NamitaSrivastava, “Retrieval of Remote Sensing Images Using Color & Texture Attribute”,(IJCSIS) International Journal of Computer Science and Information Security,Vol. 4,No. 1&2, 2009
[4] S. Oraintara, T. T. Nguyen, “Using Phase and Magnitude Information of the Complex directional Filter Bank for Texture Image Retrieval”, IEEE International Conference on Image Processing, Vol. 4, Pages 61-64, Oct. 2007
[5] P. S. Hiremath and JagadeeshPujari. “Content Based Image Retrieval based on Color, Texture and Shape features using Image and its complement”, International Journal of Computer Science and Security, Volume (1) : Issue (4)
[6] Philipp Sandhaus, Mohammad Rabbath, and Susanne Boll,“Employing Aesthetic Principles for Automatic PhotoBookLayout”,Advances in Multimedia Modeling, 2011 – Springer
[7] Michele Saad, “Low-Level Color and Texture Feature Extraction for Content-Based Image Retrieval”, Final Project Report, EE 381K: Multi-Dimensional Digital Signal Processing, Pages: 20-28, May 2008
[8] Yu-Gang Jiang, Jun Yang, Chong-Wah Ngo, Alexander G. Hauptmann, “Representations of Key point-Based Semantic Concept Detection: A Comprehensive Study”, IEEE, 2008
[9] Canny Edge Detection, March 23, 2009
[10] MasoudNosrati, RonakKarimi, Mehdi Hariri, “Detecting Circular Shapes From Areal Images Using Median Filter and CHT”, World Applied Programming, Vol (2), Issue (1), . 49-54,January 2012 [11] ZhenhuaGuo,LeiZhang,David Zhang, “A Completed Modeling of
[12] S. Mallat, “A Wavelet Tour of Signal Processing : The Sparse Way”, 3 edition, 2009
[13] Joni-KristianKamarainen, “Gabor Features in Image Analysis”, Machine Vision and Pattern Recognition Laboratory, Lappeenranta University of Technology (LUT Kouvola)
[14] Larnaca, Cyprus, “An MPEG-7 Image Retrieval Systemof Atherosclerotic Carotid Plaque Images”, IEEE 12th International Conference on Bioinformatics& Bioengineering (BIBE), 11-13 November 2012